A note on lower timeframe confirming price action…
Waiting for lower timeframe confirmation is our main tool to confirm strength within higher timeframe zones, andhas really been the key to our trading success. It takes a little time to understand the subtle nuances, however, as each trade is never the same, but once you master the rhythm so to speak, you will be saved from countless unnecessary losing trades. The following is a list of what we look for:
- A break/retest of supply or demand dependent on which way you’re trading.
- A trendline break/retest.
- Buying/selling tails – essentially we look for a cluster of very obvious spikes off of lower timeframe support and resistance levels within the higher timeframe zone.
- Candlestick patterns. We tend to only stick with pin bars and engulfing bars as these have proven to be the most effective.
EUR/USD:
Weekly recap:
Following the bullish weekly pin-bar candle that formed just above the weekly ascending trendline (1.0461), the EUR currency extended higher last week, gaining close to 150 pips into the close 1.1107. Consequent to this move, price is now trading mid-range on the weekly timeframe. Buyers and sellers are not only capped by weekly demand and supply (1.0519-1.0798/1.1532-1.1278), but are also seen compressing between two weekly trendlines (1.0461/1.1532) painting a potential bearish pennant. Turning our attention to the daily timeframe, we can see that after a steep five-day rally from around the 1.0880 mark price hit a ceiling of offers on Wednesday between 1.1233/1.1148.
Looking at the 4hr timeframe, the pair appears to be in the process of forming a tight 4hr bullish pennant (1.1212/1.1079) held together by two psychological limits, 1.1200 and 1.1100. Other than this though, it was a rather uneventful Friday.
Transferring into a new week, trade opened six pips higher this morning at 1.1113. In view of price currently trading at both round-number support 1.1100 and also the lower limit of a 4hr bullish pennant formation (1.1079), where do we go from here?
Well, considering that the weekly timeframe shows room to continue advancing north this week up to at least the lower boundary of the aforementioned weekly supply zone, we could look to enter long at the market’s current position. Be that as it may, price is presently showing resistance on the daily scale (see above) and also room to move south at the moment, so one certainly needs to tread carefully here. That being the case, here is what we have noted so far:
- Look for CONFIRMED long entries at the 1.1100 barrier today. Expect price to fake lower, however, down to 1.1082. Stop losses would be best placed five pips below this number for safety even with confirmation. Targets for this trade would be the upper limit of the 4hr bullish pennant, followed closely by 1.1200 and 1.1233 – a daily Quasimodo resistance level. Both 1.1200 and 1.1233 could make for very nice sell zones this week, so do keep these numbers on your watchlists.
- In the event that 1.1082 gives way, there may be a potential intraday short trade on the retest of this number down to 4hr demand at 1.1009-1.1039. Waiting for lower timeframe confirmation following the retest would be advised.

Levels to watch/live orders:
- Buys:1.1100 [Tentative – confirmation required] (Stop loss: ideally five pips below 1.1082).
- Sells:Watch for 1.1082 to be consumed and then look to enter on a retest of this number (confirmation required) Note that 1.1200 and 1.1233 are potential sell levels.
GBP/USD:
Weekly recap:
Cable once again defended the weekly swap (support) level at 1.5451 last week, which, as you can see, has provided a temporary ‘floor’ in this market since price collided with it on the 06/07/15. As a result, last week’s losses were erased with price gaining a little over 150 pips into the close 1.5643. From the daily scale, however, last week’s buying forced price to end the week just below a proven daily supply zone coming in at 1.5787-1.5687. This area is certainly one to have on your watchlists!
And finally, a quick look at how Friday’s sessions on the 4hr timeframe panned out show that the minor 4hr (swap) support barrier at 1.5602 stood its ground and held this market higher. The push from this level saw price trade back into1.5674-1.5642 – a well and truly proven 4hr resistance base – just look at how many times this area held this market lower recently.
Little change was seen over the weekend – trade opened just four pips higher than Friday’s close at 1.5647. In that price remains trading at the 4hr resistance base 1.5674-1.5642, our attention will mostly be driven toward shorts today/this week.
Despite this, selling at current prices is considered a potentially risk trade in our book. Check out the 4hr supply area coming in just above at 1.5731-1.5700. This area is not only located just within the aforementioned daily supply zone, but is also positioned close to a weekly swap(resistance) level at 1.5733. Therefore, we may see price break above the current 4hr zone to connect up with the 4hr supply area coming in at 1.5731-1.5700.
For this reason, our plan of attack today will likely consist of looking for lower timeframe entries (30/60 minute preferred) within the current 4hr zone. Assuming, however, that price does indeed drive above this area, we’d then likely look to enter a marketable short at 1.5700, since we’d have higher-timeframe confluence in play then.
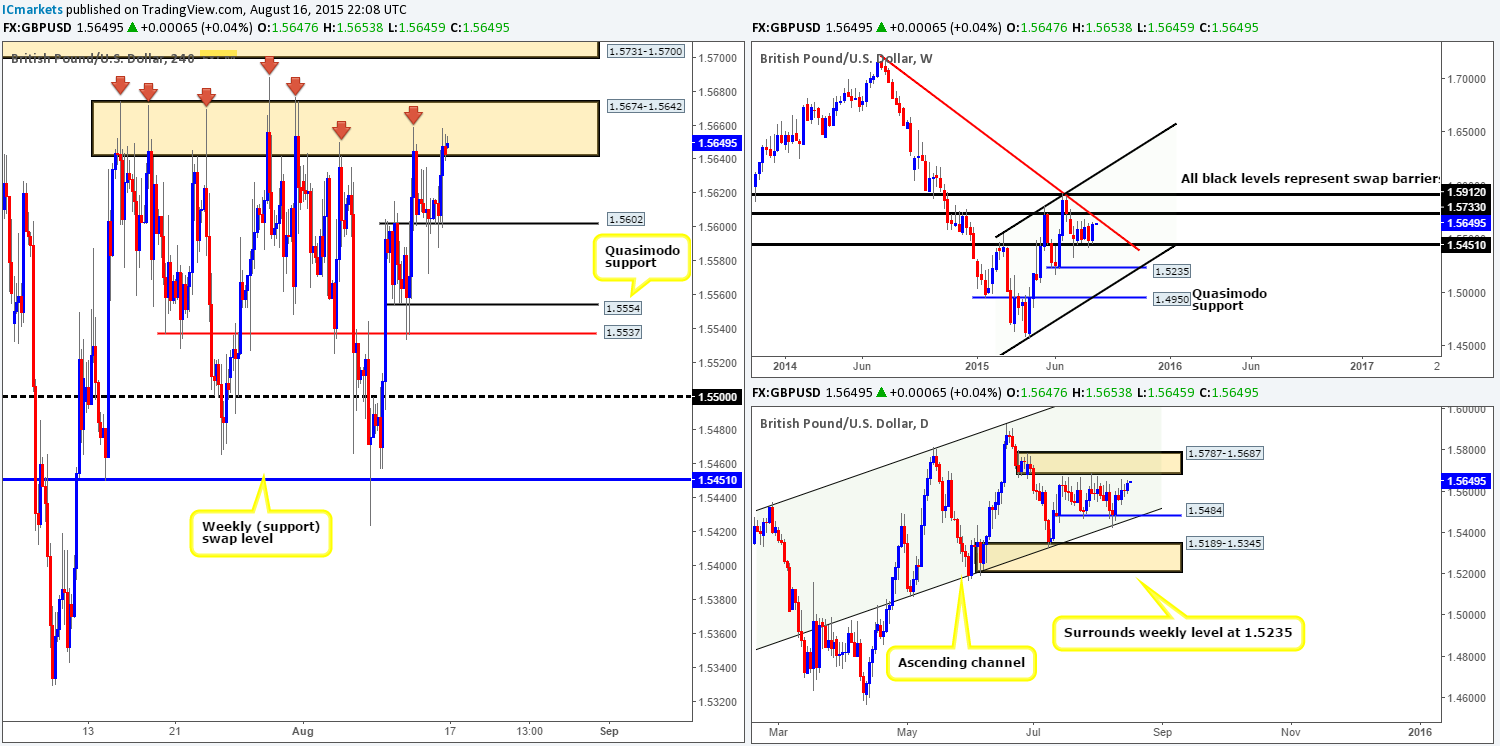
Levels to watch/ live orders:
- Buys: Flat (Stop loss: N/A).
- Sells: 1.5674-1.5642 [Tentative – confirmation required] (Stop loss: dependent on where one confirms this area) 1.5700 (Stop loss: aggressive stops at 1.5736 – conservative at 1.5790).
AUD/USD:
Weekly recap:
Despite the fact that this market remains entrenched in a humongous downtrend, price was once again able to hold firm last week around a long-term weekly demand area coming in at 0.6951-0.7326. However, the AUD/USD pair still ended up losing 44 pips off its value into the close 0.7372. Rolling a page lower to the daily timeframe, shows heavy bulls came into the market on Wednesday from a daily swap (support) level at 0.7227. This forced price up to just below a minor daily resistance level at 0.7418, which is where price spent the remainder of the week.
The viewpoint from the 4hr timeframe reveals Friday’s trade was, in our opinion, rather laborious. The rebound from the 4hr swap (support) level at 0.7338 saw a small extension higher, consequently hitting and respecting a temporary 4hr resistance at 0.7388 to end the week.
As we move into a new weekprice remained unaffected during weekend trade, opening a pip lower than Friday’s close at 0.7371. Now, with 0.7388 currently holding this market lower right now, this could pull prices down to test the 4hr swap (support) level at 0.7338 sometime today. However, this is not really what we’re interested in.
Check out both the weekly and daily timeframes. As you can see, price has yet to connect with either daily resistance at 0.7418, or the weekly swap (supply) area at 0.7449-0.7678. As such, price still has room to appreciate this week. Assuming that this does take place, we’ll be looking for 0.7388 to be consumed (hence the lack of interest selling this level) and for price to join hands with 0.7418/0.7436 – our sell zone. The only grumble we have in selling this zone is that price could fake higher to cross swords with the 0.7447 – essentially the lower edge of the aforementioned weekly swap (supply) zone. Therefore, we’d recommend waiting for some sort of lower timeframe selling signal before risking capital on this idea.
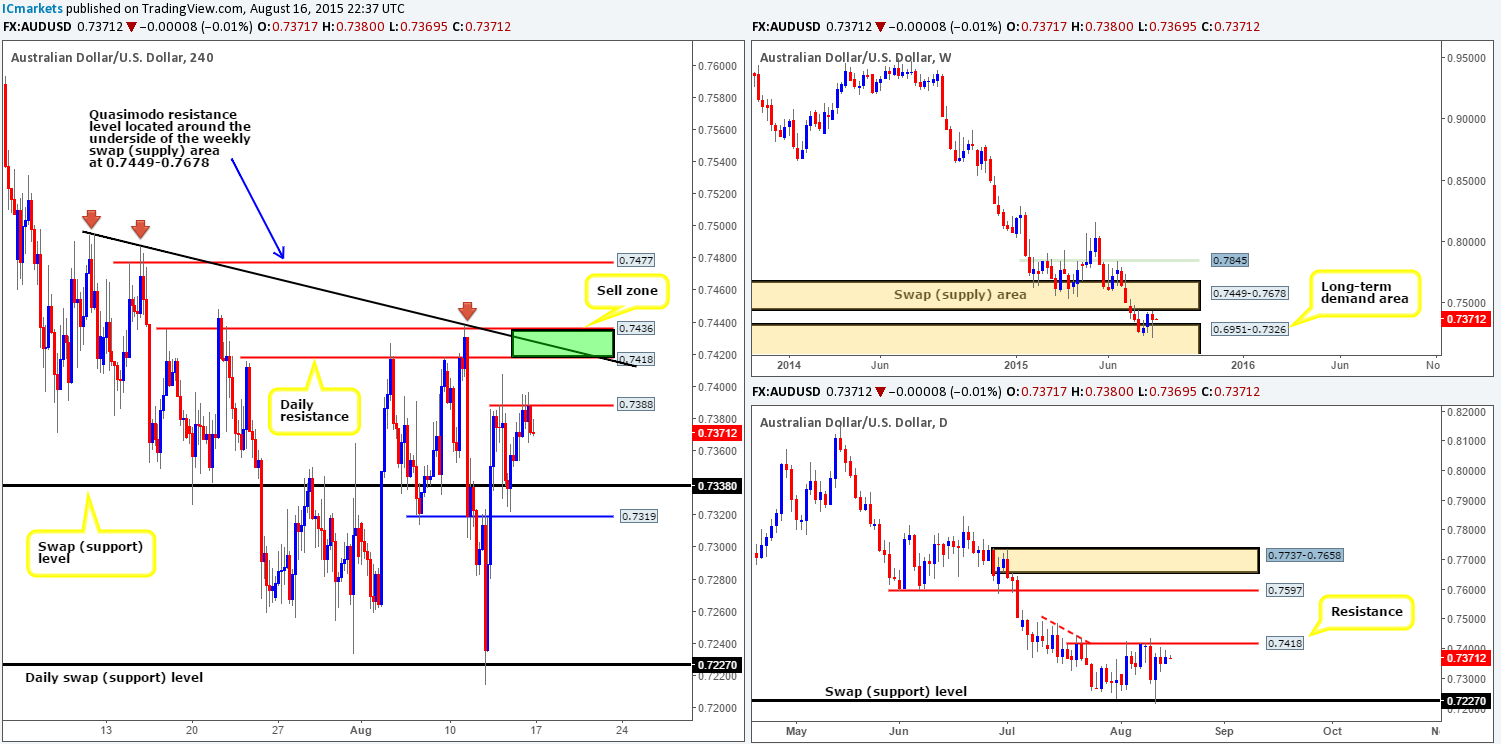
Levels to watch/ live orders:
- Buys: Flat (Stop loss: N/A).
- Sells: 0.7418/0.7436 [Tentative – confirmation required] (Stop loss: dependent on where one finds confirmation within this area).
USD/JPY:
Weekly recap:
The USD/JPY pair printed yet another weekly bearish pin-bar candle twenty or so pips below the weekly swap (resistance) level at 125.44,consequently ending the week on a pitiful ten-pip gain into the close 124.30. Last week’s daily movement, nonetheless, reveals that price once again sold off from a significant daily Quasimodo resistance level at 125.04, pushing price into the jaws of a daily demand area at 123.51-124.01. The reason for its significance comes from not only being lodged within a daily resistance area at 125.69-124.62, but also as it is trading so very near to the aforementioned weekly swap (resistance) level.
Going down one more, trade on the 4hr timeframe reveals price spent Friday’s sessions grinding lower from 124.53, as reported may happen in our previous report. This, as you can see, brought the market down to lows of 124.04 on the day with very little buying interest seen until the very last printed candle.
Price action began the new week relatively calm with a small gap lower of nine pips at the open 124.21. On the assumption that this market continues to sell-off going into today’s sessions, we’ll likely see price shake hands with 124.00. Granted, this could be a potential level in which to look to buy from today considering that price is now trading at daily demand (see above). Nevertheless, with the two back-to-back selling tails recently painted just below the aforementioned weekly swap (resistance) level, we remain hesitant here. As such, if 124.00 sees action today, and gives way we might, just might, see prices decline all the way down to 4hr demand coming in at 123.00-123.23. Here’s why…
- As just mentioned, selling tails printed just below the weekly swap (resistance) level at 125.44. In addition to this, there is also space for price to move lower down to the weekly swap (demand) area at 122.01-121.40.
- The 4hr demand consumption tails painted to the left (pink circles) at 123.51/123.32 suggests that below 124.00, the path south is clear of major bids until the aforementioned 4hr demand zone.
- Recent action is in the process of forming the C-leg of an AB=CD bullish pattern which conveniently completes at the 4hr demand area seen at 123.00-123.23.
To trade this potential down move, however, we’d need to see a break/retest of 124.00along with corresponding lower timeframe selling confirmation. This way, at least we’d be confident price has consumed any bids remaining at 124.00 support.
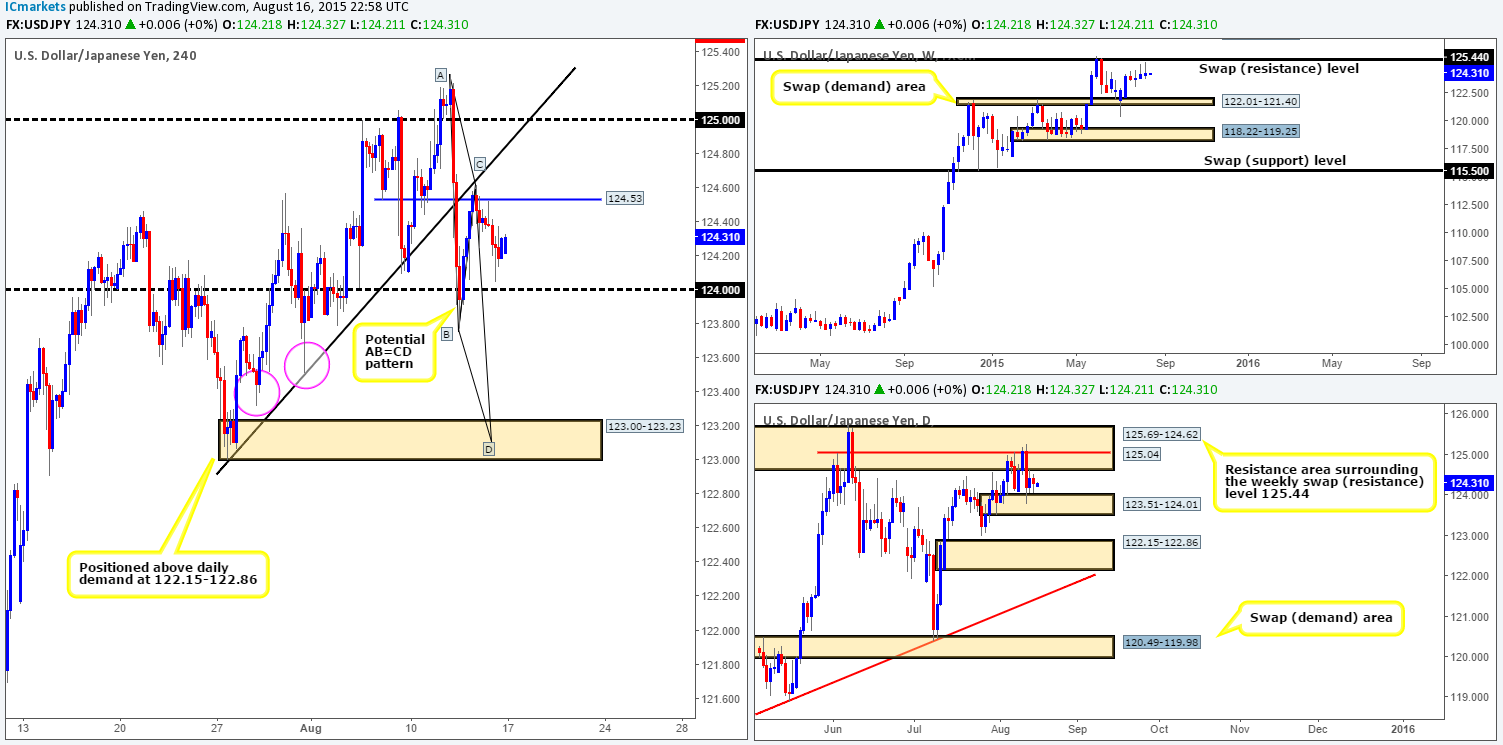
Levels to watch/ live orders:
- Buys: Flat (Stop loss: N/A).
- Sells: Watch for 124.00 to be consumed and then look to enter on a retest of this number (confirmation required).
USD/CAD:
Weekly recap:
Little change was seen on the USD/CAD last week, resulting in price forming a weekly indecision candle into the close1.3093. This candle found support and resistance between bids at the ignored weekly Quasimodo level at 1.3014, and offers sitting at the weekly swap (resistance) level at 1.3128. From the daily scale, we witnessed price connect with bids just above daily demand at 1.2859-1.2941 (located just below the aforementioned ignored weekly Quasimodo level) on Wednesday, which saw this pair rally for the remainder of the week.
Like most of the major pairs, Friday’s sessions on the 4hr timeframe were somewhat uneventful. Following Thursday’s break above the mid-level number 1.3050, price retested this hurdle – along with the lower limit of the 4hr ascending channel (1.2652/1.3023) as support on Friday. This eventually saw the USD rally hitting highs of 1.3096 at the end of trade.
Crossing over into a new week, however, price began with a three-pip gap lower at the open 1.3090. Thanks to this, trade action remains lurking just below round-number resistance at 1.3100.
Until either the ignored weekly Quasimodo level at 1.3014 or the weekly swap (resistance) level at 1.3128 is taken out, we’re not seeing much in the way of direction on the weekly timeframe. Daily action, however, shows that there is room for prices to continue trading north up to the long-term daily supply zone coming in at 1.3246-1.3177 this week. Therefore, entering short at 1.3100 is not something we’d stamp high probability today. In that case, should this number give way, could we look to enter long on any retest of this number? It is possible, but with near-term 4hr supply looming just above at 1.3180-1.3140, one would need a very tight stop! With everything taken into consideration, we’ve decided to remain flat on this pair for the time being.
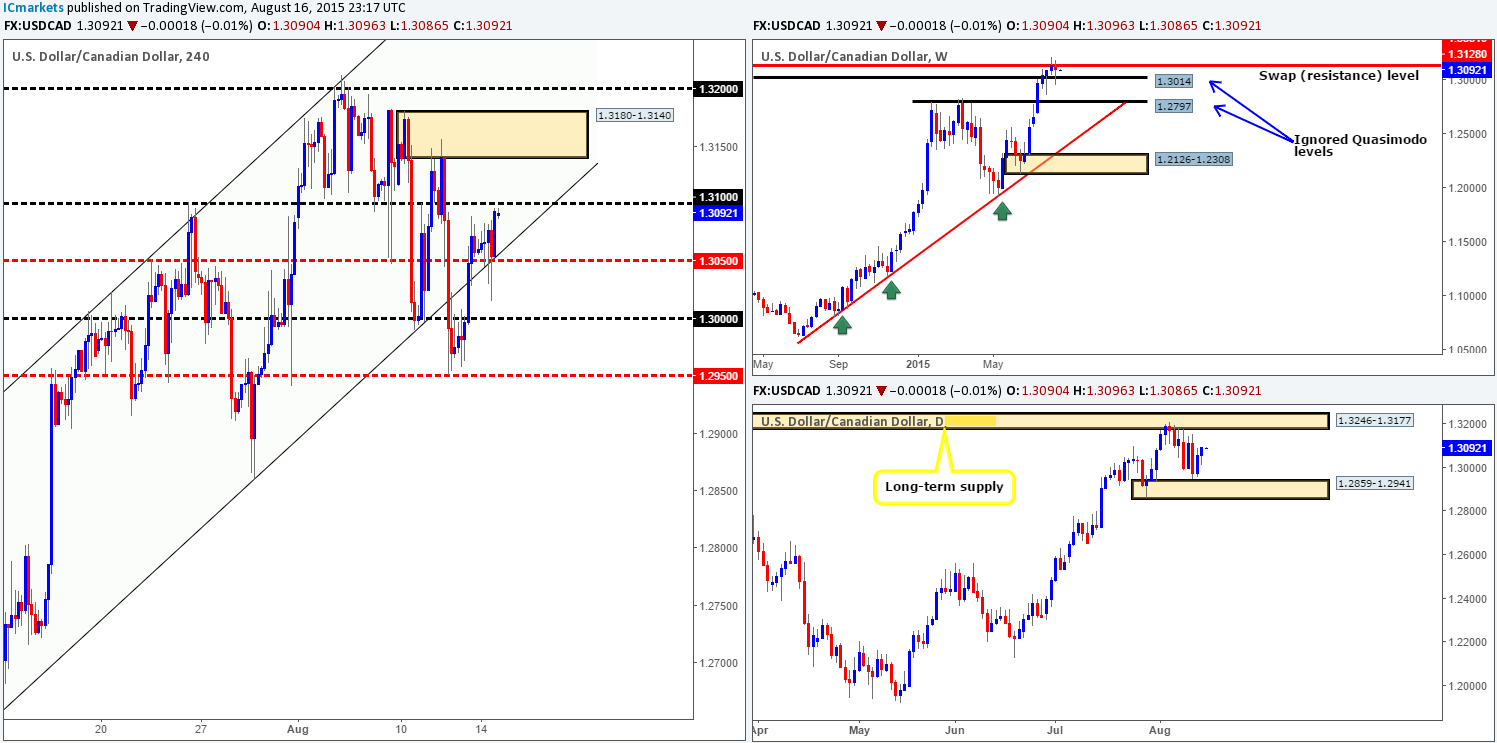
Levels to watch/ live orders:
- Buys: Flat (Stop loss: N/A).
- Sells:Flat (Stop loss: N/A).
USD/CHF:
Weekly recap:
Last week’s action shows that price just missed connecting with the weekly Harmonic Bearish completion zone at 1.0015-0.9926 by a mere 25 pips before selling off.This recent descent shredded close to eighty pips off this pair’s value, and closed the week out at 0.9755 –just below a weekly swap (resistance) level at 0.9796. Moving down to the daily timeframe, we can see that price found a strong ceiling of offers at 0.9893. This forced the USD/CHF down into the mouth of 0.9712, which, as you can see, heldinto the close.
Turning our attention to Friday’s sessions on the 4hr timeframe, price sold off from the 4hr swap (supply) zone at 0.9766-0.9785 going into the London open. This drove the market southpushing down to Thursday’s low 0.9728, which was clearly enough to counter-attack prices back up to origin to end the week.
Going forward, this morning’s trade opened a pip above Friday’s close at 0.9756.Given that price remains trading just below the aforementioned 4hr swap (supply) zone, where do we see this market heading today/this week?
Well, looking to short the current 4hr swap (supply) zone is not really an area we’d stamp high probability. The reason being is simply because the 0.9800 round number is lurking just above which has ‘fakeout’ written all over it, and the fact price has just bounced off of a daily swap (support) level at 0.9712. To that end, we would likely consider shorting 0.9800 today for a small intraday bounce south if the lower timeframe price action is also agreeable. Supposing that 0.9800 gave way this week, however, things would then get very interesting as a break above this number possibly clears the path north up to 4hr supply at 0.9903-0.9871. To trade this potential 70-100 pip move, we’d require a retest of 0.9800 as support along with corresponding lower timeframe confirmation.
However, let’s not forget about the weekly timeframe action. Price is currently holding below a weekly swap (resistance) level (see above), which shows room for further selling down to a weekly swap (support) base at 0.9512 this week. In spite of this though, the 4hr timeframe shows very little room to sell until price takes out 4hr demand at 0.9668-0.9696. A sustained move below this barrier would, as far as we can see, open up the gates for prices to challenge either 0.9600 or the 4hr demand area at 0.9547-0.9582.
So just to recap, we’d look to sell 0.9800 if we have lower timeframe confirming price action. We’d also look to buy if price broke above and retested (with confirmation) 0.9800. Further, our team would also look to sell any retest once/if price breaks below 4hr demand at 0.9668-0.9696.
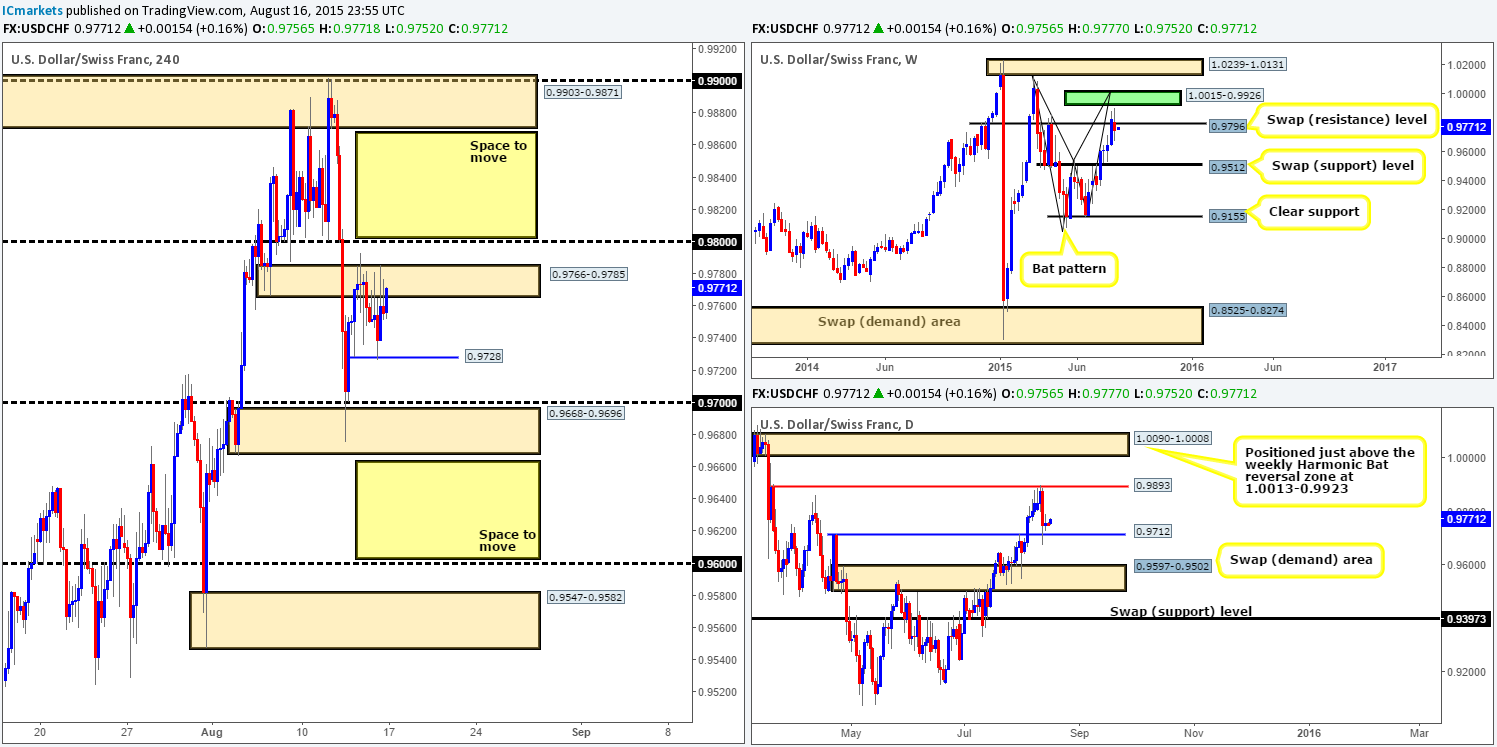
Levels to watch/ live orders:
- Buys: Watch for 0.9800 to be consumed and then look to enter on a retest of this number (confirmation required).
- Sells: 0.9800 [Tentative – confirmation required] (Stop loss: dependent on where one confirms this level) Watch for 0.9668-0.9696 to be consumed and then look to enter on a retest at this area (confirmation required).
DOW 30:
Weekly recap:
Following the break below the weekly range low 17547 and its converging weekly ascending channel support taken from the low 10402, further selling was seen last week. Price action smashed into and respected a weekly swap (support) level at 17135. The rebound seen from this barrier, nonetheless, managed to push the DOW back up to the weekly range low/ascending channel support (now acting resistance) which, as you can see,saw a slight rebound lower into the close 17486. Alongside this, the daily timeframe shows that bids spent the majority of the week holding the fort at the top-side of daily demand coming in at 17033-17355.
The latest report coming in from the 4hr scale, reveals an aggressive round of bids came into the market from a 4hr swap (support) level at 17373 during the London/U.S.overlapping session. As a result, the week ended with price closing above a 4hr swap (resistance) level at 17447.
This week’s trade began at Friday’s opening price – 17486. As you can see from the 4hr chart, price action is now resistance free up until at least the 4hr Quasimodo resistance level at 17566. This – coupled with price trading around the aforementioned daily demand at the moment gives way to a possible long trade today/this week if a confirmed retest of 17447 is seen (as per the black arrows).For all that, traders will still need to be careful buying here thanks to price currently kissing the underside of the weekly range low/ascending channel resistance (see above), hence the need for confirmation.

Levels to watch/ live orders:
- Buys: 17447 [Tentative – confirmation required] (Stop loss: dependent on where one confirms this level).
- Sells: Flat (Stop loss: N/A).
XAU/USD: (Gold)
Weekly recap:
The Gold market finally gained consciousness last week. Following two relatively minor buying tails, price rallied a cool 1950 pips, or $19.50 into the close 1114.9. This was the first batch of gains since all the way back to the 22nd June! This recent movement, as you can see, saw price come so very close to crossing swords with a weekly resistance (swap) level at 1130.1.
Friday’s sessions on the 4hr timeframe reveals that price ended up respecting the 4hr swap (support) level at 1112.7 on two occasions, unfortunately however, will little follow-through buying seen.
Moving forward, we can see that this morning’s trade opened at Friday’s closing price – 1114.9. And as such, much of the following analysis will be similar to Fridays.
All in all, we still believe that Gold wants to tag in offers sitting around the 4hr supply zone at 1134.5-1128.9 before continuing to trend south this week. The reason simply comes from it being positioned around a key weekly swap (resistance) level coming in at 1130.1. Therefore, here is our two pips’ worth on where Gold may head to and from over the next couple of days…
Price will likely either use the current minor 4hr swap (support) base at 1112.7 as a platform to rebound prices, or fakeout lo below this number to connect up with bids sitting around the 4hr demand zone at 1101.7-1109.0 (as per the black arrows). Targets for any longs taken from either barrier will ultimately be the 4hr supply zone at 1134.5-1128.9. The high formed during Thursday’s trade (1126.6) will likely serve nicely as a fakeout line into our target zone – imagine the buy stops positioned above this high – great liquidity to sell into!
Of course, it is trader dependent on how one approaches these potential 4hr buy levels today/this week. We are choosing to play on the side of caution, however, and wait for a lower timeframe buying signal before considering a trade, as either of the above said hurdles could potentially see a reaction.
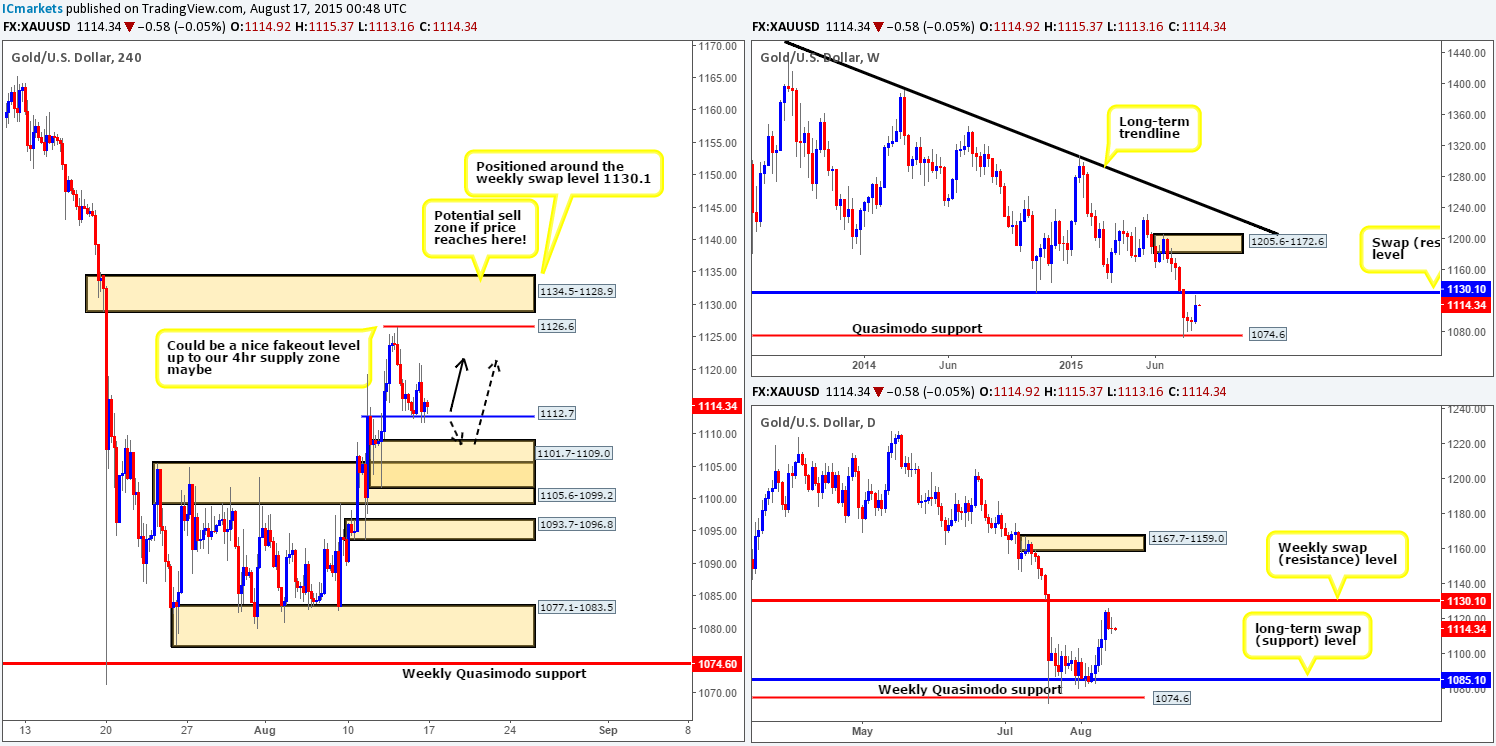
Levels to watch/ live orders:
- Buys: 1112.7 [Tentative – confirmation required] (Stop loss: dependent on where one confirms this level) 1101.7-1109.0 [Tentative – confirmation required] (Stop loss: 1100.8).
- Sells: 1134.5-1128.9 [Tentative – confirmation required] (Stop loss: dependent on where one finds confirmation in this area).


