Waiting for lower timeframe confirmation is our main tool to confirm strength within higher timeframe zones, and has really been the key to our trading success. It takes a little time to understand the subtle nuances, however, as each trade is never the same, but once you master the rhythm so to speak, you will be saved from countless unnecessary losing trades. The following is a list of what we look for:
- A break/retest of supply or demand dependent on which way you’re trading.
- A trendline break/retest.
- Buying/selling tails/wicks – essentially we look for a cluster of very obvious spikes off of lower timeframe support and resistance levels within the higher timeframe zone.
We typically search for lower-timeframe confirmation between the M15 and H1 timeframes, since most of our higher-timeframe areas begin with the H4. Stops are usually placed 1-3 pips beyond confirming structures.
EUR/USD:
Weekly gain/loss: + 84 pips
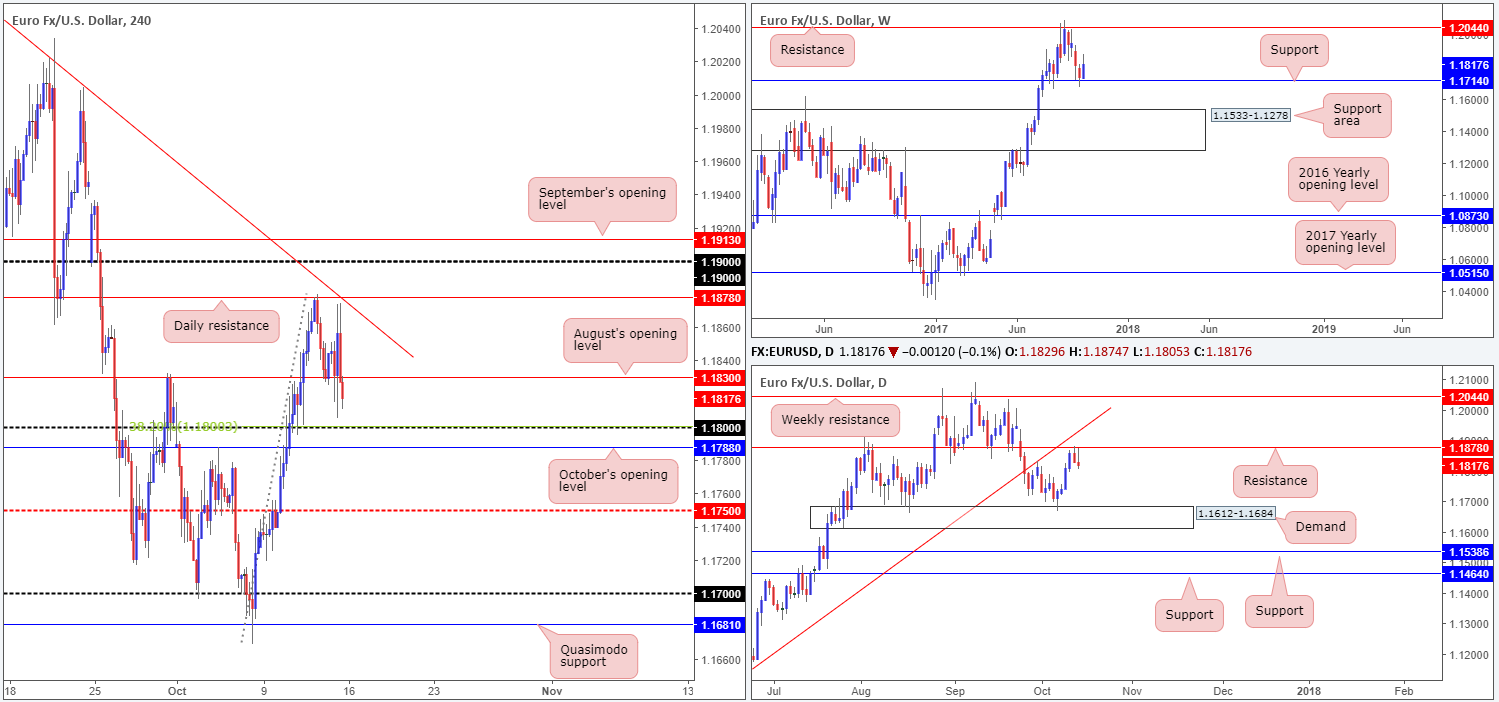
Weekly closing price: 1.1817
Over the last week, the single currency switched tracks and shifted northbound from weekly support penciled in at 1.1714. As you can see, weekly action engulfed recent losses and tapped a high of 1.1880, before printing a small end-of-week correction.
On the other side of the field, however, daily price shook hands with resistance at 1.1878 on Thursday and printed two back-to-back bearish candles. As long as the sellers remain in control, the pair could revisit demand pegged at 1.1612-1.1684 sometime this week.
The after-effects of Friday’s lower-than-expected US data sparked an immediate rally. As can be seen from the H4 timeframe though, price was unable to maintain these gains and topped a few pips ahead of daily resistance mentioned above at 1.1878 (converges with a H4 trendline resistance extended from the high 1.2092). A speedy reversal ensued; reclaiming fresh gains and forcing price to end the day sub August’s opening level at 1.1830.
Suggestions: The 1.18 handle provided a strong floor of support on the 10th Oct, enabling the market to push to highs of 1.1880. At present, this psychological band is bolstered by not only a 38.2% H4 Fib support taken from the low 1.1669; it’s also positioned a few pips above October’s opening level at 1.1788. With that in mind, a sell at current price would be somewhat challenging, and that’s not even taking into account that price bounced from weekly support last week (see above)! Unfortunately, a buy is just as awkward given the noted daily resistance in play, and nearby aforesaid H4 resistances.
Data points to consider: US Empire state manufacturing Index at 1.30pm GMT+1.
Levels to watch/live orders:
- Buys: Flat (stop loss: N/A).
- Sells: Flat (stop loss: N/A).
GBP/USD:
Weekly gain/loss: + 214 pips
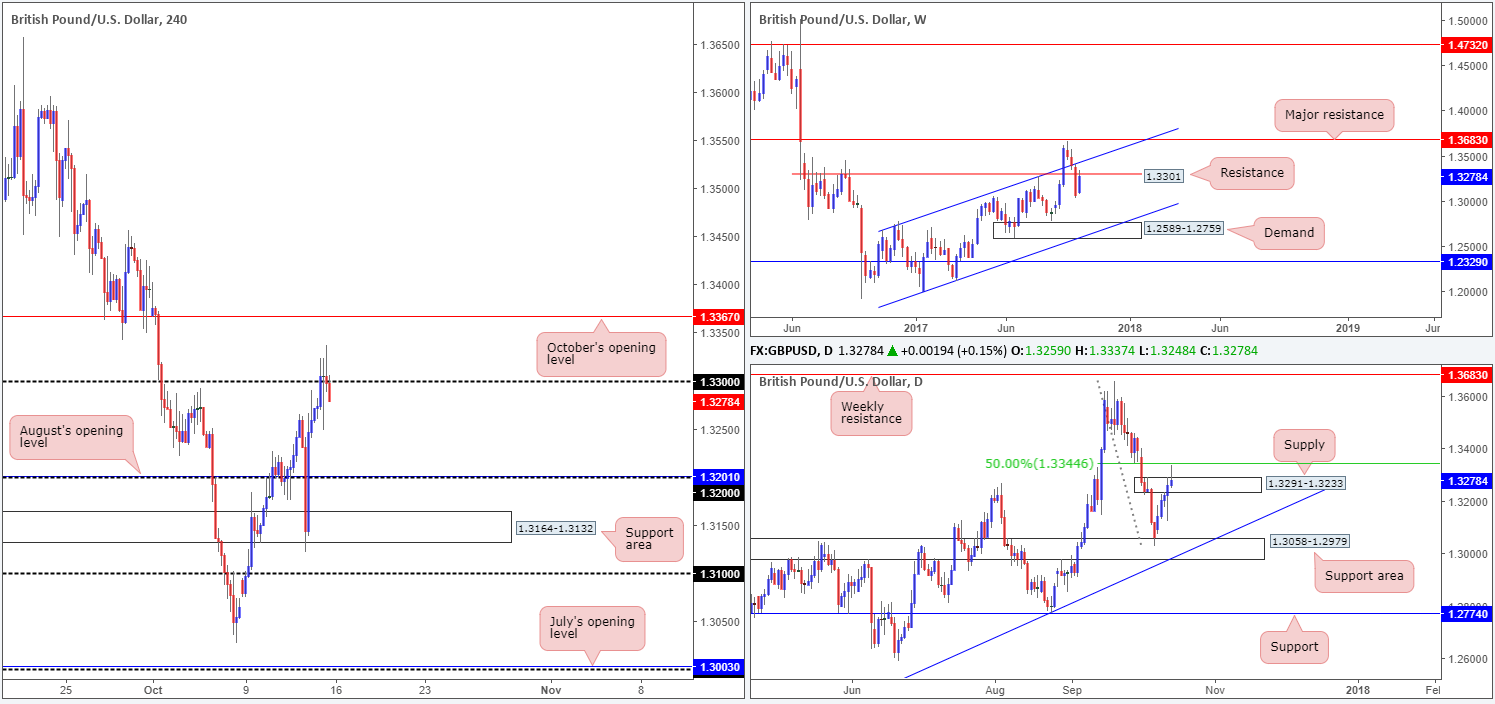
Weekly closing price: 1.3278
During the course of last week’s session, the GBP/USD managed to recoup more than 50% of the prior week’s losses. This transported weekly price back up to the underside of a resistance level planted at 1.3301. A response from this line might force the unit down to channel support extended from the low 1.1986 in the near future.
On the daily timeframe, GBP/USD bulls chalked up five consecutive bullish candles last week. Despite this, Friday’s candle formed a strong-looking bearish selling wick (pin bar) that pierced through the top edge of supply at 1.3291-1.3233, and came within a few pips of plugging into a 50.0% resistance value pegged at 1.3344 taken from the high 1.3655.
The impact of Friday’s slightly lower-than-expected US data saw the British pound dash through offers at the 1.33 handle. As can be seen from the H4 chart (better on the M30), a high of 1.3337 was achieved before the pair began paring gains into the closing bell.
Suggestions: With weekly price still showing potential to the downside and daily price fixed within supply at 1.3291-1.3233, our bias, for the time being, remains bearish. This – coupled with H4 price trading sub1.33 in the shape of a full-bodied bearish candle – could lead to the piece selling off down to the 1.32 handle/August’s opening level at 1.3201 today/this week.
Data points to consider: US Empire state manufacturing Index at 1.30pm GMT+1.
Levels to watch/live orders:
- Buys: Flat (stop loss: N/A).
- Sells: Shorts at current price are valid without the need for further confirmation (stop loss: 1.3340).
AUD/USD:
Weekly gain/loss: + 114 pips
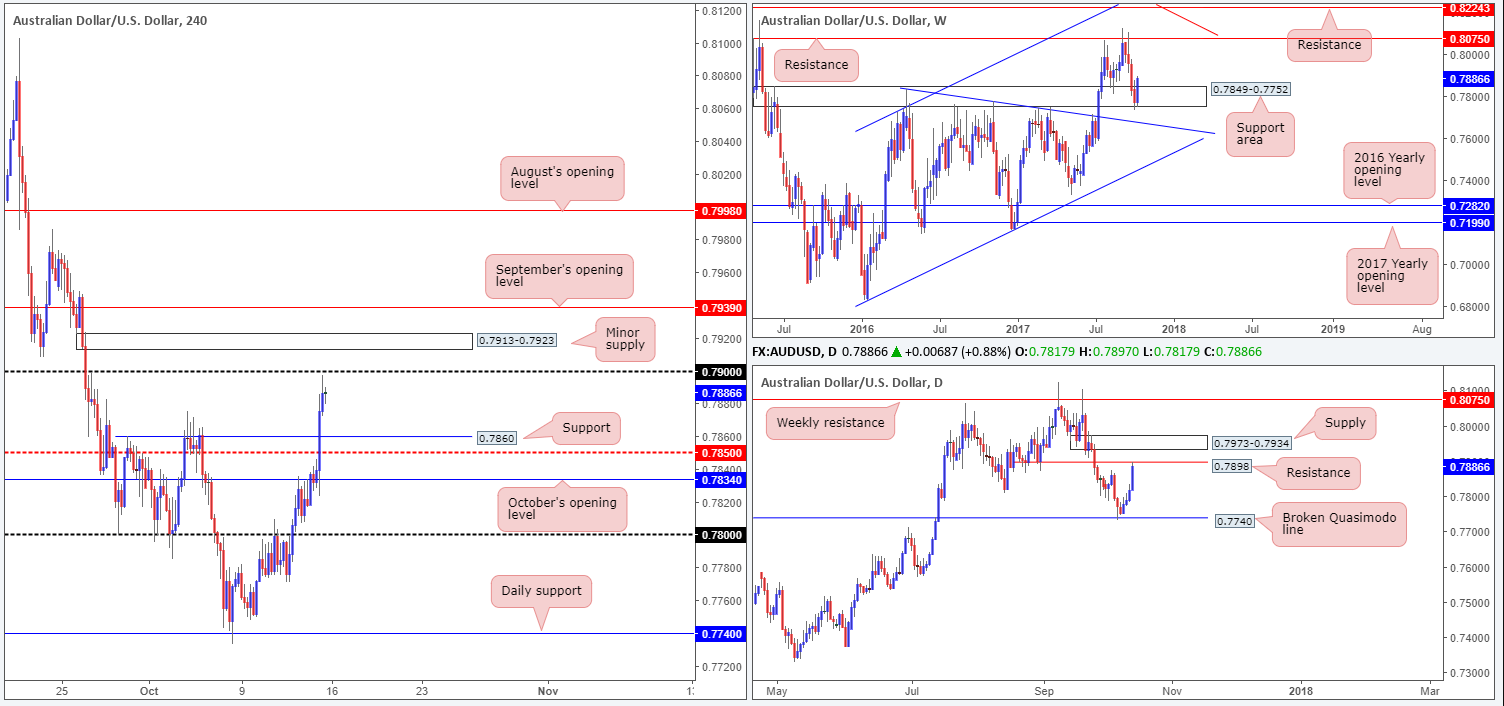
Weekly closing price: 0.7886
A stronger than expected rebound was seen from within the lower limits of a weekly support area at 0.7849-0.7752 last week, consequently submerging recent losses and constructing a near-full-bodied bullish candle. Assuming the bulls continue to hustle, it’s possible that the commodity currency may find itself trading back around weekly resistance coming in at 0.8075 in the near future.
Before weekly bulls can make a stance, however, daily structure could potentially hinder upside action. Friday’s run brought the candles up to resistance located at 0.7898, which, as you can see, is shadowed closely by supply at 0.7973-0.7934. For that reason, buying right now, unless you enjoy trading in drawdown, might not be the best path to take.
A fresh swell of buyers came into the market on Friday, led by slightly disappointing US data. Greenback selling pressure forced H4 price to run through orders at both the mid-level resistance at 0.7850 and local resistance at 0.7860 (now acting support). The session concluded with the major topping just ahead of the 0.79 handle.
Suggestions: In our book, this remains a limited market.
To the upside, we not only have the noted resistances on the daily timeframe to contend with, we also have the 0.79 handle and minor supply just above it at 0.7913-0.7923 on the H4 timeframe. Therefore, to long this market based on where weekly price is trading from would be a minefield!
To the downside, a sell from the 0.79 handle is just as awkward. Not only because a move from here would have you selling into potential weekly flow, but also because a sell would provide only 40 pips to play with down to the H4 support mentioned above at 0.7860.
Not the best of odds on either side this morning!
Data points to consider: Chinese inflation figures at 2.30am. US Empire state manufacturing Index at 1.30pm GMT+1.
Levels to watch/live orders:
- Buys: Flat (stop loss: N/A).
- Sells: Flat (stop loss: N/A).
USD/JPY:
Weekly gain/loss: – 78 pips
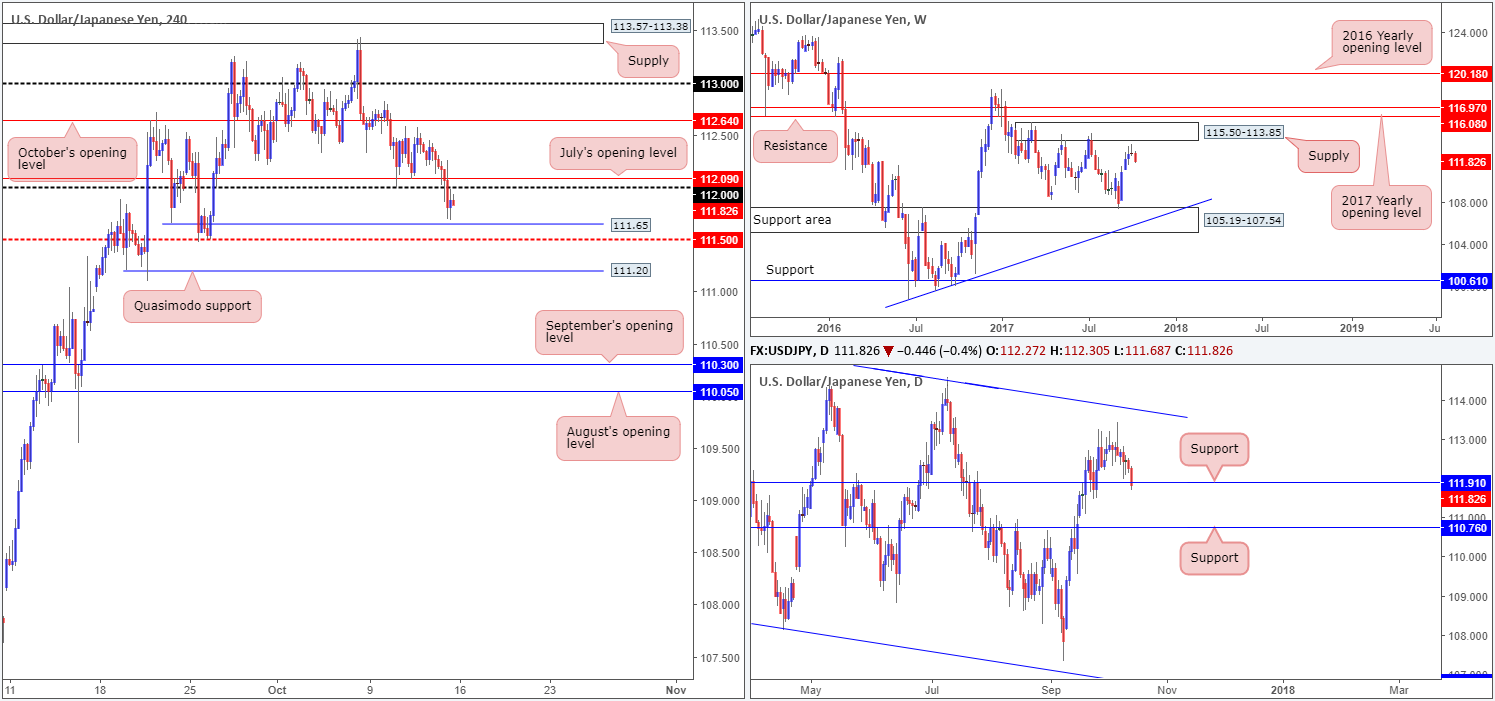
Weekly closing price: 111.82
The weekly candles, as you can see, turned bearish ahead of supply at 115.50-113.85 in recent dealings. This came after two back-to-back weekly selling wicks. Should the bears remain in the driving seat, the next port of call on the weekly scale, in our technical view, does not come into sight until we reach a support area seen at 105.19-107.54.
Turning our attention to the daily timeframe, support at 111.91 suffered a minor breach last week. A sustained move below this barrier would likely place support at 110.76 in the spotlight. From our perspective though, we still feel there are active buyers lurking around the current support.
Friday’s US data came in less than stellar, prompting an aggressive selloff. The H4 candles crashed through both July’s opening level at 112.09 and the 112 handle, ending the day clocking lows of 111.68. With price now seen housed between 112.09/112 and a nearby Quasimodo support at 111.65/mid-level support at 111.50, movement is somewhat restricted at the moment.
Suggestions: Right now, we do not have much to hang our hat on. Given the conflict of opinion seen between the weekly and daily timeframes, as well as H4 price appearing rather overcrowded, opting to stand on the sidelines may be the better bet.
Data points to consider: US Empire state manufacturing Index at 1.30pm GMT+1.
Levels to watch/live orders:
- Buys: Flat (stop loss: N/A).
- Sells: Flat (stop loss: N/A).
USD/CAD:
Weekly gain/loss: – 60 pips
Weekly closing price: 1.2469
Shattering a strong four-week bullish phase, last week’s action saw USD/CAD bears make an entrance from the underside of a weekly trendline resistance extended from the low 0.9633. Depending on how far the bears take this, the next downside target on the weekly scale does not come onto the scene until demand at 1.1919-1.2074.
The story on the daily timeframe shows that the candles remain fixed at supply drawn from 1.2663-1.2511. Also noteworthy here is Friday’s strong-looking bearish selling wick that tapped the underside of the said supply.
The pair’s sharp fall witnessed after softer-than-expected US data on Friday failed to print much follow-through action. As a result, H4 price is presently wedged between Sept/Oct’s opening levels at 1.2485/81 and a demand base coming in at 1.2416-1.2437. This, like the EU, AU and UJ, shows little room for price to stretch its legs at the moment.
Suggestions: Similar to Friday’s report, the only point of interest in this market right now is a H4 close below 1.24. A decisive push below this number, combined with a retest and a lower-timeframe sell signal (see the top of this report for information on how to use the lower timeframes as a means of entry) would, in our book, be enough evidence to sell down to the H4 mid-level support penciled in at 1.2350 as an initial take-profit target.
Data points to consider: US Empire state manufacturing Index at 1.30pm GMT+1.

Levels to watch/live orders:
- Buys: Flat (stop loss: N/A).
- Sells: Watch for H4 price to engulf 1.24 and then look to trade any retest seen thereafter ([waiting for a lower-timeframe sell signal to form following the retest is advised] stop loss: dependent on where one confirms the number).
USD/CHF:
Weekly gain/loss: – 30 pips
Weekly closing price: 0.9743
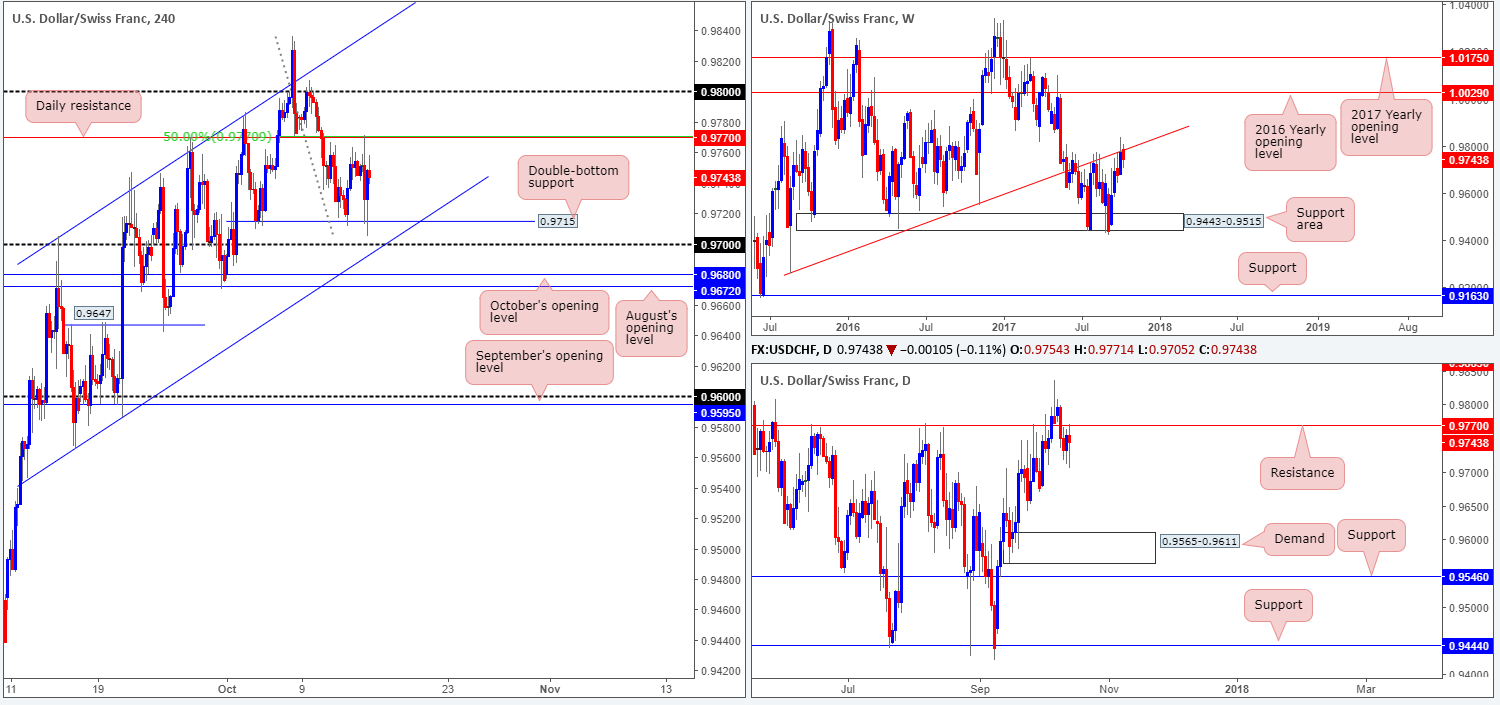
Assessing the weekly timeframe’s position this morning, we can see that the bears are beginning to make a stance around the underside of a trendline resistance etched from the low 0.9257. A determined push lower from this angle would place the support area seen at 0.9443-0.9515 in the firing range.
Bouncing down to the daily candles, the pair spent the bulk of last week petting the underbelly of resistance positioned at 0.9770. A move lower from this line would likely see price approach a demand zone seen located just above the noted weekly support area at 0.9565-0.9611.
A quick recap of Friday’s action on the H4 timeframe shows the Swissie fell sharply moments after US inflation and retail sales figures were aired. However, the disappointing readings failed to breach double-bottom support at 0.9715, which saw price recover most of the lost ground relatively quickly.
Suggestions: The current daily resistance – coupled with the H4 50.0% resistance at 0.9774 taken from the high 0.9836 – will likely entice sellers into the market, as it did on Friday. To take advantage of this possible fade, we would strongly advise waiting for additional H4 confirmation in the form of a full or near-full-bodied bearish candle. This will help confirm if active sellers remain here.
Data points to consider: US Empire state manufacturing Index at 1.30pm GMT+1.
Levels to watch/live orders:
- Buys: Flat (stop loss: N/A).
- Sells: 0.9770 region ([waiting for a reasonably sized H4 bearish candle to form – preferably a full, or near-full-bodied candle – is advised] stop loss: ideally beyond the candle’s wick).
DOW 30:
Weekly gain/loss: + 138 points
Weekly closing price: 22880
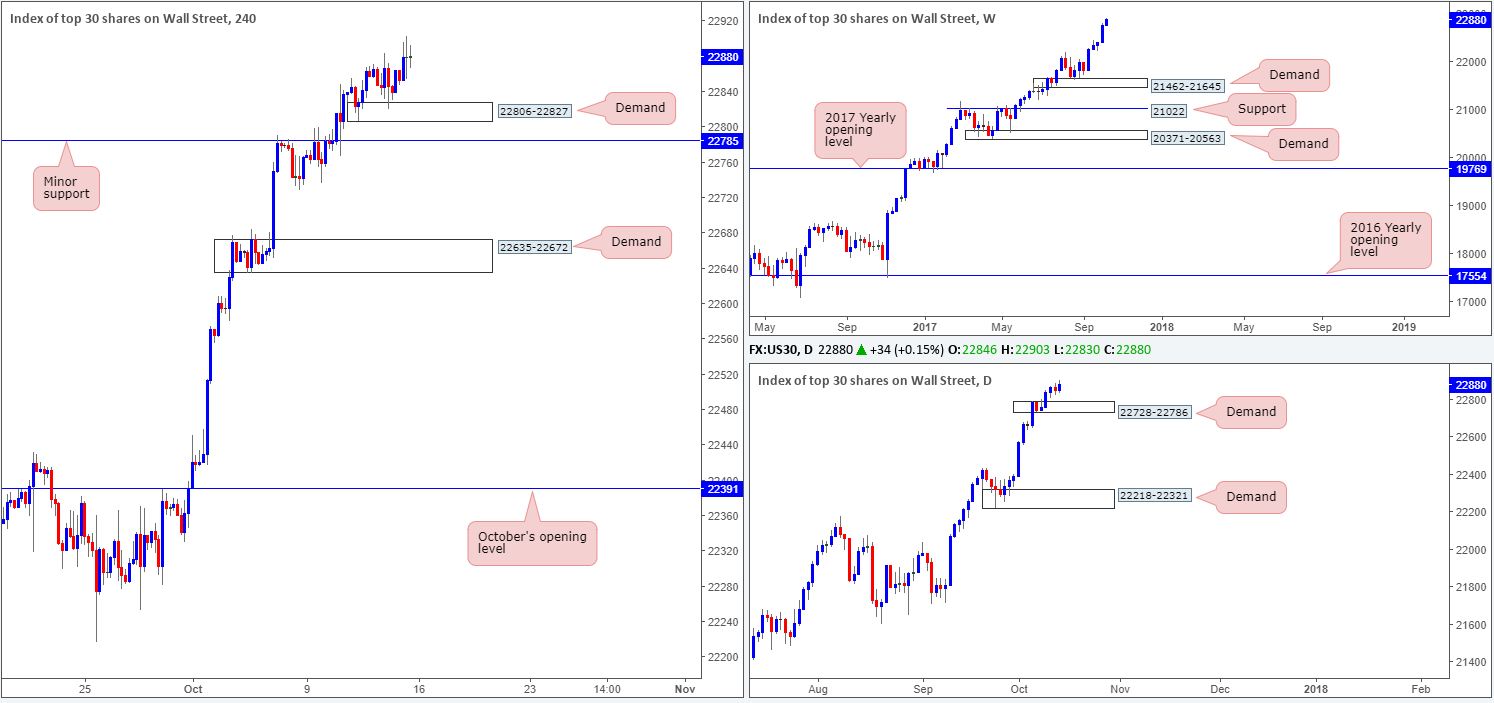
US stocks extended higher for a fifth consecutive session last week, pulling the index up to fresh record highs of 22903. In recent trading, we also saw that daily candles constructed a demand base coming in at 22728-22786.
To keep things simple, the following is our ideal buying scenario:
H4 demand at 22806-22827, as you can see, was respected during last week’s trading. Buy orders have, therefore, likely been filled. A pullback today/this week could see price dip back down to this zone. Buyers will, as they saw price hold last week, feel it is a worthy barrier for longs. However, given that just below sits a minor H4 support at 22785 which essentially denotes the top edge of the aforementioned daily demand, a fakeout through the current H4 demand is a strong possibility.
Suggestions: Watch for H4 price to drive through the aforesaid H4 demand (taking out stops) and tap support at 22785. Should the bulls respond from this angle and print a reasonably sized bullish candle, this is a high-probability long trade.
Data points to consider: US Empire state manufacturing Index at 1.30pm GMT+1.
Levels to watch/live orders:
- Buys: 22785 region ([waiting for a reasonably sized H4 bullish candle to form – preferably a full, or near-full-bodied candle – is advised] stop loss: ideally beyond the candle’s tail).
- Sells: Flat (stop loss: N/A).
GOLD:
Weekly gain/loss: + $28.2
Weekly closing price: 1304.4
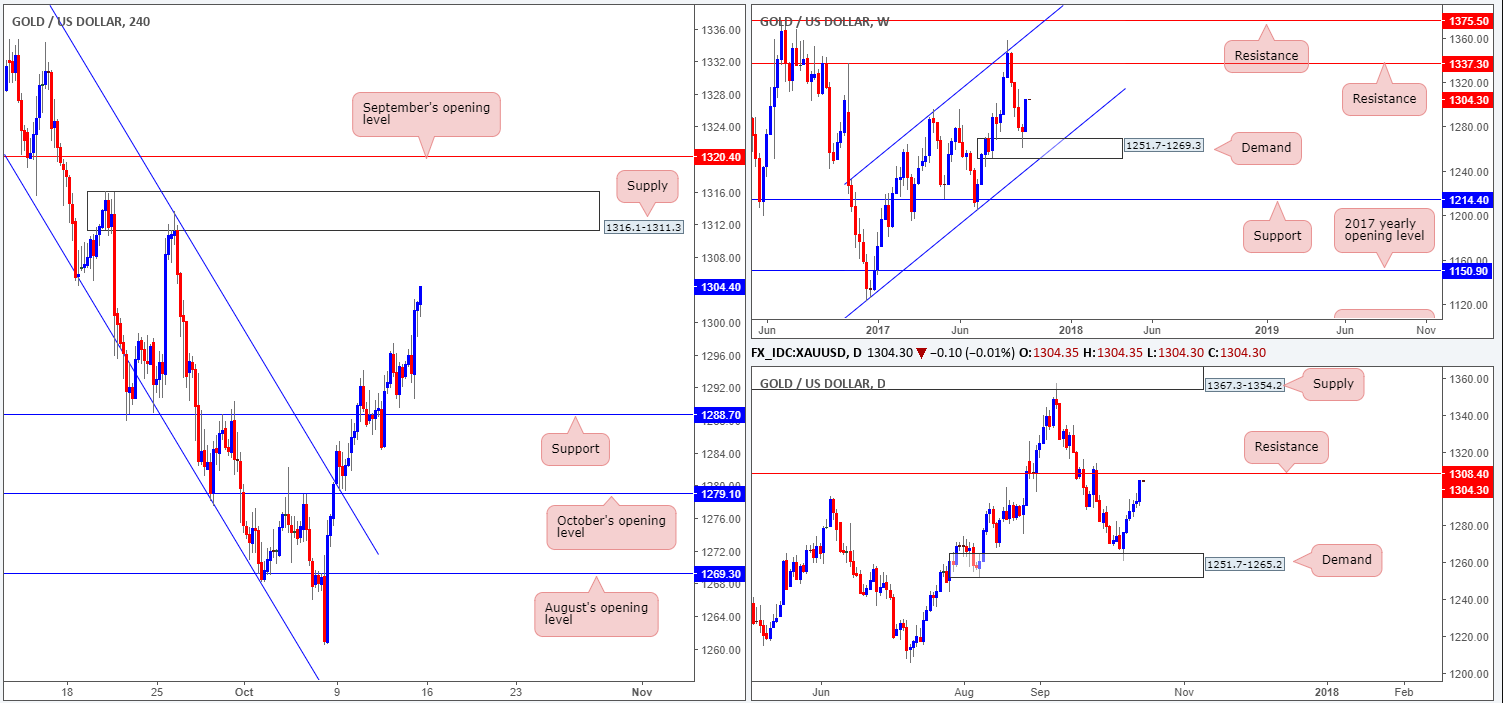
Recent action shows that the yellow metal extended its bounce from weekly demand at 1251.7-1269.3, consequently forming a full-bodied bullish candle in the process. Price could, according to the weekly timeframe, continue punching its way higher this week considering there’s little upside resistance in the frame until 1337.3.
Daily price on the other hand, is seen lurking just ahead of resistance pegged at 1308.4. This level boasts a reasonably strong amount of history that stretches as far back as early 2011, so expecting price to just run through this level based on weekly expectations is bold, in our humble view.
Friday’s disappointing US data was felt in the gold market, with price aggressively pressing north. After a brief pause, H4 price continued to press to highs of 1304.4, placing the metal within striking distance of a supply zone coming in at 1316.1-1311.3 going into the close.
Suggestions: Further upside is likely to be seen today/early this week, at least until we shake hands with daily resistance at 1308.4. As for trading this move, we do not see much to hang our hat on right now. From a seller’s perspective, however, a fakeout above the current daily resistance up to the noted H4 supply will likely generate some downside that might be a worthy trade. The reason we say ‘might’ is simply due to the space seen on the weekly chart for the bulls to gravitate higher. Therefore, trade cautiously here, guys!
Levels to watch/live orders:
- Buys: Flat (stop loss: N/A).
- Sells: Flat (stop loss: N/A).


