A note on lower timeframe confirming price action…
Waiting for lower timeframe confirmation is our main tool to confirm strength within higher timeframe zones, and has really been the key to our trading success. It takes a little time to understand the subtle nuances, however, as each trade is never the same, but once you master the rhythm so to speak, you will be saved from countless unnecessary losing trades. The following is a list of what we look for:
- A break/retest of supply or demand dependent on which way you’re trading.
- A trendline break/retest.
- Buying/selling tails/wicks – essentially we look for a cluster of very obvious spikes off of lower timeframe support and resistance levels within the higher timeframe zone.
- Candlestick patterns. We tend to only stick with pin bars and engulfing bars as these have proven to be the most effective.
We search for lower timeframe confirmation between the M15 the H1 timeframes, since most of our higher-timeframe areas begin with the H4. Stops area usually placed 5-10 pips beyond our confirming structures.
EUR/USD:
Weekly Gain/Loss: – 95 pips
Weekly closing price: 1.1303
Weekly opening price: 1.1308
Weekly view: Following the bearish pin bar formed within supply at 1.1533-1.1278 two weeks back, the single currency, as expected, tumbled lower last week. Due to this zone managing to cap the single currency since May 2015 (see red arrows) we still feel lower prices are on the cards this week, as the next logical target from here falls in around support at 1.0796.
Daily view: Before looking to short, nevertheless, traders may want to take into consideration that the daily picture, thanks to Friday’s round of selling (favorable U.S. retail sales and consumer confidence data), shows this unit currently heading towards demand coming in at 1.1215-1.1264. On top of that, there are also two neighboring demands lurking below at 1.1143-1.1179/1.1057-1.1108. In our view, these are barriers with the potential to bounce price but considering where weekly action is positioned (see above), a reversal from either demand is doubtful.
H4 view: Friday’s bearish descent, as you can be seen from the H4 chart, consumed support drawn from 1.1337 and bottomed out around the 1.1294 mark going into the American open, ending the day closing back above the 1.13 handle. Given the points made above and taking into account that this morning’s open was stable, here is our two pips’ worth on where this pair may head today and possibly into the week.
In light of the weekly picture indicating further selling could be seen, a short trade from the mid-way resistance 1.1350 could be something to contemplate. This line also offers 38.2% Fibonacci resistance at 1.1345 as well as resistance painted at 1.1337 (green circle). On the assumption that we short from here, partial profits would be cashed in around the 1.13 region, with the remainder likely liquidated around demand carved from 1.1256-1.1265. Assuming price does come into contact with this demand, a bounce higher from here is expected due to it sitting on top of daily demand chalked in at 1.1215-1.1264, which is the next downside target on the daily timeframe. Therefore, intraday longs from this barrier might be a trade to consider this week.
Of course is it down to the individual trader if he/she chooses to simply place a pending order at these zones or wait for lower timeframe confirmation. We favor the latter and will not be opening a position until a suitable lower timeframe setup forms (for confirmation techniques, please see the top of this report).
Levels to watch/live orders:
- Buys: 1.1256-1.1265 [Tentative – confirmation required] (Stop loss: dependent on where one confirms this area).
- Sells: 1.1350/1.1337 [Tentative – confirmation required] (Stop loss: dependent on where one confirms this area).
GBP/USD:
Weekly Gain/Loss: – 73 pips
Weekly closing price: 1.4350
Weekly opening price: 1.4346
Weekly view: Recent action shows that Cable extended its bounce from the broken Quasimodo resistance line at 1.4633 down to lows of 1.4340 last week. In the event that the bears remain dominant this week, further selling could be possible down to 1.4051 – a broken Quasimodo support level.
Daily view: From this angle, we can see that the pound spent the majority of last week between the top-side of demand at 1.4297-1.4393 and overhead resistance drawn from 1.4470. It was only until Friday did we see the pair take on a more bearish stance and drive deeper into the aforementioned demand, which came about due to better than expected U.S. data. In that daily price was unable to breach resistance last week and considering the position of weekly price (see above), bids within the current demand are very likely on shaky ground.
H4 view: Looking at Friday’s movement on the H4, the 1.44 handle was taken out mid-ways through the London session with price shortly after slam dunking itself into demand logged in at 1.4318-1.4349. As you can probably see, this is a relatively fresh demand that is located deep within the aforementioned daily demand. However, seeing that the weekly picture shows potential to continue on its downward path (see above) and there also being a round number (1.43) lurking just below this H4 demand (possible fakeout), buying right now is a risky play in our book. Therefore, our team has come to a general consensus that no longs will be taken from the current H4 demand zone.
Should our analysis be correct and this unit does indeed continue lower, we’ll not be looking for shorts until the H4 demand at 1.4268-1.4290 (sits just below the current daily demand) is consumed. This is a relatively important demand since it was formed on the break of a Quasimodo resistance line at 1.4286. A close below this barrier likely opens the gates for a downside move towards the 1.42 figure, followed closely by H4 demand at 1.4131-1.4170 (sits within daily demand at 1.4090-1.4195 which is the next downside target beyond the current daily demand).
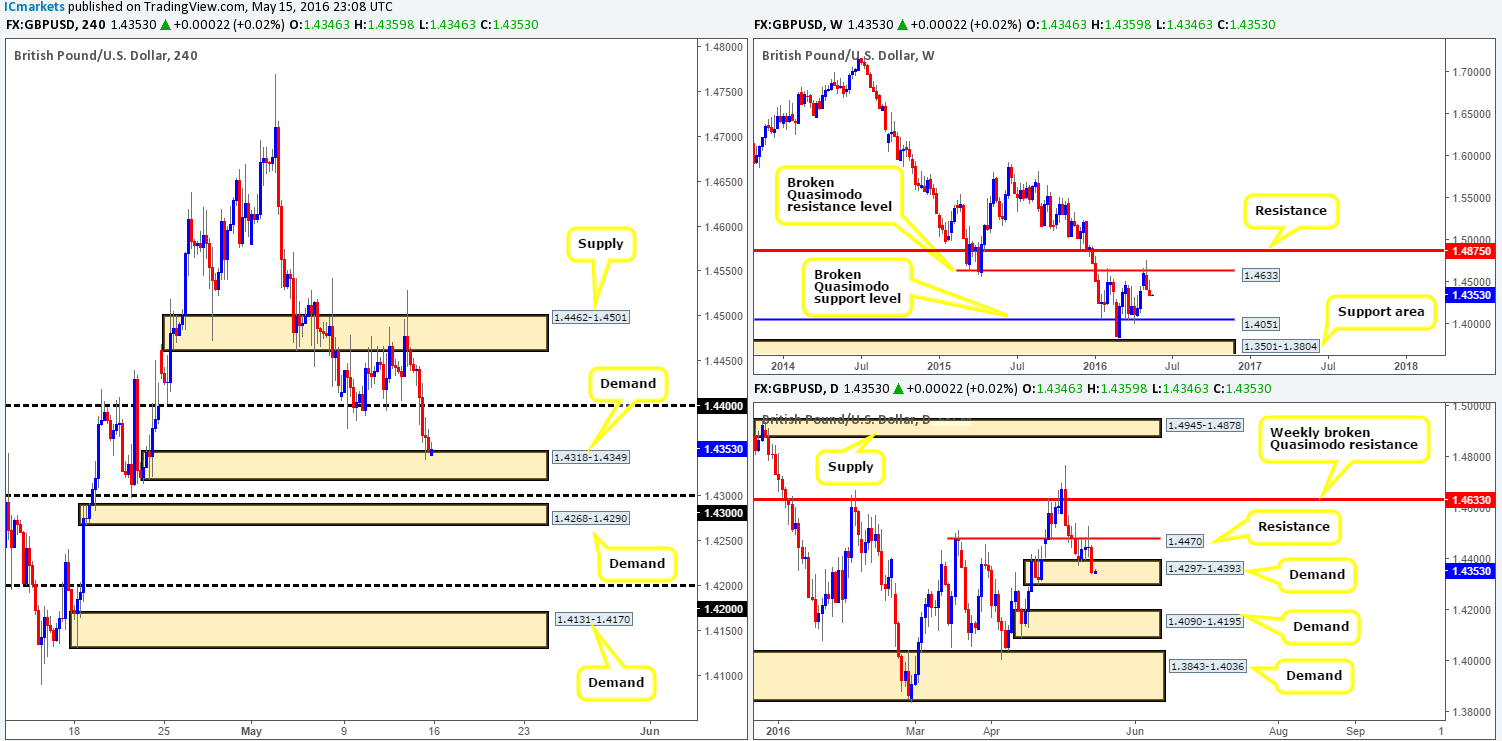
Levels to watch/live orders:
- Buys: Flat (Stop loss: N/A).
- Sells: Watch for price to close below 1.4268-1.4290 and look to trade any retest seen thereafter (lower timeframe confirmation required).
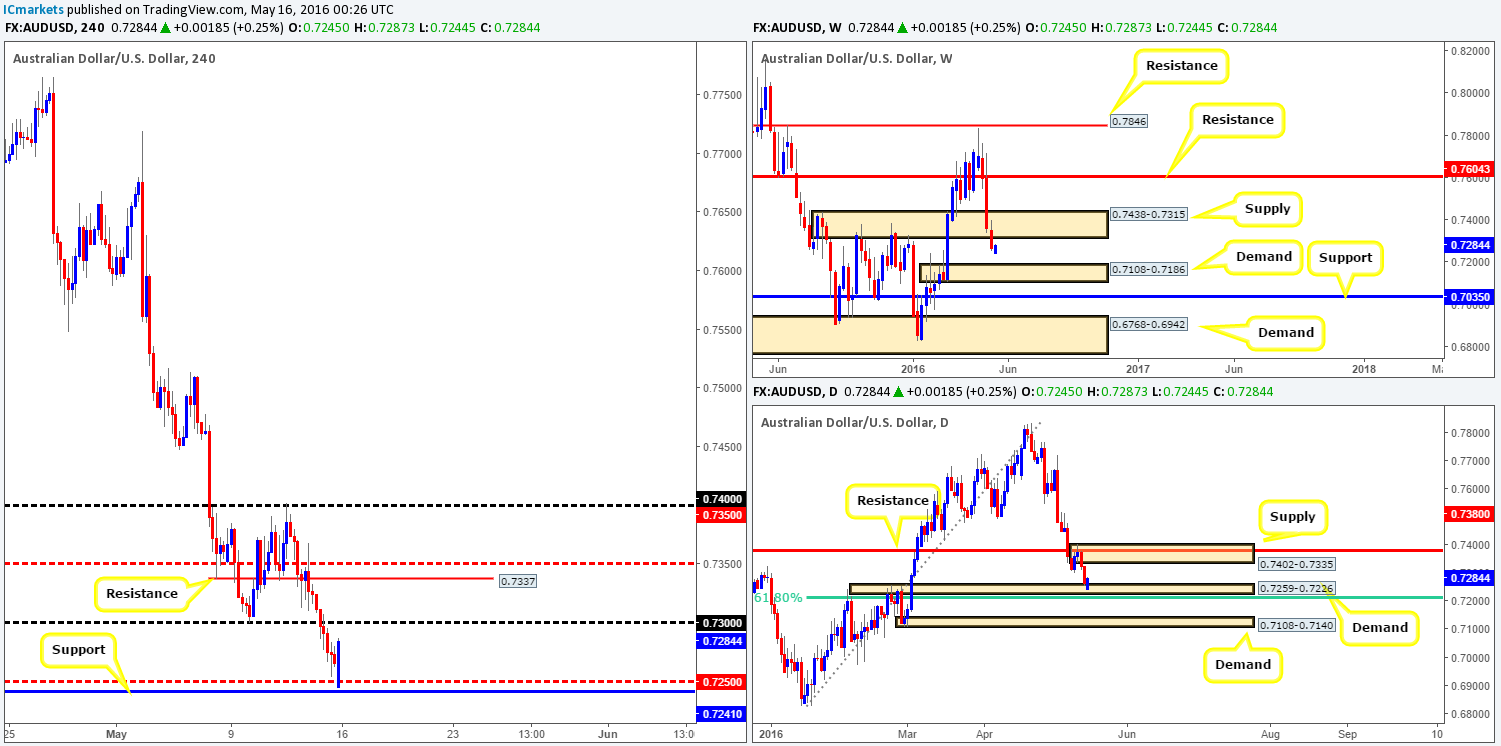
AUD/USD:
Weekly Gain/Loss: – 96 pips
Weekly closing price: 0.7265
Weekly opening price: 0.7245
Weekly view: Since the commodity current peaked at 0.7835, price has fallen sharply for the past three weeks. This, as can be seen from the chart, saw the Aussie take out demand painted at 0.7438-0.7315 which may lead to further selling this week down to demand coming in at 0.7108-0.7186. Nevertheless, before this is seen, traders need to be prepared for the possibility that this market may want to retest the underside of the recently broken demand (now supply) before pushing lower.
Daily view: Thanks to Thursday and Friday’s selling, daily action is now trading from a small demand penciled in at 0.7259-0.7226 that is bolstered by a 61.8% Fibonacci support at 0.7211. At the time of writing, bids are holding this pair nicely, which may attract further bids into this market up to supply seen at 0.7402-0.7335 (encapsulates a resistance drawn from 0.7380 and sits within the above said weekly supply).
H4 view: After Friday’s grind south, the H4 shows that the AUD gapped a further twenty pips lower this morning, consequently tagging in bids around the mid-way support 0.7250 and just missing support at 0.7241. In addition to this support, however, over on the AUD/SGD H4 chart (a pair that has a high correlation with the AUD/USD) price is also currently trading from support at 93.265. Furthermore, the US DOW H4 chart, also another market with a relatively high correlation, is trading from a downward channel support line (17789) and support seen at 17482.This correlation confluence, coupled with daily action (see above) puts this market in good stead for a rally north to test daily supply at 0.7402-0.7335. Once/if price reaches this zone, nonetheless, looking for shorts will, due to this daily zone housed within weekly supply (explained above), be the more favored approach.
On account of the above information, our current plan of attack will be to watch for a possible long entry from around the present H4 support. Should we manage to pin down a lower timeframe setup, the 0.73 handle will be our first port of call for profit taking, followed by the resistance line at 0.7337/mid-way resistance 0.7350 (essentially marks the underside of the current daily supply – a sell zone).
Levels to watch/live orders:
- Buys: 0.7250 region [Tentative – confirmation required] (Stop loss: dependent on where one confirms this area).
- Sells: 0.7350/0.7337 is an area we’ll be watching closely for shorting opportunities (lower timeframe confirmation required).
For confirmation techniques please see the top of this report.
USD/JPY:
Weekly Gain/Loss: + 150 pips
Weekly closing price: 108.60
Weekly opening price: 108.59
Weekly view: The past week saw the USD/JPY extend its bounce from demand at 105.19-107.54, clocking highs of 109.55 by the close. On the condition that the bulls continue to provide a floor to this market it is likely that this unit will connect with supply penciled in at 113.80-111.59 sometime soon.
Daily view: From the daily chart, however, we can see that price remains sandwiched between supply at 109.26-109.83 and demand at 107.60-108.35. Given the structure seen on the weekly chart, we feel a breakout north is the more likely route. Nevertheless, it is still difficult to judge since price could drive below the current demand and connect with demand seen at 105.19-106.31 (sits deep within the current weekly demand) before rallying higher. It will be interesting to see what the H4 chart makes of this…
H4 view: Very similar to the daily chart, the H4 also remains confined between demand at 108.27-108.44 and supply coming in at 109.26-109.49. With all three timeframes in mind, there is not much to hang our hat on right now! If we look to buy on the basis of price rallying from weekly demand, there’s the 109 handle, the aforementioned supply base and the 110.00 handle to contend with which could repel prices!
To that end (as we mentioned in Friday’s report), what we’re watching for is a close above the 110 handle. This would, as far as we see it, achieve the following:
- Open the H4 path north up to H4 resistance at 110.84.
- Push price above the current daily supply at 109.26-109.83 and potentially clear the runway up to daily resistance at 110.96 – a few pips above the H4 line 110.84.
In addition to these two points it would also allow traders the chance to enter long on any retest seen at 110 as per the green arrows. For us to be given the green light to buy, nonetheless, we would require a lower timeframe buy setup to form following the retest of 110. This could be in the form of an engulf of supply, a trendline break/retest or even simply a collection of buying tails around the 110 number.
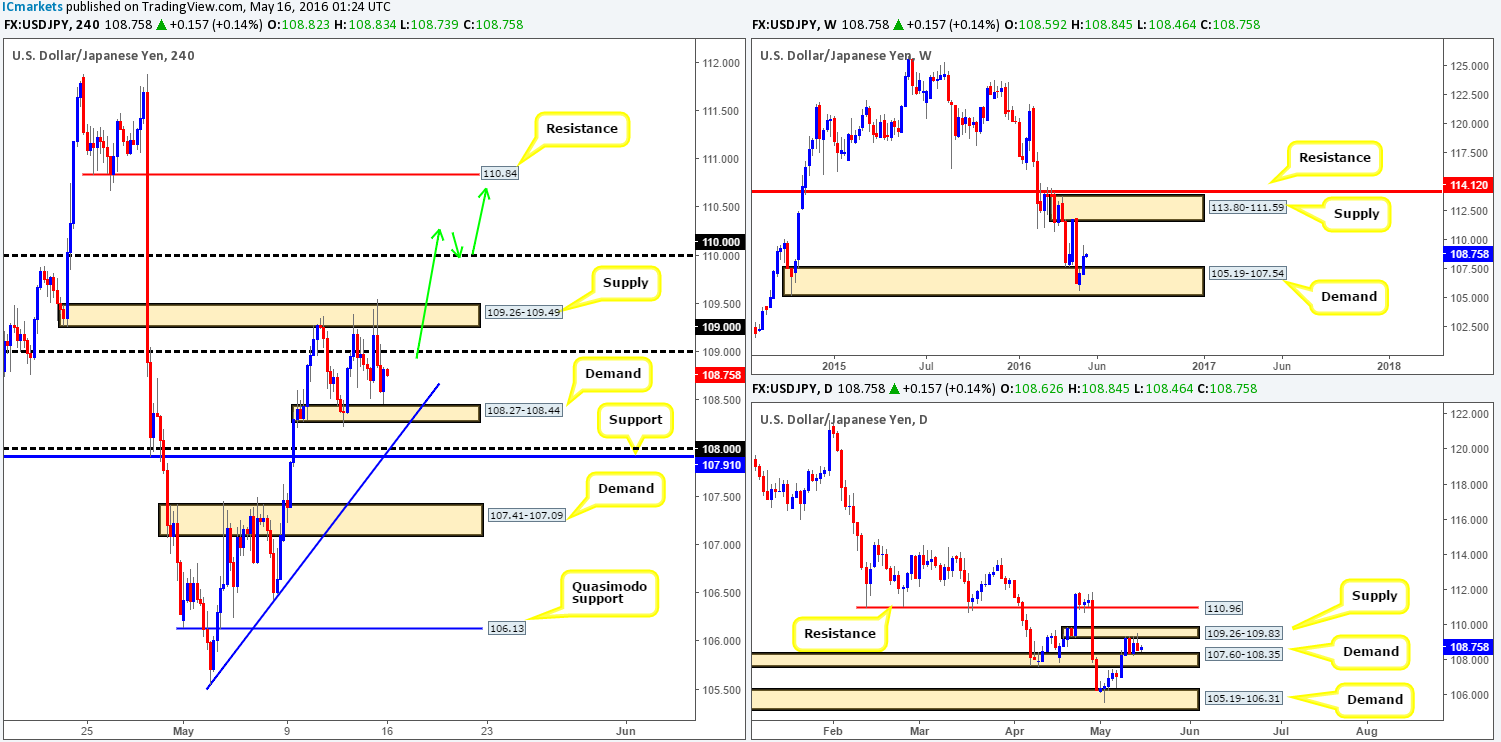
Levels to watch/live orders:
- Buys: Watch for price to close above 110 and look to trade any retest seen thereafter (lower timeframe confirmation required).
- Sells: Flat (Stop loss: N/A).
USD/CAD:
Weekly Gain/Loss: + 28 pips
Weekly closing price: 1.2934
Weekly opening price: 1.2943
Weekly view: Although the Loonie ranged around 250 pips last week, the market only managed to gain 28 pips by the close. During trade, however, price bounced from a broken resistance-turned support at 1.2833, consequently forming an indecision candle with a slight edge seen going to the bulls. Further gains from here could, as far as we can see, force price up to resistance coming in at 1.3381. What is more, oil’s weekly chart shows price is currently trading from supply at 48.33-44.54 which may push the Canadian dollar lower and the U.S. dollar higher.
Daily view: Moving down to the daily timeframe, we can see that during Thursday’s session last week price came within twenty pips of connecting with daily demand at 1.2653-1.2753. This, as you’ll see by looking at the daily chart on oil, coincided beautifully with oil hitting daily supply at 48.33-46.53 (positioned within the above said weekly supply on oil) which is where the black gold remained during Thursday and Friday’s trade. This – coupled with weekly structure on the USD/CAD, may put pressure on any offers seen at the daily resistance line drawn from 1.2970. A close above this line will likely push prices up to daily supply at 1.3218-1.3086.
H4 view: A quick recap of Friday’s trade on the H4 shows that the pair ended the day taking out the 1.29 handle and reaching highs of 1.2957. Now, to simplify our analysis, we have logged our thoughts in bullet-point form:
- Weekly buyers appear in good shape especially considering that oil now also trades at weekly supply (see above).
- Daily action is currently nibbling at resistance, but we feel based on the weekly structure and price also lurking within daily supply on oil, this line will likely cave in (see above).
- Now, from the H4 (based on the points above) we feel a small pullback to 1.29 will be seen which we expect to hold as support. Aggressive traders may look to buy from here as this could form the C-leg to a H4 AB=CD pattern which completes around the 1.3082 region.
- In the event that 1.29 holds, it’s likely only a bounce will be seen at 1.30 should price reach this high due to daily supply sitting above at 1.3218-1.3086.
- From a close above 1.30, we’d be looking to sell between 1.31 and the H4 Quasimodo resistance at 1.3062 which, as you can see, incorporates the H4 AB=CD completion point and is bolstered by daily supply just mentioned above.
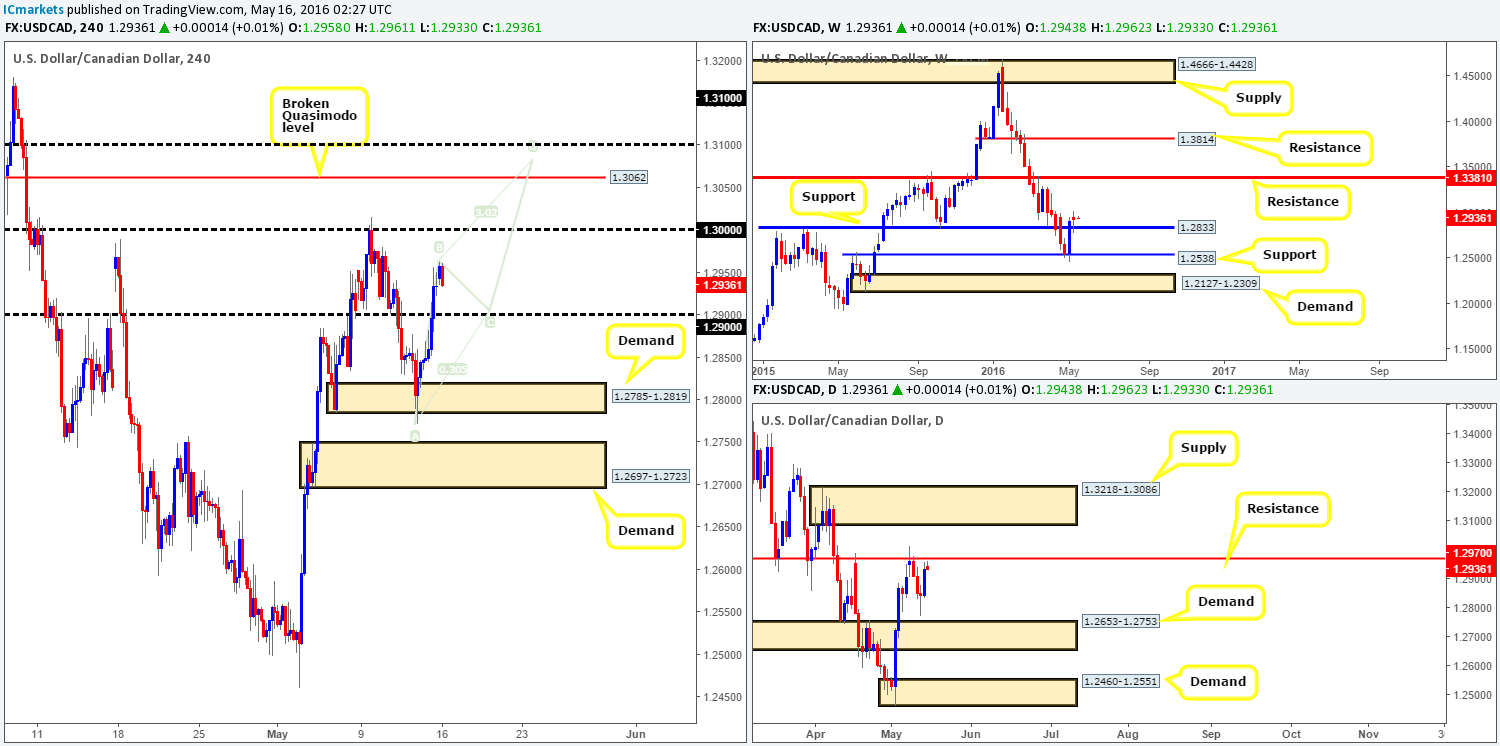
Levels to watch/live orders:
- Buys: 1.2900 region [Tentative – confirmation required] (Stop loss: dependent on where one confirms this area).
- Sells: 1.3100/1.3062 [Tentative – confirmation required] (Stop loss: dependent on where one confirms this area).


