EUR/USD:
Weekly Gain/Loss: -0.52%
Weekly Closing price: 1.1684
Weekly perspective:
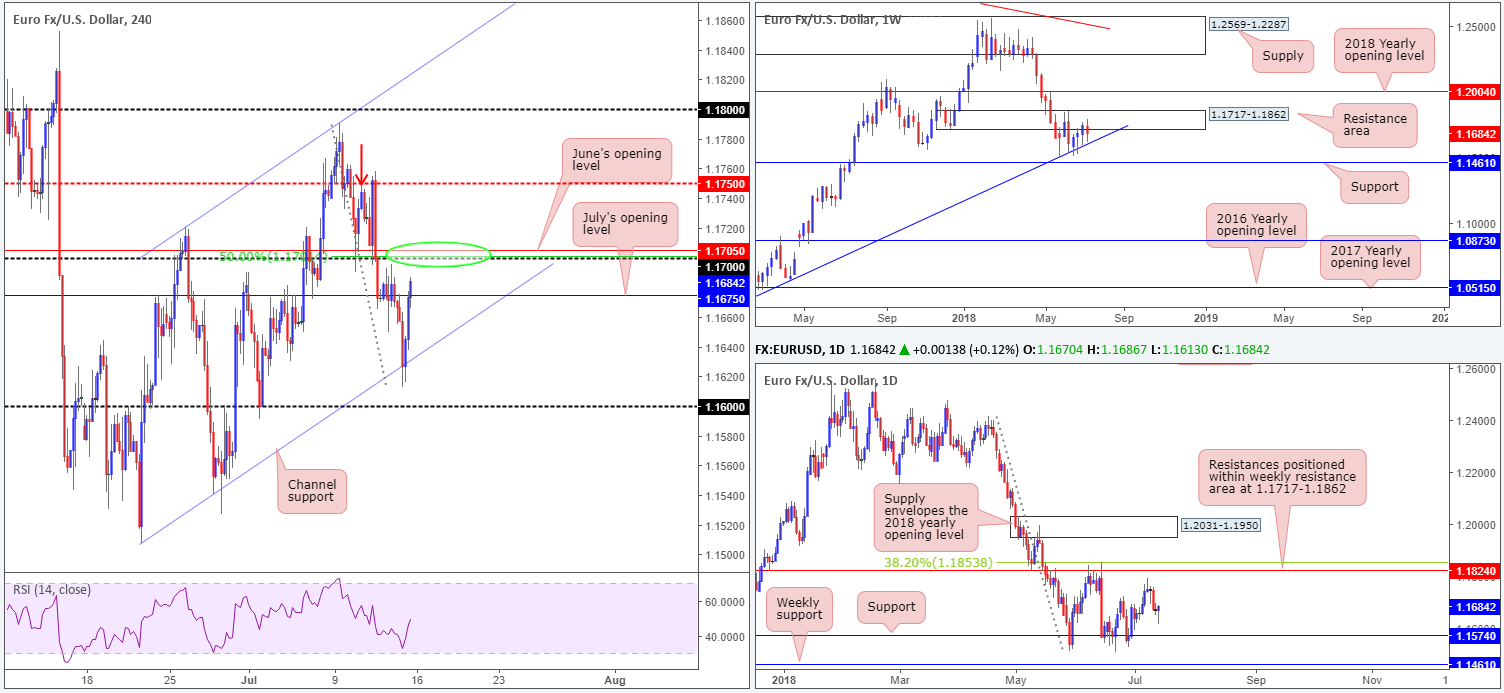
As expected, sellers were drawn into the market last week from within the walls of a resistance area coming in at 1.1717-1.1862, consequently breaking a three-week bullish phase and pulling the unit down to just ahead of nearby trend line support (etched from the low 1.0340). Areas outside of this border to keep eyeballs on fall in at the 2018 yearly opening level drawn from 1.2004 (resistance), and support penciled in at 1.1461.
Daily perspective:
Leaving the resistance level at 1.1824 (and its nearby 38.2% Fib resistance at 1.1853) unchallenged, the single currency chalked up a nice-looking bearish pin-bar formation to begin the week. This eventually translated to a selloff on Wednesday, which saw price end the week bottoming in the shape of a bullish pin-bar-formation just north of support fixed at 1.1574.
In terms of the daily scale, both the noted support and resistance levels could play a significant role during trade this week, and are therefore worthy of the watchlist.
H4 perspective:
A victim of dollar strength saw the pair take to lower levels amid London morning trade on Friday, reaching lows of 1.1613 and challenging H4 channel support (taken from the low 1.1508). Leaving the nearby 1.16 handle unopposed, US traders entered the fray and bought into this recent down move, paring immediate losses and closing back above July’s opening level at 1.1675 to register marginal gains on the day.
The next upside targets on this scale can be seen at the 1.17 handle, shadowed closely by a 50.0% resistance value at 1.1702 and June’s opening level at 1.1705. Another key area to keep a tab on is the H4 mid-level resistance at 1.1750, which also happens to represent a Quasimodo resistance taken from the left shoulder marked with a red arrow.
Areas of consideration:
Longer term, direction is somewhat limited. Buyers and sellers on the weekly scale are tightly confined between the noted resistance area and trend line support, while on the daily picture trade is currently mid-range between mentioned support and resistance.
Intraday (H4), nevertheless, may call for a response off the 1.17 handle, given surrounding confluence: 50.0% resistance and monthly opening level (green circle). The first downside target from this neighborhood will have to be July’s opening level at 1.1675. A break beyond here, however, places the H4 channel support (highlighted above) back in the firing range.
Today’s data points: US retail sales m/m; US Empire state manufacturing index.
GBP/USD:
Weekly Gain/Loss: -0.37%
Weekly Closing price: 1.3233
Weekly perspective:
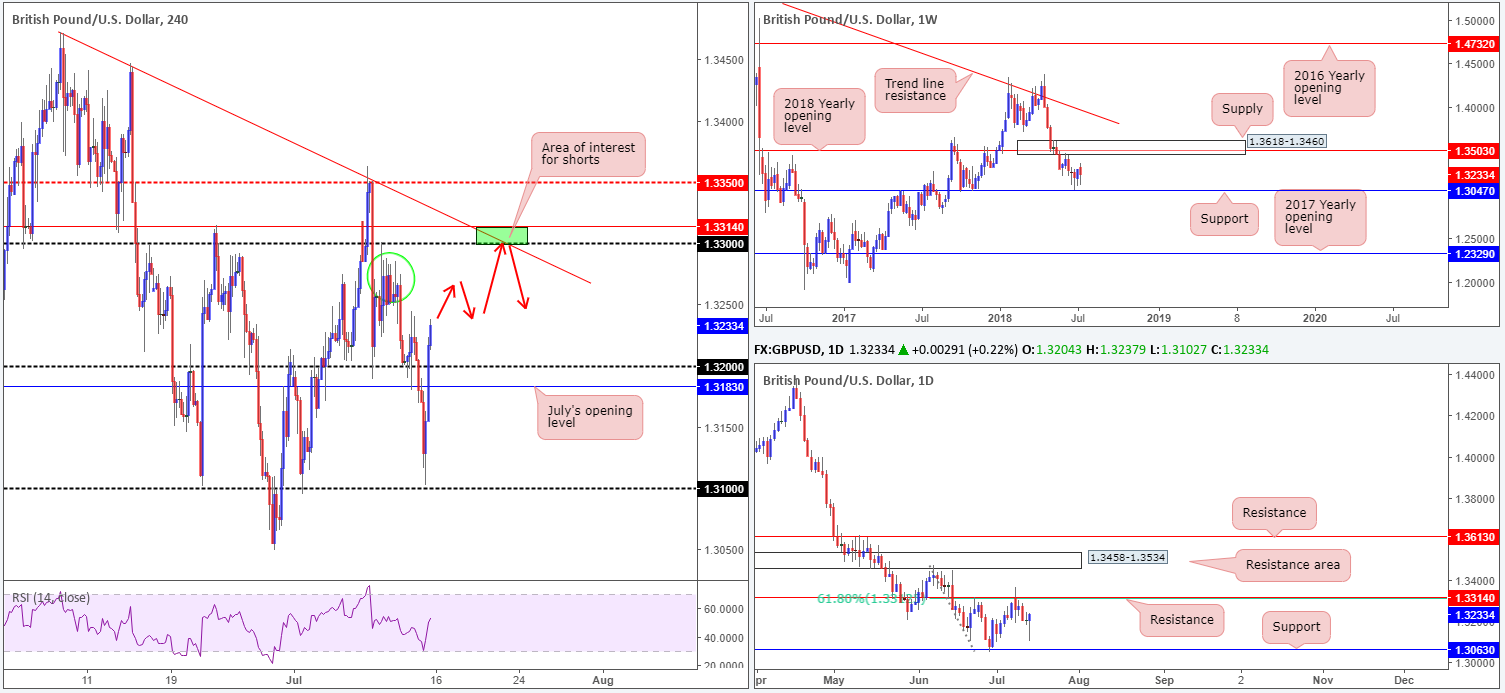
Despite reaching highs of 1.3362, GBP/USD bulls failed to build on prior gains last week.
Support at 1.3047 remains a solid level to keep an eye on this week, as does the supply area seen overhead at 1.3618-1.3460. Note this zone also converges with the 2018 yearly opening level at 1.3503.
Daily perspective:
As can be seen on this timeframe, the buyers attempted to breach resistance at 1.3314 (strong history dating back to October 2017) in the early stages of last week but failed to sustain gains beyond 1.3362. Note this resistance level also has the backing of a 61.8% Fib resistance. The market concluded the week in the shape of an aggressive bullish pin-bar formation printed just ahead of support coming in at 1.3063 – another level with a strong history.
H4 perspective:
Cable was hit by more negative White Paper headlines on Friday amidst reports that US President Trump delivered a damning verdict via a warning to UK PM May about the ‘soft’ Brexit proposal, potentially killing prospects of a trade deal between the two nations. Trump, however, dismissed the criticism calling the news fake, prompting a bid GBP.
Finding support just ahead of the 1.31 handle, and breaking above July’s opening level at 1.3183 as well as the 1.32 handle, the unit ended the day in solid form. Robust supply at 1.3287-1.3250 seen marked with a green circle, nonetheless, is likely to hinder upside today/early this week, owing to its solid base.
Areas of consideration:
Aside from the noted H4 supply area, the team has expressed interest in the 1.33 handle. Besides converging with H4 trend line resistance (extended from the high 1.3472), the round number is positioned 14 pips beneath daily resistance mentioned above at 1.3314 (green zone).
A H4 full or near-full-bodied bearish candle printed from 1.3314/1.33 would, according to the technicals, likely be enough to warrant a short. Stop-loss orders are best placed above the rejection candle’s wick. As for the take-profit targets, this is difficult to judge at this point since the approach has yet to complete.
Today’s data points: US retail sales m/m; US Empire state manufacturing index.
AUD/USD:
Weekly Gain/Loss: -0.13%
Weekly Closing price: 0.7422
Weekly perspective:
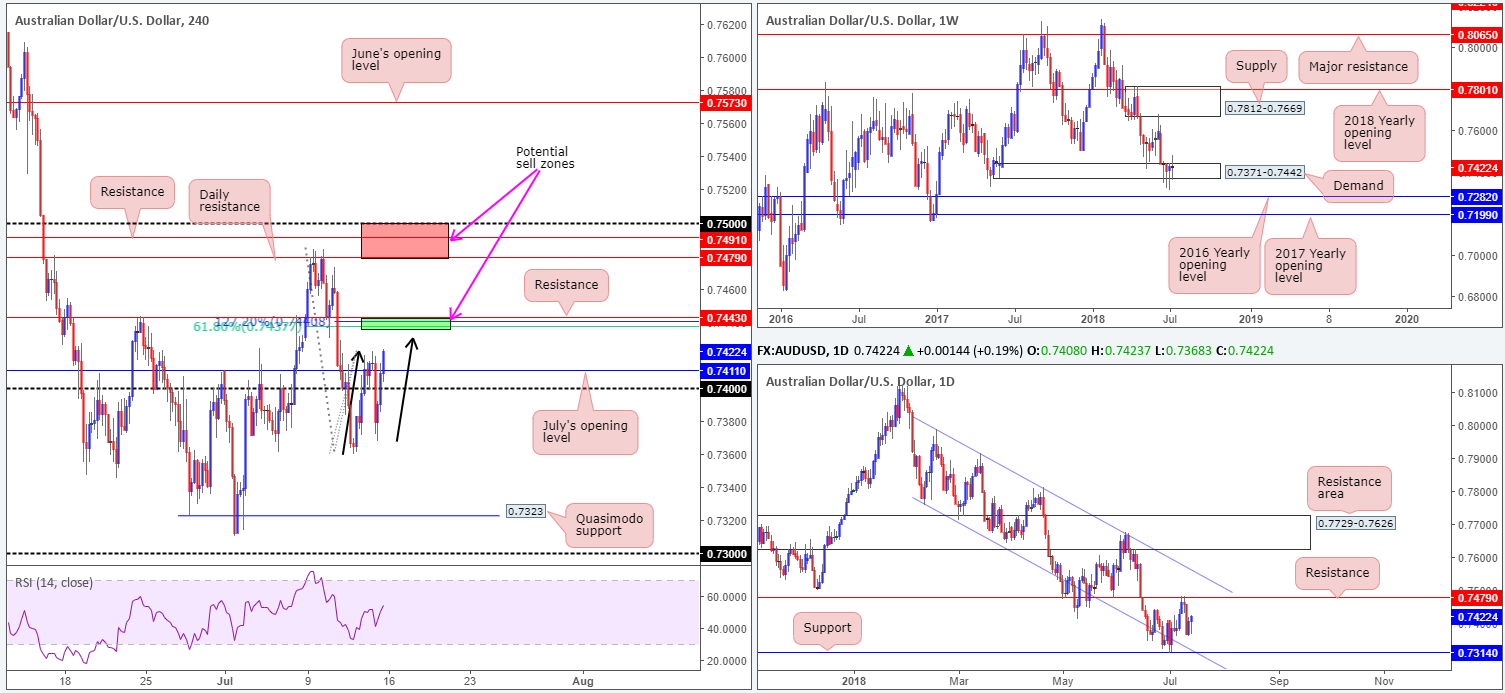
Although the commodity currency ranged in excess of 120 pips last week, the market concluded trade relatively unchanged, hence the clear-cut indecision candle. Demand at 0.7371-0.7442, as you can see, remains in a fragile state at the moment, opening the window to a possible test of the 2016 yearly opening level at 0.7282 sometime down the road. In the event that the bulls regain consciousness, however, a retest of supply at 0.7812-0.7669 may be on the cards.
Daily perspective:
Support at 0.7314, alongside its closely associated channel support taken from the low 0.7758 remains a focal point on this timeframe, as does the resistance level seen overhead at 0.7479. Both levels carry equal weight, in our opinion.
H4 perspective:
A quick recap of Friday’s movement on the H4 timeframe reveals early London traded on the offer, bringing the Aussie to lows of 0.7368. Bolstered by a USD pullback, however, US traders entered the fray and defended said lows on a strong bid, consequently erasing intraday losses and reclaiming the 0.74 handle and July’s opening level at 0.7411 into the close.
The next upside objective on this scale falls in around the 0.7443 area. Not only does this level boast a 61.8% Fib resistance value at 0.7437, it also has nearby resistance in the form of an AB=CD 127.2% Fib ext. point at 0.7440 (green area).
Areas of consideration:
A bounce from the underside of the green H4 sell zone at 0.7443/0.7437 is expected. However, given the size of the zone, a fakeout above it could take place before the bears step in. Therefore, trade with caution!
Beyond this area, traders’ crosshairs will likely be fixed on the upper red H4 zone at 0.75/0.7479 (comprised of a round number, a H4 resistance level and the daily resistance barrier mentioned above at 0.7479). This area already held price lower at the beginning of last week (a noted sell zone), so we may well see history repeat itself sometime this week.
Regardless of the H4 confluence surrounding 0.7443/0.7437, the upper red zone is preferred owing to its relationship with daily structure.
Today’s data points: China GDP q/y; China fixed asset investment ytd/y; China industrial production y/y; China NBS press conference; US retail sales m/m; US Empire state manufacturing index.
USD/JPY:
Weekly Gain/Loss: +1.74%
Weekly Closing price: 112.33
Weekly perspective:
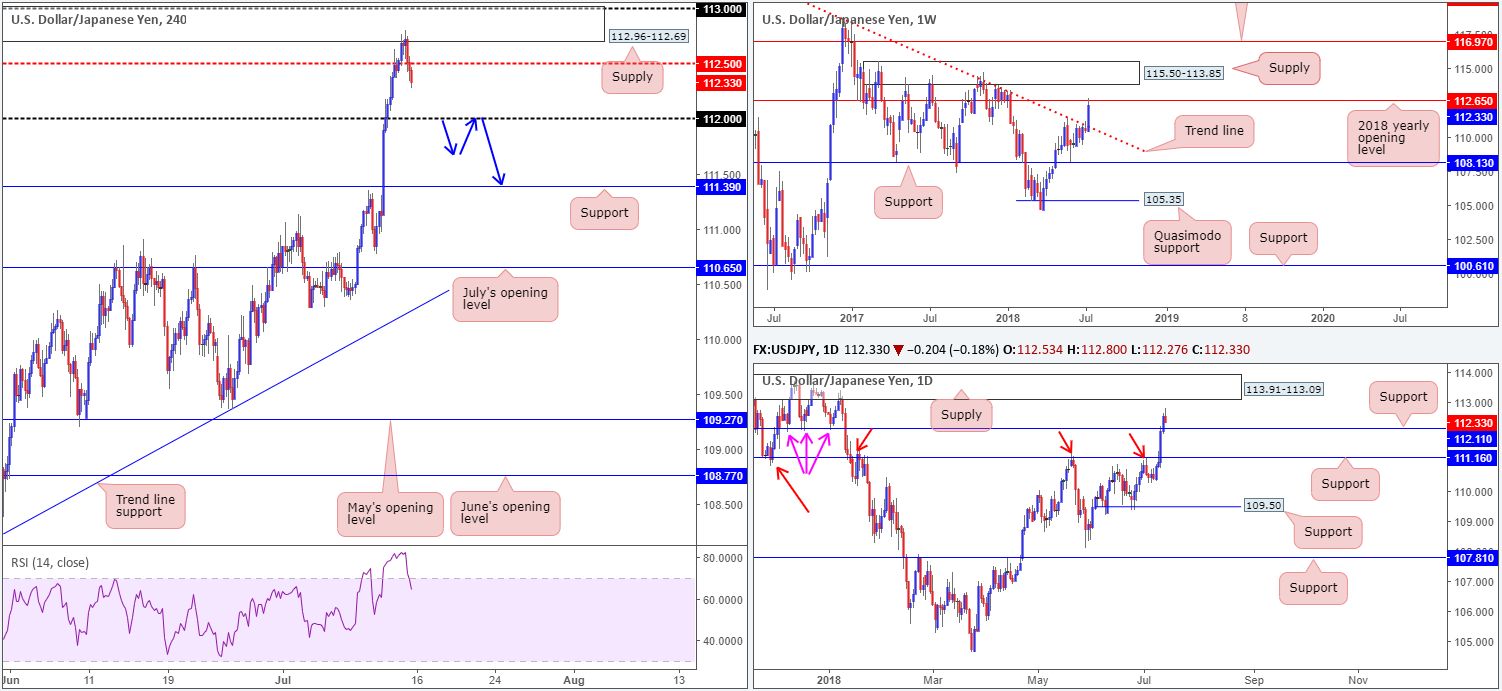
The USD/JPY gained approximately 200 pips last week after firmly pushing through long-term trend line resistance taken from the high 123.57. This led to the 2018 yearly opening level at 112.65 being brought into the fight, which, as expected, held ground. Yearly levels tend to command attention, so don’t make the mistake of overlooking it!
Daily perspective:
Turning lower just south of supply at 113.91-113.09 (likely the result of the 2018 yearly opening level on the weekly timeframe), the daily candles now appear poised to retest resistance-turned support fixed at 112.11. Note how well this level held as support in December 2017 (pink arrows) – discount it at your peril! Beneath this line, however, attractive support also rests at 111.16. Should price action reach this low this week, the pair is likely to find support with it having been an impressive resistance over the course of the year (see red arrows).
H4 perspective:
Bolstered by the 2018 yearly opening level on the weekly timeframe at 112.65, H4 supply at 112.96-112.69 capped upside amid trade on Friday. H4 mid-level support at 112.50 was wiped out, possibly opening the path south for a test of the 112 handle. That is, of course, if the sellers can get through daily support at 112.11 first, though!
Areas of consideration:
At current price, the USD/JPY is a difficult market to trade. Irrespective of the direction one selects here, opposing structure is clearly evident.
With the above in mind, why not consider waiting and seeing if weekly sellers maintain control of this market and break through 112. This way, we know daily support is out of the picture, with downside then reasonably free to approach H4 support at 111.39, followed closely by daily support mentioned above at 111.16 (both ideal downside targets).
A H4 close below 112 that’s followed up with a retest in the shape of a full or near-full-bodied H4 bearish candle would, from a technical standpoint, likely be enough to suggest shorts.
Today’s data points: US retail sales m/m; US Empire state manufacturing index; Japanese banks closed in observance of Marine Day.
USD/CAD:
Weekly Gain/Loss: +0.61%
Weekly Closing price: 1.3152
Weekly perspective:
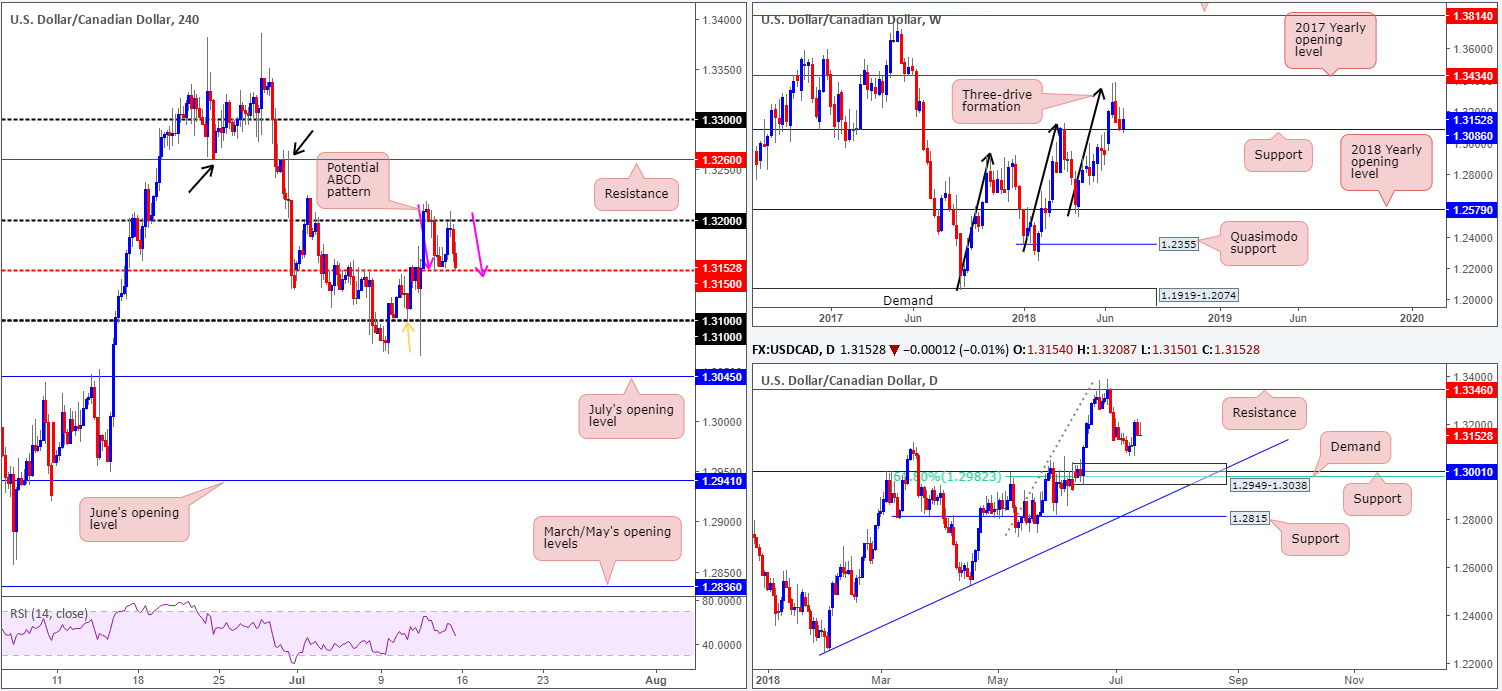
After completing a nice-looking three-drive formation just south of the 2017 yearly opening level at 1.3434 a few weeks back, USD/CAD sellers forced the unit lower and challenged support at 1.3086. The level, as you can see, remains firm, but has yet to print anything notable to the upside. A decisive push sub 1.3086 could eventually lead to a test of support coming in at 1.2579: the 2018 yearly opening level.
Daily perspective:
A closer look at price action, however, reveals strong support standing at 1.3001 (history dating back to Sept 2016), followed closely by a 61.8% Fib support value at 1.2982. On top of this, we can also see demand at 1.2949-1.3038 converging with these levels! Collectively, these areas are likely to hinder downside movement. To the upside, nonetheless, we see very little in terms of active resistance until 1.3346.
H4 perspective:
Friday’s intraday movements were little to get excited about. The H4 candles remained confined between the 1.32 handle and H4 mid-level support at 1.3150. Nevertheless, it is worth pointing out the potential ABCD formation (see pink arrows) that completes sub 1.3150. The only concern about buying from here, though, is the pattern has limited support. Therefore, the break of 1.3150 may see active sellers enter the market, targeting 1.31, which happens to be located just ahead of the current weekly support and also represent a H4 Quasimodo support (see left shoulder marked with an orange arrow).
Areas of consideration:
A move down to 1.31 would be interesting. From this point the team would be watching for H4 price to print a bullish pin-bar formation that whipsaws through the round number and tags nearby weekly support at 1.3086: a high-probability long.
In terms of possible trading setups at current price, there’s little in this market jumping out at us at the moment. Of course, the H4 ABCD formation may produce a bounce higher, but given the lack of additional support, it’s unlikely to produce anything earth shattering.
Today’s data points: US retail sales m/m; US Empire state manufacturing index; (CAD) Foreign securities purchases.
USD/CHF:
Weekly Gain/Loss: +1.19%
Weekly Closing price: 1.0015
Weekly perspective:
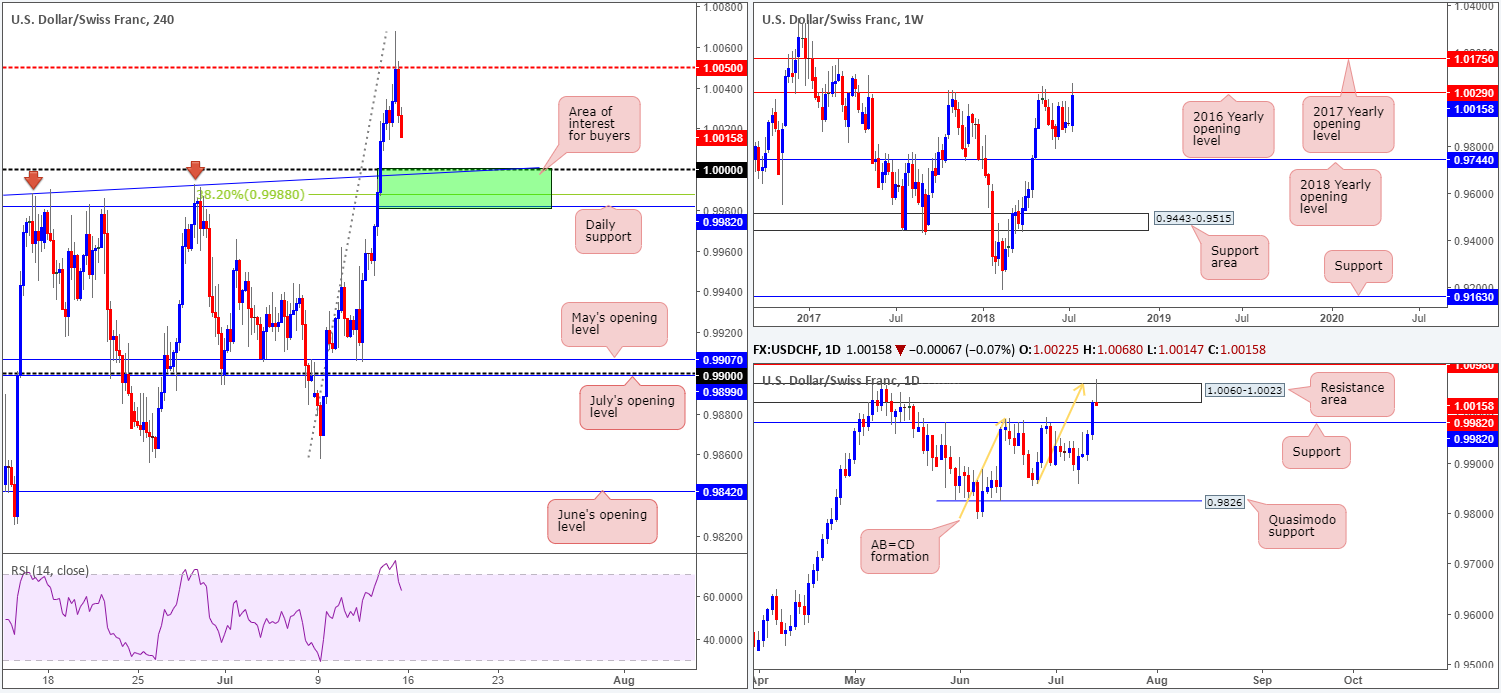
USD/CHF bulls attacked higher levels over the course of last week, triggering a run towards the 2016 yearly opening level at 1.0029. Holding price lower on two occasions in 2017, and once in 2018, this level commands attention! In the event the bulls continue to press higher this week, though, keep eyes on the 2017 yearly opening line at 1.0175.
Daily perspective:
Last week’s advance witnessed daily action break through resistance at 0.9982, and marginally surpass a nearby resistance area at 1.0060-1.0023 into the close. Interestingly, though, the week ended in the shape of a bearish pin-bar formation at an AB=CD completion point (see orange arrows). Further selling from here will see the resistance-turned support at 0.9982 re-enter the fray.
H4 perspective:
Unable to sustain gains beyond the H4 mid-level resistance at 1.0050, the H4 candles powered lower on Friday and finished the day closing within touching distance of the key figure 1.0000 (parity). There are a number of technical aspects supporting a bounce from this level:
- Trend line support taken from the high 0.9983.
- 38.2% Fib support at 0.9988.
- Daily support mentioned above at 0.9982.
Areas of consideration:
Though the majority of the market will be getting itchy fingers as price approaches 1.0000 – even more so given the noted confluence – let’s not forget where we’re coming from on the higher timeframes! Not only do we have weekly resistance in the form of the 2016 yearly opening level at 1.0029, daily price also chalked up a nice-looking bearish pin-bar formation off an AB=CD completion point around the top edge of a resistance area (1.0060-1.0023).
Knowing this, traders are urged to tread carefully around 1.0000 and at least wait for H4 candle confirmation before pulling the buy trigger (full or near-full bodied candle formation would suffice). In the event the sellers push below the aforementioned daily support, this market will be in sell mode, as far as we can see. But we’ll cross that bridge when (or indeed if) we come to it.
Today’s data points: US retail sales m/m; US Empire state manufacturing index.
Dow Jones Industrial Average:
Weekly Gain/Loss: +2.30%
Weekly Closing price: 25005
Weekly perspective:
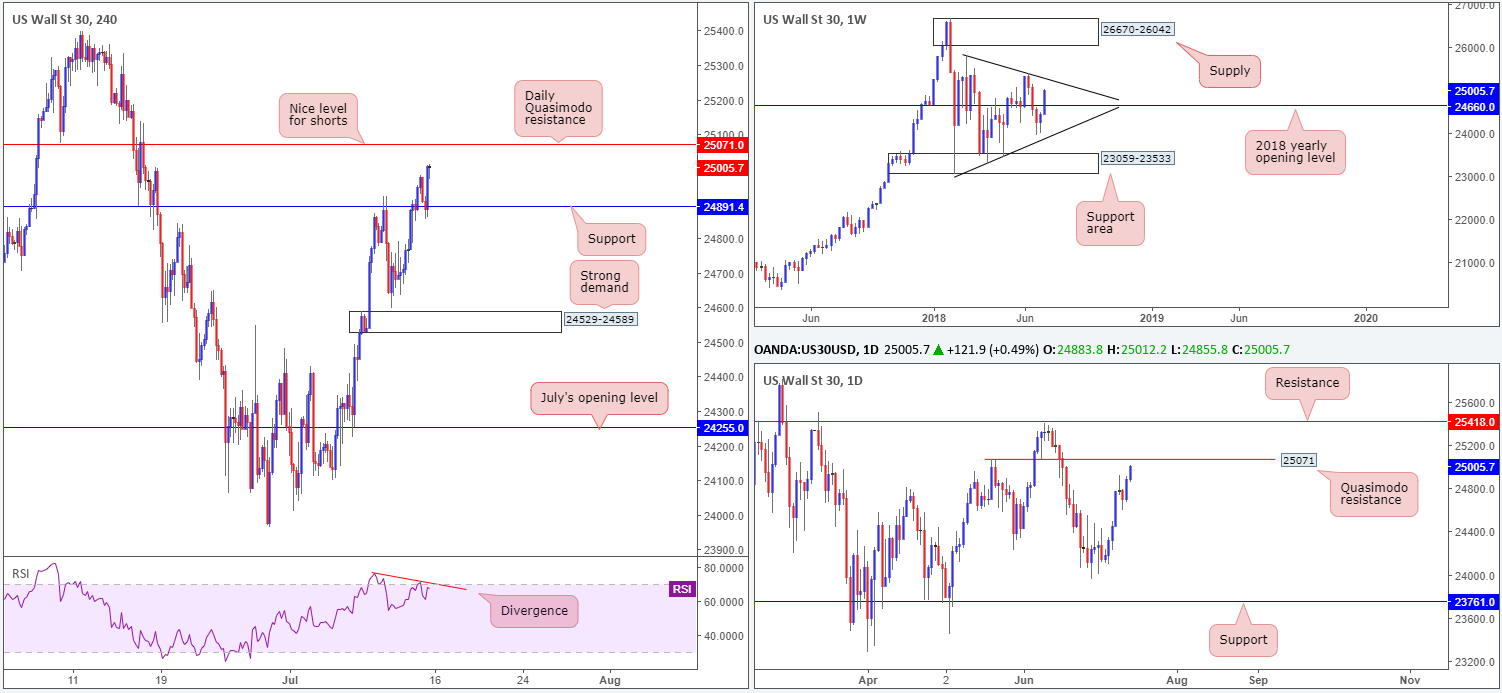
Wall Street concluded the week in strong fashion, up approximately 560 points. The move cleared offers around the 2018 yearly opening level at 24660, and potentially set the stage for a run up to trend line resistance drawn from the high 25807 this week.
Daily perspective:
Before weekly players can reach the noted trend line resistance, however, daily sellers may put up a fight from a Quasimodo resistance level at 25071. A break beyond this base places daily resistance at 25418 in the firing range.
H4 perspective:
A look at recent dealings on the H4 timeframe shows us the buyers took out resistance at 24891 and shortly after retested the level as support. This has, as you can see, firmly placed the market within touching distance of the aforementioned daily Quasimodo resistance. Another important thing to consider on the H4 scale is the RSI indicator displaying divergence and overbought readings.
Areas of consideration:
A H4 full or near-full-bodied bearish candle printed off the aforementioned daily Quasimodo resistance level is, in our humble view, a high-probability shorting opportunity. Why we wait for additional candle confirmation off daily resistance is simply due to the threat of a potential move higher on the weekly scale, as highlighted above.
Today’s data points: US retail sales m/m; US Empire state manufacturing index.
XAU/USD (Gold)
Weekly Gain/Loss: -1.07%
Weekly Closing price: 1241.2
Weekly perspective:
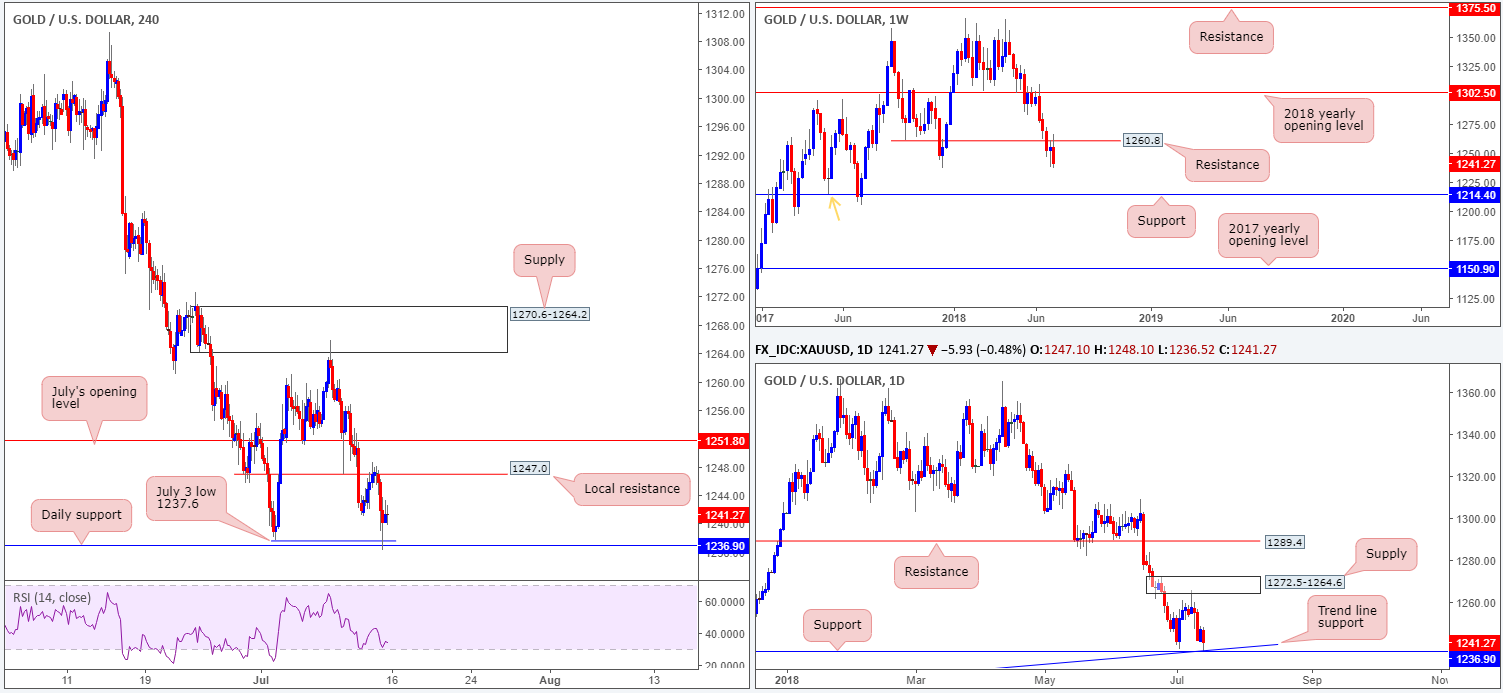
A clear victim of USD strength, the price of gold, in the shape of a bearish engulfing candle, declined in value last week after retesting resistance plotted at 1260.8. Additional selling from this point could eventually bring the yellow metal down as far as support at 1214.4, which also happens to represent a Quasimodo support taken from the left shoulder marked with an orange arrow.
Daily perspective:
A little lower on the curve, however, we can see support at 1236.9 is in play at the moment. We can also see that the level unites beautifully with a trend line support etched from the low 1195.1. Whether this will be enough to stand up to weekly selling is difficult to judge at this point. In case of a move lower, though, it may be worth penciling in the Quasimodo support at 1217.6 as the next potential downside target (not seen on the screen).
H4 perspective:
Following a clean test of resistance at 1247.0, sellers came in strongly on Friday. Breaching the July 3 low 1237.6, likely tripping stop-loss orders, the yellow metal went on to shake hands with the daily support level mentioned above at 1236.9. In view of the reasonably solid bounce from the daily level, alongside liquidity likely offered from stops being taken out below 1237.6, an upside extension from this point is possible.
Areas of consideration:
According to the H4 and daily structures, a move to the upside could be seen. However, due to where we’re coming from on the weekly scale: resistance at 1260.8, buyers will likely struggle to get beyond the H4 resistance level at 1247.0 – the most we see is 1251.8: July’s opening level.
On account of this reading, looking for selling opportunities may be the better path to take. Therefore, should a H4 close be seen beyond the current daily support level that’s followed up with a retest as resistance, a sell in this market would be considered high probability, targeting H4 support at 1228.0 (not seen on the screen), followed closely by daily Quasimodo support at 1217.6.
The use of the site is agreement that the site is for informational and educational purposes only and does not constitute advice in any form in the furtherance of any trade or trading decisions.
The accuracy, completeness and timeliness of the information contained on this site cannot be guaranteed. IC Markets does not warranty, guarantee or make any representations, or assume any liability with regard to financial results based on the use of the information in the site.
News, views, opinions, recommendations and other information obtained from sources outside of www.icmarkets.com.au, used in this site are believed to be reliable, but we cannot guarantee their accuracy or completeness. All such information is subject to change at any time without notice. IC Markets assumes no responsibility for the content of any linked site. The fact that such links may exist does not indicate approval or endorsement of any material contained on any linked site.
IC Markets is not liable for any harm caused by the transmission, through accessing the services or information on this site, of a computer virus, or other computer code or programming device that might be used to access, delete, damage, disable, disrupt or otherwise impede in any manner, the operation of the site or of any user’s software, hardware, data or property.


