EUR/USD:
Weekly gain/loss: +0.38%
Weekly closing price: 1.2329
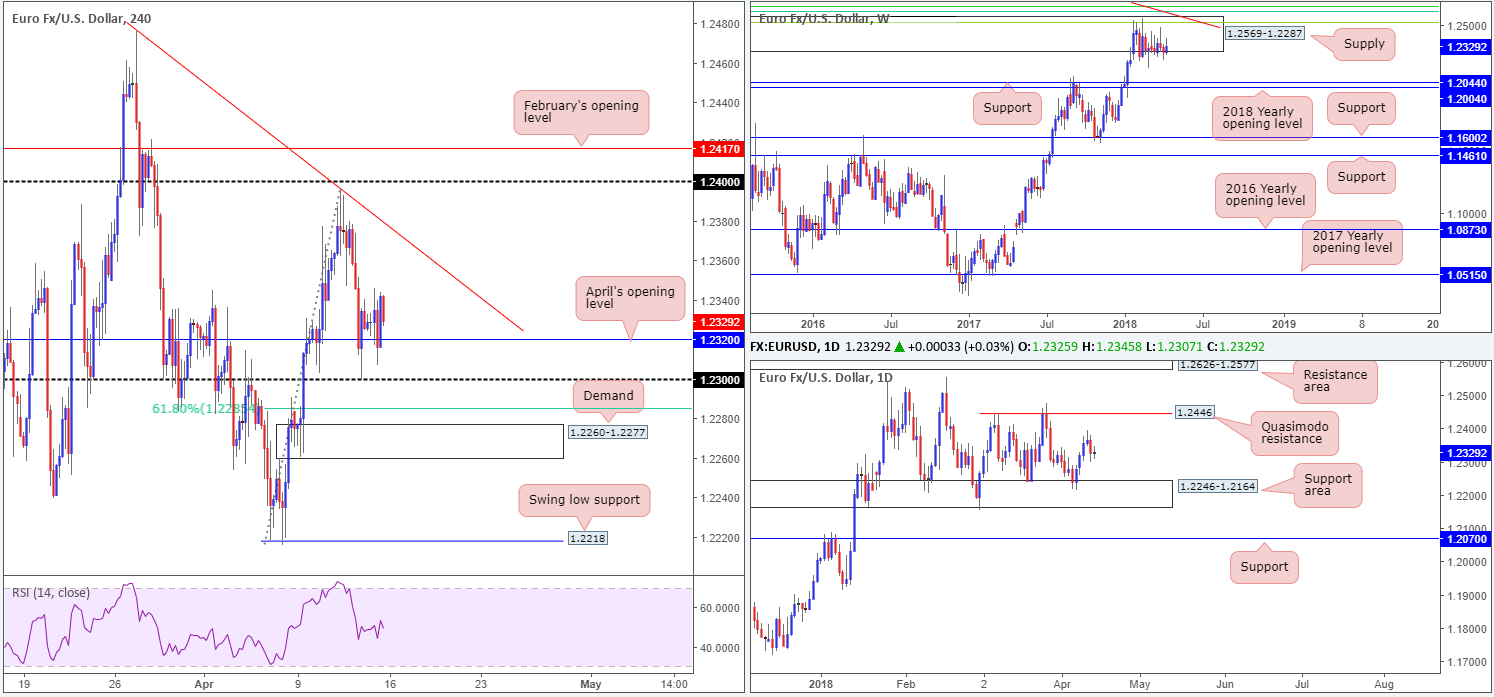
Molded in the shape of a strong bearish base back in late 2014, the weekly supply zone seen at 1.2569-1.2287 has managed to cap upside activity since late January. In the event that sellers eventually regain consciousness, downside targets fall in around the weekly support band at 1.2044, shadowed closely by the 2018 yearly opening level at 1.2004.
Navigating price action on the daily timeframe, we can see that the shared currency remains stationed above a rather interesting daily support area at 1.2246-1.2164. Managing to construct a floor in this market a few pips beneath the weekly supply zone, this area will clearly need to be engulfed before weekly price can pursue lower levels. The next port of call beyond the daily zone can be seen at 1.2070: a daily support level positioned just north of the aforementioned weekly levels.
A quick recap of Friday’s action on the H4 timeframe shows price was relatively sedated, consequently forming a clear-cut indecision candle on the daily timeframe. US prelim UoM consumer sentiment and JOLTS job openings failed to generate much action, limited to a small push to the upside. The H4 candles concluded the week just north of April’s opening level at 1.2320, following a recovery off of 1.23 amid Thursday’s segment.
Providing the buyers remain positive above April’s opening level, the H4 trend line resistance etched from the high 1.2476 will likely be the next upside objective. A push through 1.23, on the other hand, will likely see price action target a 61.8% H4 Fib support at 1.2285, and nearby H4 demand plotted at 1.2260-1.2277.
Potential trading zones:
According to higher-timeframe structure, the euro’s uptrend, which began early 2017 (see weekly chart), is currently restrained by the noted weekly supply. As a result, buying this market medium/long term is a challenge. Daily price could potentially jolt either way this week, as above the current daily support area we have a nice-looking daily Quasimodo resistance at 1.2446.
Looking for an intraday move higher off of April’s opening level on the H4 timeframe could be a possibility today/tomorrow, but is not really a setup we would label high probability, due to limited confluence in terms of structure.
The H4 demand mentioned above at 1.2260-1.2277 is an area we’ll be watching today/early week, as the momentum from the base is incredibly strong and it is positioned just beneath a 61.8% H4 Fib support at 1.2285. However, do remain aware that directly below it sits the top edge of the aforesaid daily support area! A fakeout, therefore, is a possibility.
Data points to consider today: US retail sales m/m; US Empire state manufacturing index; FOMC member Bostic also takes to the stage.
GBP/USD:
Weekly gain/loss: +1.04%
Weekly closing price: 1.4236
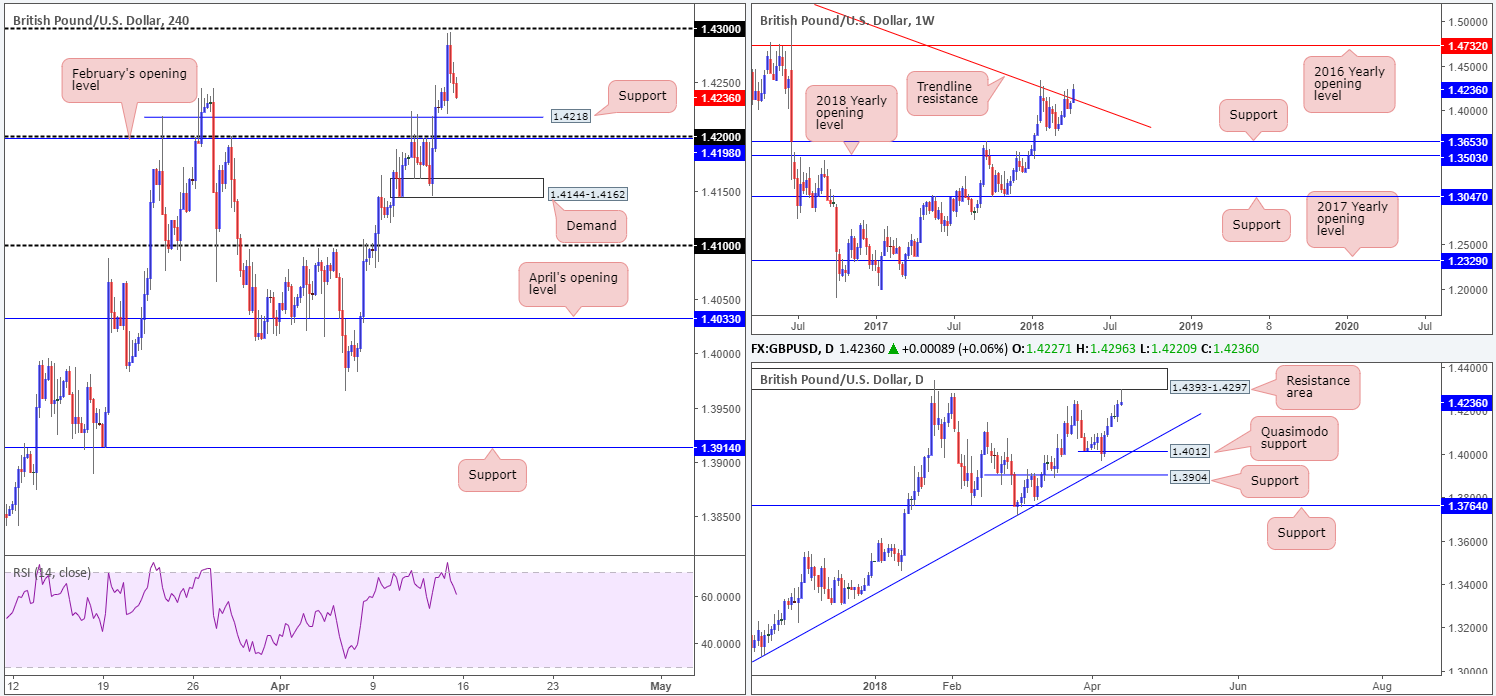
Over the course of last week’s session, the British pound extended higher. As you can see from the weekly timeframe, price action has firmly closed above a long-term weekly trend line resistance taken from the high 1.5930. Do bear in mind that this line has not witnessed a close higher since late 2015! Should the bulls remain defensive, the next upside target can be seen at 1.4732: the 2016 yearly opening level.
A closer look at price action on the daily timeframe highlights a daily resistance area at 1.4393-1.4297, and Friday’s rejection candle in the shape of a daily bearish pin-bar formation! This has likely caught the attention of candlestick enthusiasts given that there’s space to trade as far south as a daily Quasimodo support at 1.4012.
Moving over to the H4 timeframe, early London trade on Friday saw the GBP/USD top just south of the 1.43 handle, retreating 60 or so pips and positioning H4 price within striking distance of a H4 support level at 1.4218, followed closely by 1.42.
Potential trading zones:
In a nutshell, the structure of this market can be boiled down to the following:
- Weekly action reflecting a bullish tone above major weekly trend line resistance.
- Daily price suggesting lower prices could be on the horizon from a daily resistance area.
- H4 movement positioned ahead of support structure after a modest selloff on Friday.
Clearly we have a difference of opinion regarding higher-timeframe flows, which is never a good sign regarding direction. To that end, a long off of 1.42/1.4218 on the H4 timeframe is a chancy move. Although you will be trading in-line with weekly flow, you’ll simultaneously be buying into daily structure!
Selling beyond 1.42 not only has the same higher-timeframe conflict (only in reverse), we also have to contend with a nearby H4 demand at 1.4144-1.4162.
On account of the above, neither a long nor short seems attractive at the moment. Opting to remain on the sidelines, therefore, may be the better path to take.
Data points to consider today: US retail sales m/m; US Empire state manufacturing index; FOMC member Bostic also takes to the stage.
USD/JPY:
Weekly gain/loss: +0.45%
Weekly closing price: 107.35
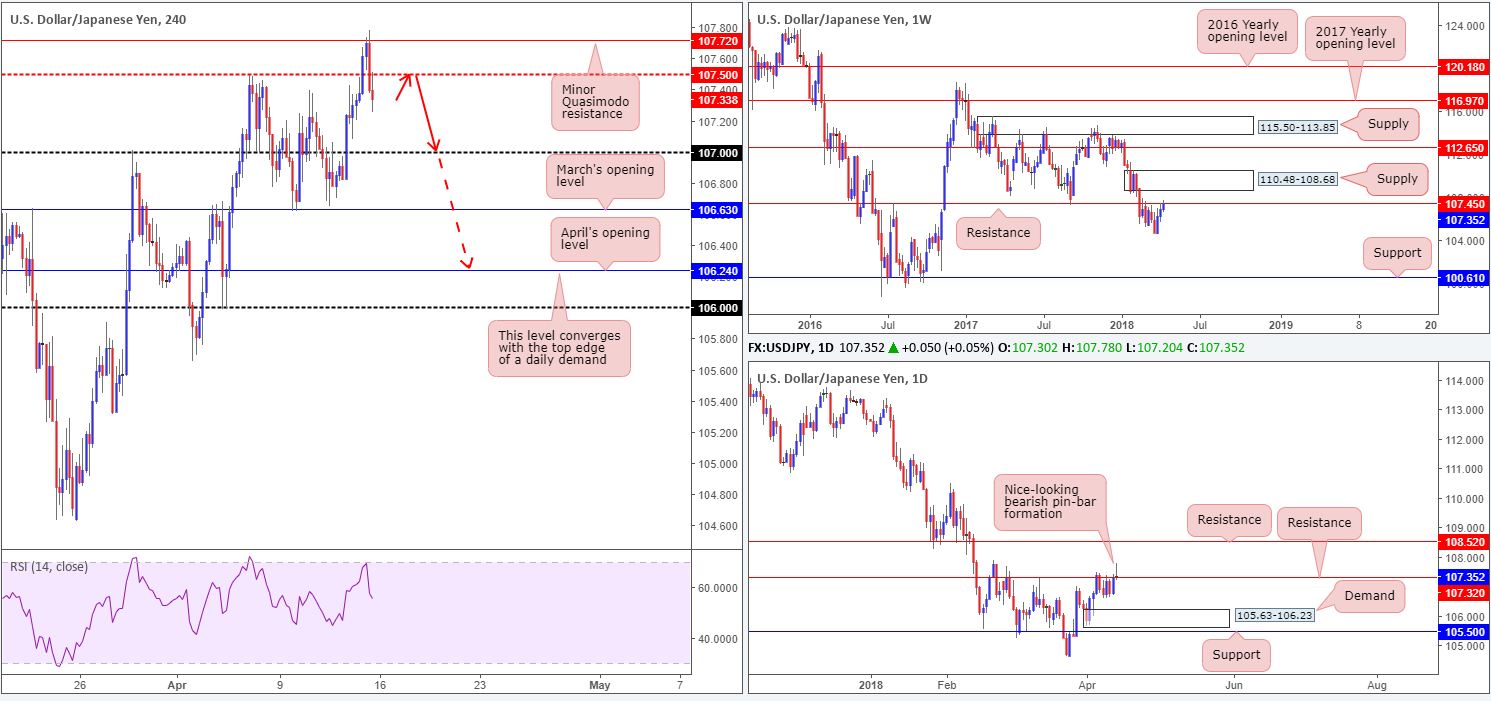
The USD/JPY extended higher for a third consecutive session last week, consequently bringing weekly price into contact with a weekly resistance level plotted at 107.45. This level, as you can see, boasts a reasonably robust history and, therefore, could eventually force price action lower. In the event that buying persists, nevertheless, the weekly supply zone at 110.48-108.68 will likely be brought into the fray.
A little lower on the curve, however, we can see that daily price ended the week positing a nice-looking daily bearish pin-bar formation that closed marginally above a daily resistance level at 107.32. Continued selling from this point could lead to a test of a daily demand area seen at 105.63-106.23, whereas a push to the upside has another layer of daily resistance to target at 108.52 (located just south of the aforementioned weekly supply zone).
Friday’s movement on the H4 timeframe saw the candles drive through offers at 107.50 and shake hands with a minor H4 Quasimodo resistance level priced in at 107.72. The decline in US equity prices favored the Japanese yen, pushing the USD/JPY lower from this angle and recapturing 107.50, which was retested as resistance into the closing bell. Apart from minor H4 demand seen around the 107.25ish range, the next intraday support falls in at 107.
Potential trading zones:
Seeing H4 prices settle beneath 107.50 on Friday, along with both weekly and daily charts suggesting lower prices could be on the horizon, further selling is likely. Personally, though, we would wait for H4 price to retest 107.50 a second time. Should this occur along with a full or near-full-bodied H4 bearish candle, a short play could be considered. The ultimate downside target from here can be seen at April’s opening level at 106.24. Why this level? Well, look over to the daily timeframe. The next downside target on this scale, as mentioned above, can be seen at a daily demand based around 105.63-106.23!
Data points to consider today: US retail sales m/m; US Empire state manufacturing index; FOMC member Bostic also takes to the stage.
USD/CAD:
Weekly gain/loss: -1.38%
Weekly closing price: 1.2608
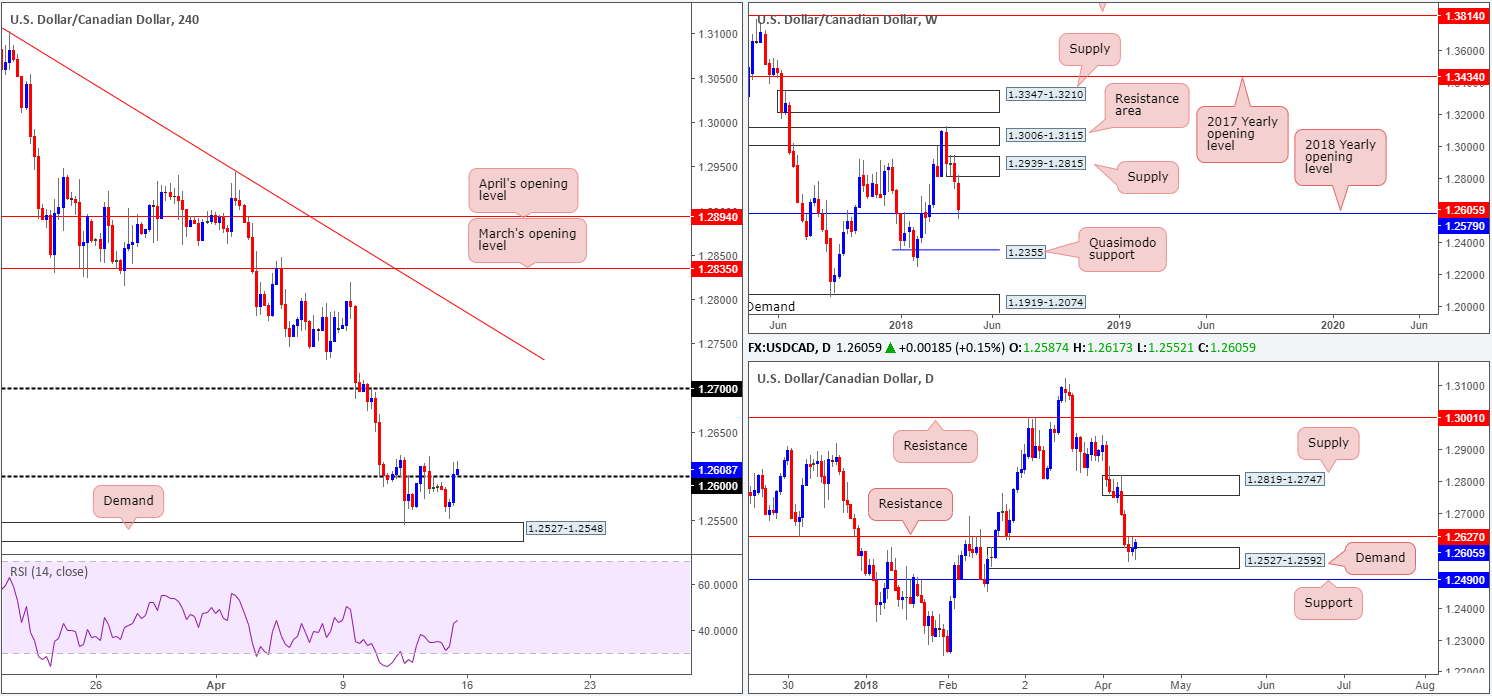
The USD/CAD sustained further losses last week, sending weekly price down to the 2018 yearly opening level at 1.2579. As is shown on the weekly chart, price managed to hold firm from this level going into the close. A violation here could eventually see the pair shake hands with a weekly Quasimodo support noted at 1.2355, while a rotation back to the upside has a weekly supply area at 1.2939-1.2815 to target.
Turning the focus down to the daily timeframe, the piece is seen trading from a daily demand zone at 1.2527-1.2592, but struggling to register bullish moves beyond nearby daily resistance at 1.2627. A meaningful push beyond this resistance could lead to a move being seen up to daily supply priced in at 1.2819-1.2747, which happens to be glued to the underside of the noted weekly supply base. On the other side of the coin, though, a break of the current daily demand would almost immediately position the unit at daily support marked from 1.2490.
H4 demand at 1.2527-1.2548, as you can see, remains in play. Also visible on the H4 timeframe is price wrapped up Friday’s session marginally above 1.26. This is the third time the candles have been above this number in recent trading, and each time price has failed to sustain upside. This, from a technical standpoint, is likely down to the current daily resistance level positioned at 1.2627.
Potential trading zones:
Although weekly price exhibits potential support from the 2018 yearly opening level, this is a chancy market to buy for a number of reasons. As highlighted in Friday’s report we believe that to confirm upside, a DAILY close beyond the daily resistance level mentioned above at 1.2627 needs to take place. At that point, the next upside target on the H4 timeframe would sit at 1.27, followed then by the underside of the noted daily supply area at 1.2747.
Data points to consider today: US retail sales m/m; US Empire state manufacturing index; FOMC member Bostic also takes to the stage.
USD/CHF:
Weekly gain/loss: +0.31%
Weekly closing price: 0.9617
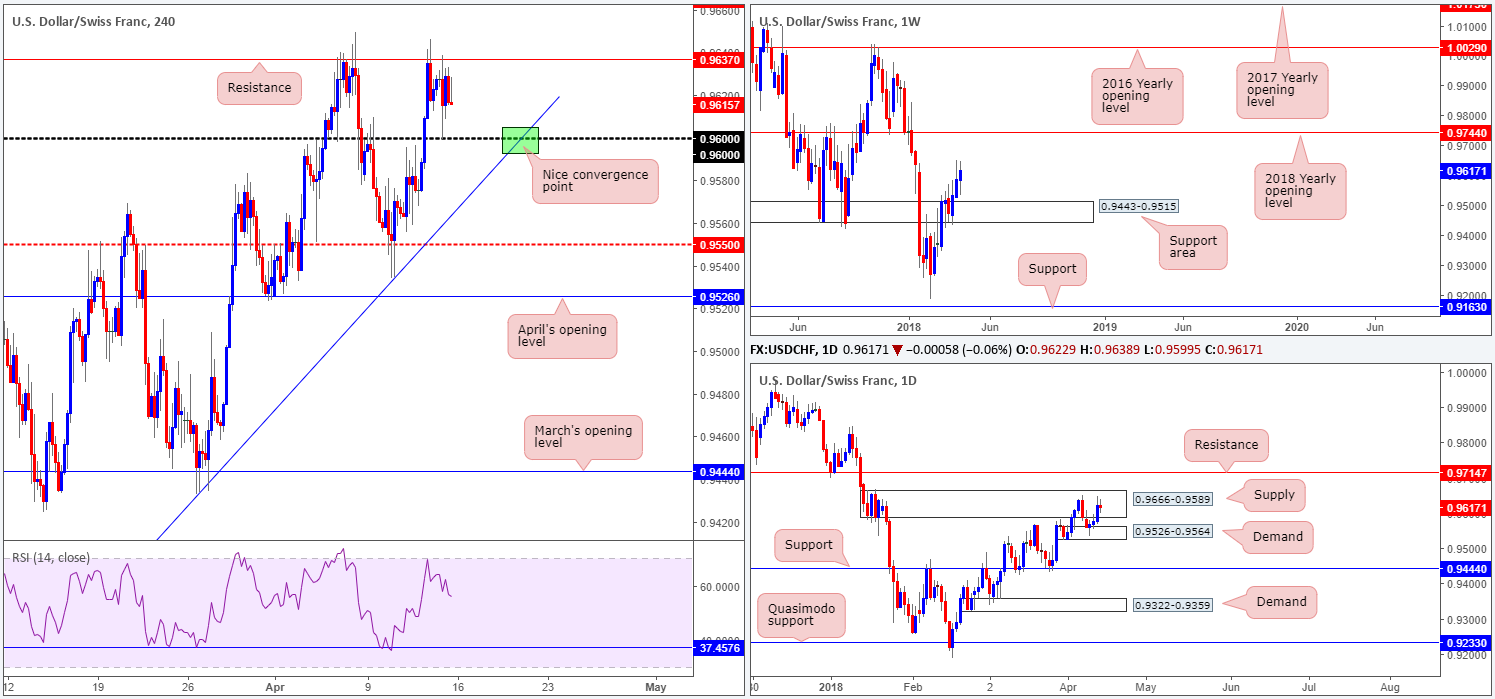
Despite registering its third weekly close higher; the pair was unable to close outside of its prior week’s range high 0.9649. According to weekly structure, though, further buying is entirely possible this week since there’s room for the unit to punch as high as the 2018 yearly opening level at 0.9744.
Upside on the daily timeframe, nevertheless, is limited due to a daily supply zone seen at 0.9666-0.9589, followed by a nearby daily resistance level at 0.9714. As is evident from the chart, the daily supply managed to cap upside nicely during the later stages of the prior week, but was somewhat restricted by a nearby daily demand base coming in at 0.9526-0.9564. With daily sellers likely weakened within this zone, and weekly price indicating a possible move northbound, the daily resistance at 0.9714 could be brought into the fray.
A brief look at recent dealings on the H4 timeframe highlights a relatively key H4 resistance level at 0.9637, which has managed to cap upside on multiple occasions over the past few weeks. Beyond the current H4 resistance, there is limited wiggle room, with the next H4 resistance stationed at 0.9665 (represents the top edge of the current daily supply).
Potential trading zones:
Intraday, the H4 resistance mentioned above at 0.9637 and nearby 0.96 handle are levels currently in view. We are particularly fond of the convergence point between 0.96 and a H4 trend line support taken from the low 0.9187 (green zone). Should you engage with this area at some point during the week, make sure to monitor the position and reduce risk to breakeven once/if price nears 0.9637. Remember, you would effectively be buying within the walls of a daily supply here and will only be free after a H4 close above H4 resistance mentioned above at 0.9665.
Data points to consider today: US retail sales m/m; US Empire state manufacturing index; FOMC member Bostic also takes to the stage; CHF PPI m/m.
DOW 30:
Weekly gain/loss: +1.79%
Weekly closing price: 24360
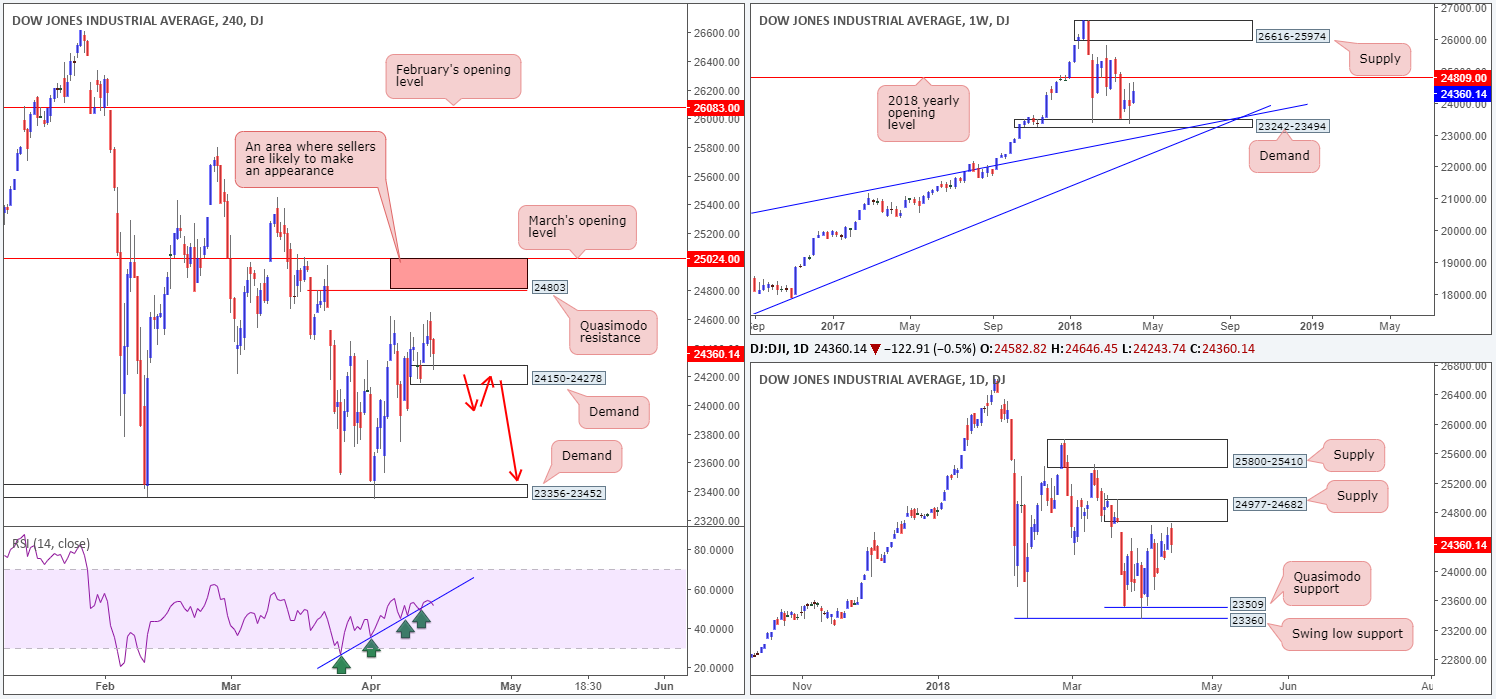
Following the bounce off of weekly demand at 23242-23494 in the shape of a weekly indecision candle, the Dow Jones Industrial Average reached for higher prices last week. If upside remains favored, an approach will likely be seen to the 2018 yearly opening level at 24809.
Lower down on the daily timeframe, however, we can see that the index could face potential resistance earlier than the 2018 yearly opening base. Forming a strong-looking daily bearish engulfing candle on Friday just south of a daily supply zone at 24977-24682, this could dictate a continuation move lower this week, targeting a daily Quasimodo support level at 23509.
Friday’s move lower, as you can see on the H4 timeframe, came about just ahead of a particularly interesting zone at 25024/24803 marked in red. Supportive bids emerged late in the US session after price connected with a small H4 demand base coming in at 24150-24278. A break of this zone has little support in view until we reach another layer of H4 demand baked in at 23356-23452. It might also be worth noting that the H4 RSI trend line suffered a breach on Friday’s selloff.
Potential trading zones:
The area between March’s opening level at 25024 and the H4 Quasimodo resistance at 24803 remains of interest. Not only does the area house the 2018 yearly opening level mentioned above at 24809, it also has connections with the current daily supply zone. For this reason, selling could materialize from 25024/24803 should it come into play this week.
A decisive H4 push beneath the current H4 demand, on the other hand, could open up the possibility for a retest play, targeting the H4 demand mentioned above at 23356-23452 (as per the red arrows).
Data points to consider today: US retail sales m/m; US Empire state manufacturing index; FOMC member Bostic also takes to the stage.
GOLD:
Weekly gain/loss: +0.91%
Weekly closing price: 1345.7
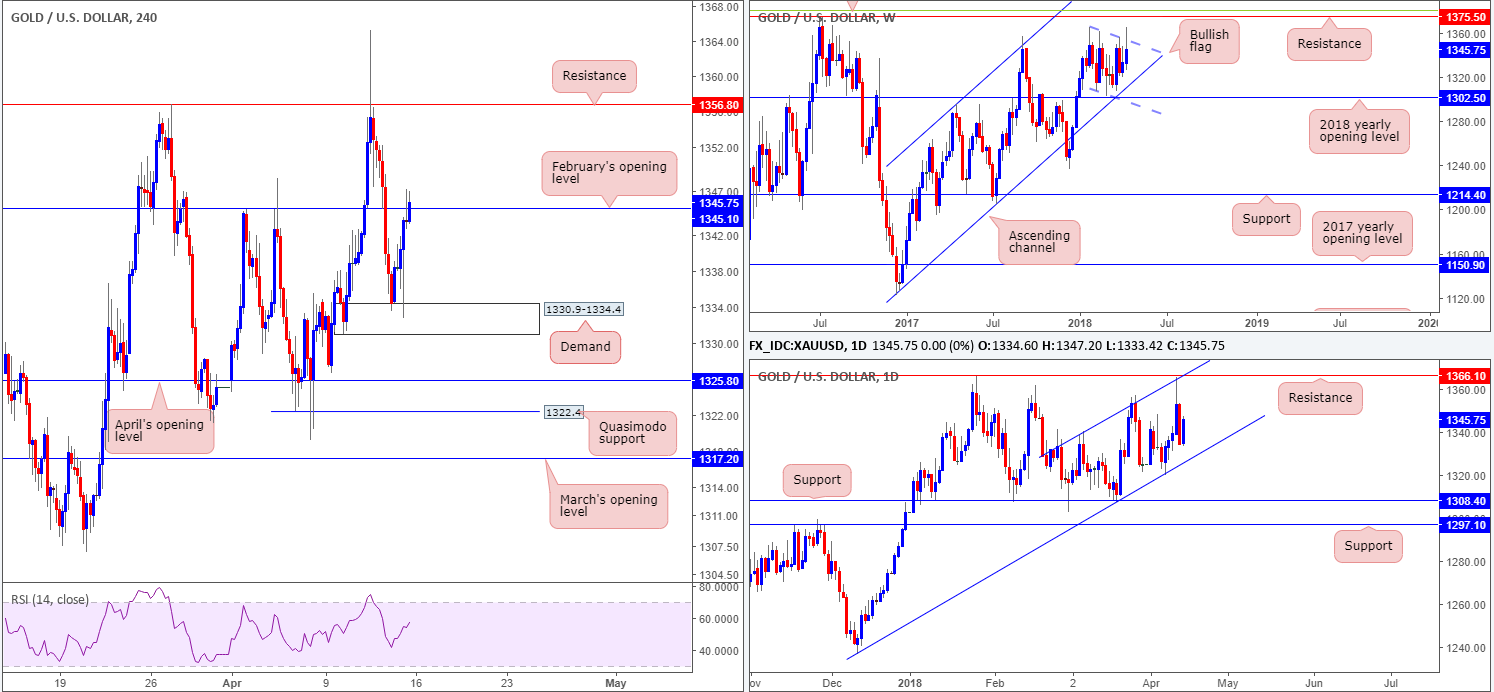
Despite a gain of nearly 1% last week, weekly structure remains unchanged. As you can see, weekly price continues to compress within a bullish flag formation (1366.0/1307.2), positioned just ahead of the 2018 yearly opening level at 1302.5 (fuses closely with a long-term weekly channel support etched from the low 1122.8).
Turning over a page to the daily timeframe, it’s clear to see that the yellow metal has spent over a month compressing within an ascending channel. The channel support is taken from the low 1236.6, while the channel resistance is extended from the high 1340.5. A notable move last week, which we happen to have missed, was a near-test of daily resistance plugged in at 1366.1 that converges with the aforementioned daily channel resistance.
Taking a closer look at things on the H4 chart, however, Friday’s action bounced beautifully off of a H4 demand area drawn from 1330.9-1334.4. Also worthy of note is the week ended marginally closing beyond February’s opening level at 1345.1, potentially opening the doors for a rally up to H4 resistance fixed at 1356.8.
Potential trading zones:
Overall, our bias in this market remains in a northerly direction. The recent breach/fakeout of the weekly bullish flag formation has likely cleared a truckload of sellers out of the market, possibly paving the way north for a visit of weekly resistance at 1375.5. This – coupled with room seen for daily price to push higher within its ascending channel, along with H4 price recently clearing orders out from February’s opening level at 1345.1, we feel further upside is favored.
Keeping it simple, the team has noted to wait for a more decisive H4 move above Feb’s open level. That, followed up with a retest as support in the shape of a full or near-full-bodied H4 bull candle would, in our view, be enough evidence to suggest bullion wants at least the H4 resistance highlighted above at 1356.8.
This site has been designed for informational and educational purposes only and does not constitute an offer to sell nor a solicitation of an offer to buy any products which may be referenced upon the site. The services and information provided through this site are for personal, non-commercial, educational use and display. IC Markets does not provide personal trading advice through this site and does not represent that the products or services discussed are suitable for any trader. Traders are advised not to rely on any information contained in the site in the process of making a fully informed decision.
This site may include market analysis. All ideas, opinions, and/or forecasts, expressed or implied herein, information, charts or examples contained in the lessons, are for informational and educational purposes only and should not be construed as a recommendation to invest, trade, and/or speculate in the markets. Any trades, and/or speculations made in light of the ideas, opinions, and/or forecasts, expressed or implied herein, are committed at your own risk, financial or otherwise.
The use of the site is agreement that the site is for informational and educational purposes only and does not constitute advice in any form in the furtherance of any trade or trading decisions.
The accuracy, completeness and timeliness of the information contained on this site cannot be guaranteed. IC Markets does not warranty, guarantee or make any representations, or assume any liability with regard to financial results based on the use of the information in the site.
News, views, opinions, recommendations and other information obtained from sources outside of www.icmarkets.com.au, used in this site are believed to be reliable, but we cannot guarantee their accuracy or completeness. All such information is subject to change at any time without notice. IC Markets assumes no responsibility for the content of any linked site. The fact that such links may exist does not indicate approval or endorsement of any material contained on any linked site.
IC Markets is not liable for any harm caused by the transmission, through accessing the services or information on this site, of a computer virus, or other computer code or programming device that might be used to access, delete, damage, disable, disrupt or otherwise impede in any manner, the operation of the site or of any user’s software, hardware, data or property.


