A note on lower timeframe confirming price action…
Waiting for lower timeframe confirmation is our main tool to confirm strength within higher timeframe zones, and has really been the key to our trading success. It takes a little time to understand the subtle nuances, however, as each trade is never the same, but once you master the rhythm so to speak, you will be saved from countless unnecessary losing trades. The following is a list of what we look for:
- A break/retest of supply or demand dependent on which way you’re trading.
- A trendline break/retest.
- Buying/selling tails/wicks – essentially we look for a cluster of very obvious spikes off of lower timeframe support and resistance levels within the higher timeframe zone.
- Candlestick patterns. We tend to stick with pin bars and engulfing bars as these have proven to be the most effective.
We search for lower timeframe confirmation between the M15 and H1 timeframes, since most of our higher-timeframe areas begin with the H4. Stops are usually placed 5-10 pips beyond confirming structures.
EUR/USD:
Weekly gain/loss: – 285 pips
Weekly closing price: 1.0853
Weekly opening price: 1.0830
Weekly view: Thanks largely to the US election last week, the shared currency aggressively spiked the underside of a major resistance area coming in at 1.1533-1.1278 and finished the session marginally closing below the yearly opening level at 1.0873. The next downside target is seen close by at 1.0819: a support level that’s positioned nearby a trendline support stretched from the low 0.8231.
Daily view: The daily demand zone at 1.0850-1.0887 was breached during Friday’s session, but managed to end the week closing back within the base of this structure. However, seeing as how the tail came within 11 pips of striking the weekly support level mentioned above at 1.0819, we could possibly see some buying pressure this week.
H4 view: A brief look at recent dealings on the H4 chart shows the pair caught a bid going into the later hours of Friday’s US session from support at 1.0830, following a break of the H4 Quasimodo level at 1.0859. On that note, for those who read Friday’s report you may recall that our desk placed a pending buy order at 1.0860 with a stop set at 1.0845. The order was filled and price quickly made it to our first target (1.09), where, as planned, we took 70% off the table and reduced risk to breakeven plus three pips. Unfortunately our breakeven stop was taken out not too long after, but all in all it was a nice end to the week. Well done to any of our readers who managed to net some green pips here!
Direction for the week: In light of the weekly support at 1.0819 being so close, we feel price may correct to the upside. When and by how far is, of course, problematic to forecast in view of the dollar strength seen last week.
Direction for today: The unit, as you can see, gapped lower this morning and opened at the H4 support 1.0830. The weekend gap will likely be filled in the next few hours, resulting in price possibly touching base with the underside of the H4 Quasimodo line at 1.0859. H4 action is rather restricted, in our opinion. A break above the aforementioned H4 broken Quasimodo line opens the path north to the 1.09 handle – less than forty pips room when you factor in spread and possible slippage. A push below the current H4 support on the other hand, has even less room to maneuver, since not only is the weekly support lurking just below at 1.0819, there’s also the 1.08 handle to consider.
Our suggestions: While the higher-timeframe structure points to a possible correction this week, H4 structure is limited (as explained above in bold). As a result, our team will remain on the sidelines for the time being and reassess going into tomorrow’s open.
Data points to consider: ECB President Draghi speaks at 3pm GMT.

Levels to watch/live orders:
- Buys: Flat (stop loss: N/A).
- Sells: Flat (stop loss: N/A).
GBP/USD:
Weekly gain/loss: + 80 pips
Weekly closing price: 1.2595
Weekly opening price: 1.2567
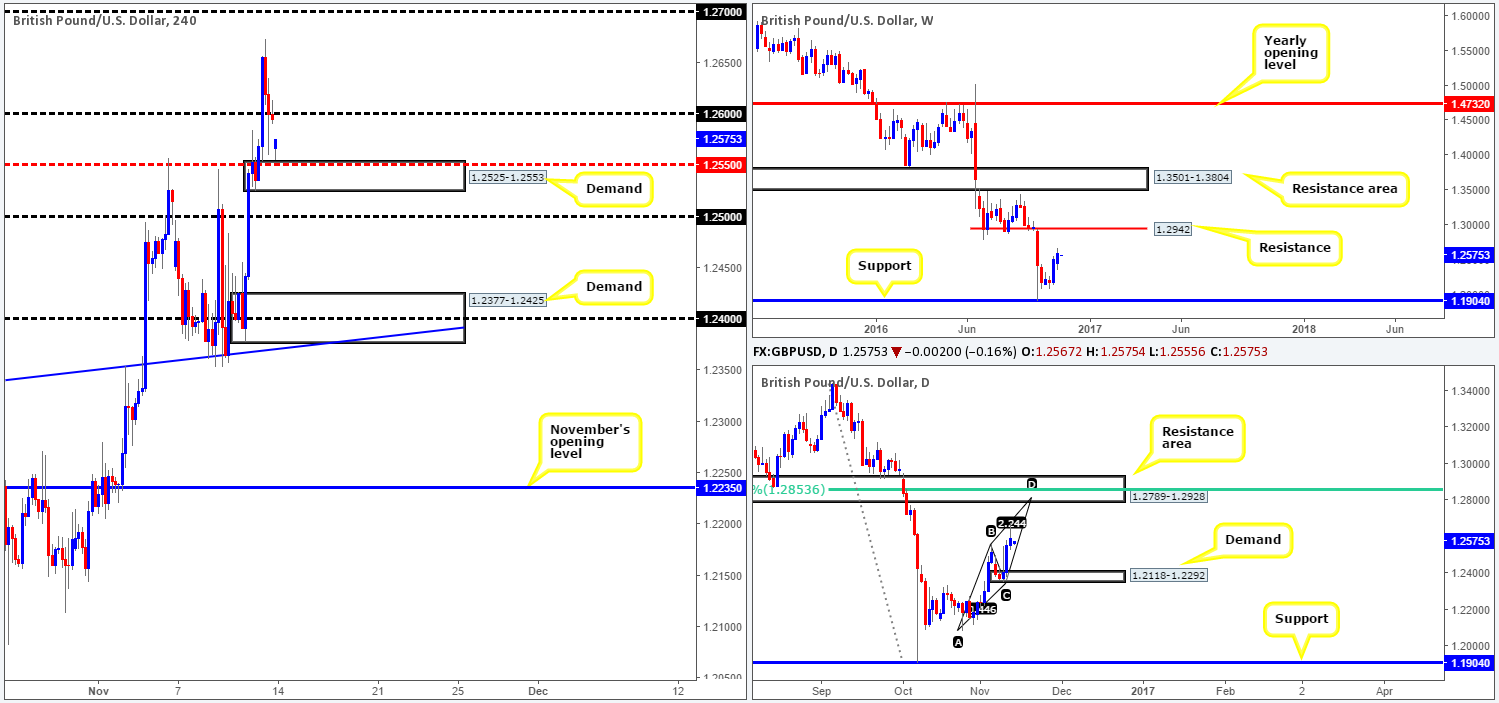
Weekly view: GBP bulls, once again, went on the offensive last week, consequently bringing the pair to highs of 1.2673 by the close. This, as you can see, is the second consecutive weekly gain. Providing the bulls continue to dominate, we might, just might see price connect with the resistance level drawn from 1.2942.
Daily view: In conjunction with the weekly structure, the daily candles look poised to extend north to a resistance area carved from 1.2789-1.2928 (located just below the above mentioned weekly resistance). Additionally, daily action also appears to be in the process of forming the D-leg of an AB=CD bearish pattern which happens to terminate at 1.2812, and is positioned just ahead of a 61.8% Fib resistance at 1.2853 (both housed within the above noted resistance area).
H4 view: During the course of Friday’s sessions, we saw London push the pair higher going into its open, breaking through the 1.26 hurdle and clocking a high of 1.2673. In consequence to this, a nice-looking demand base was formed at 1.2525-1.2553 that converges perfectly with the mid-way support at 1.2550. With this morning’s opening candle gapping around 30 pips lower, price has already came within a cat’s whisker of striking the top edge of this base!
Direction for the week: Ultimately, we believe the unit is heading higher until we reach the above said daily resistance zone.
Direction for today: Knowing that the higher-timeframe structure portends further buying; the team feels a possible ‘buy the dip’ scenario may be at hand today.
Our suggestions: H4 demand at 1.2525-1.2553 is a tempting zone for longs this morning due to what’s been noted on the higher timeframes. With that being said, nevertheless, we would not advise placing pending orders here due to the possibility of a fakeout down to the 1.25 handle. Therefore, waiting for at least a reasonably sized H4 bull candle to form may be the safer route to take here.
Levels to watch/live orders:
- Buys: 1.2525-1.2553 ([reasonably sized H4 bullish close required prior to pulling the trigger] stop loss: ideally beyond the trigger candle).
- Sells: Flat (stop loss: N/A).
AUD/USD:
Weekly gain/loss: – 131 pips
Weekly closing price: 0.7539
Weekly opening price: 0.7544
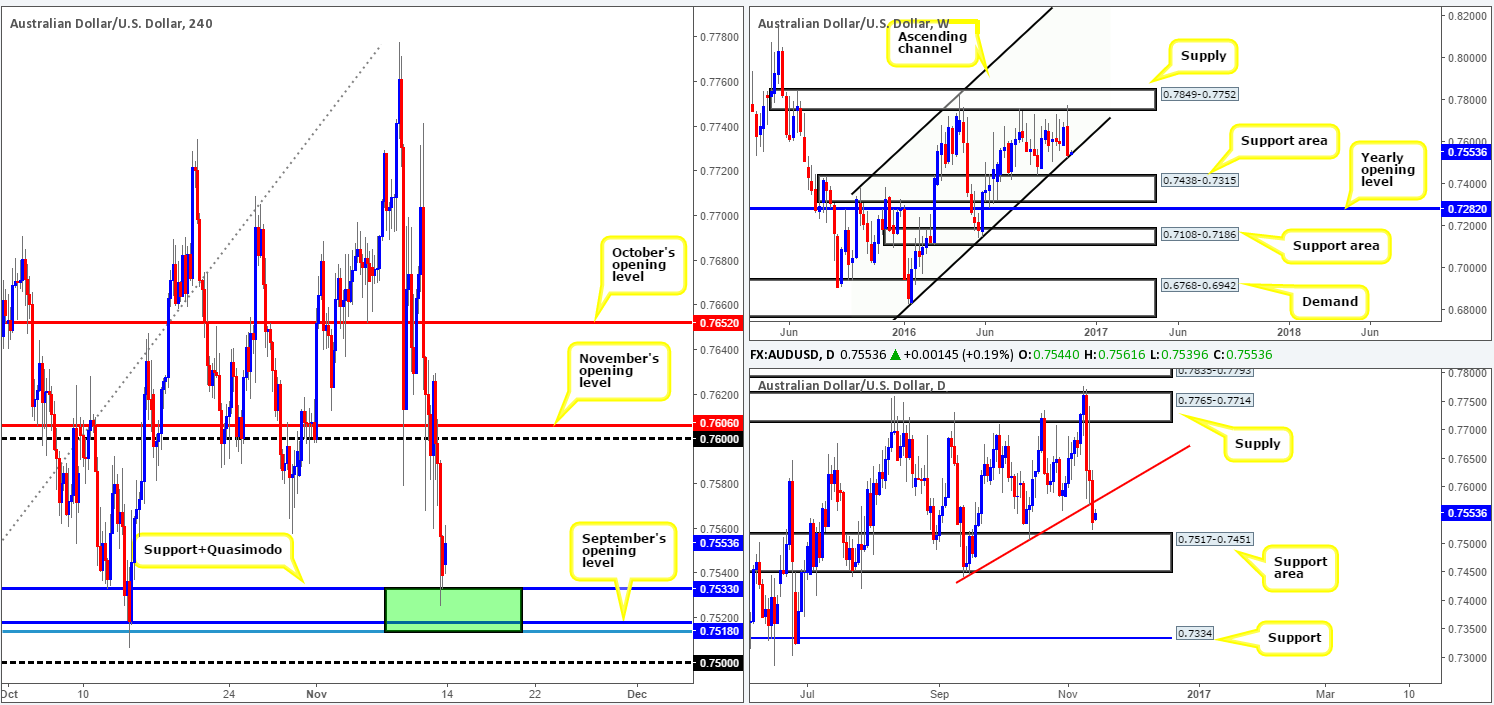
Weekly view: After tapping the underside of supply at 0.7849-0.7752 last week price headed into negative territory, engulfing six prior weekly candle bodies along the way and settling for the week around the channel support line taken from the low 0.6827. Of course, we cannot rule out the possibility of a fake below this barrier to the nearby support area at 0.7438-0.7315 this week, but we feel there’s a good chance of a correction being seen from this point given the line’s history.
Daily view: With Friday’s aggressive bearish candle taking out trendline support from the low 0.7442, we don’t see a whole lot stopping the bears from testing the top edge of a support area at 0.7517-0.7451 that stretches as far back as July 2015 (converges nicely with the aforementioned weekly channel support).
H4 view: Reviewing Friday’s movement on the H4 chart reveals that price jabbed into a particularly interesting buy zone, comprising of a support/Quasimodo at 0.7533, September’s opening level at 0.7518 and a 78.6% Fib support at 0.7513 (green rectangle). Although this morning’s opening candle has responded relatively well to this area, we still feel there is range for either a drive down to shake hands with September’s opening level, or a complete fakeout through this zone down to the 0.75 handle, before serious buyers step in.
Direction for the week: The weekly channel support line coupled with the current daily support area should be sufficient enough to withstand any bearish assaults this week. However, our desk has aired concern regarding the underside of the recently broken daily trendline support which could now potentially act as resistance.
Direction for today: The aforementioned H4 buy zone looks to be in good shape so far, and could see price bid up to the 0.76 region/November’s opening level at 0.7606. Be that as it may, we would not look to buy at current prices! The reason being, as can be seen on the daily chart, is there’s still room seen for the market to stretch lower and connect with the top edge of above said daily support area.
Our suggestions: Keep a very close eye on September’s opening level and the 0.75 handle today. Since both of these levels are housed within the above said daily support area, and bolstered by the weekly channel support line, we feel these levels offer the best prices for longs at the moment.
Levels to watch/live orders:
- Buys: 0.7518 region ([reasonably sized H4 bullish close required prior to pulling the trigger] stop loss: ideally beyond the trigger candle). 0.75 mark ([reasonably sized H4 bullish close required prior to pulling the trigger] stop loss: ideally beyond the trigger candle).
- Sells: Flat (stop loss: N/A).
USD/JPY:
Weekly gain/loss: + 350 pips
Weekly closing price: 106.59
Weekly opening price: 106.88
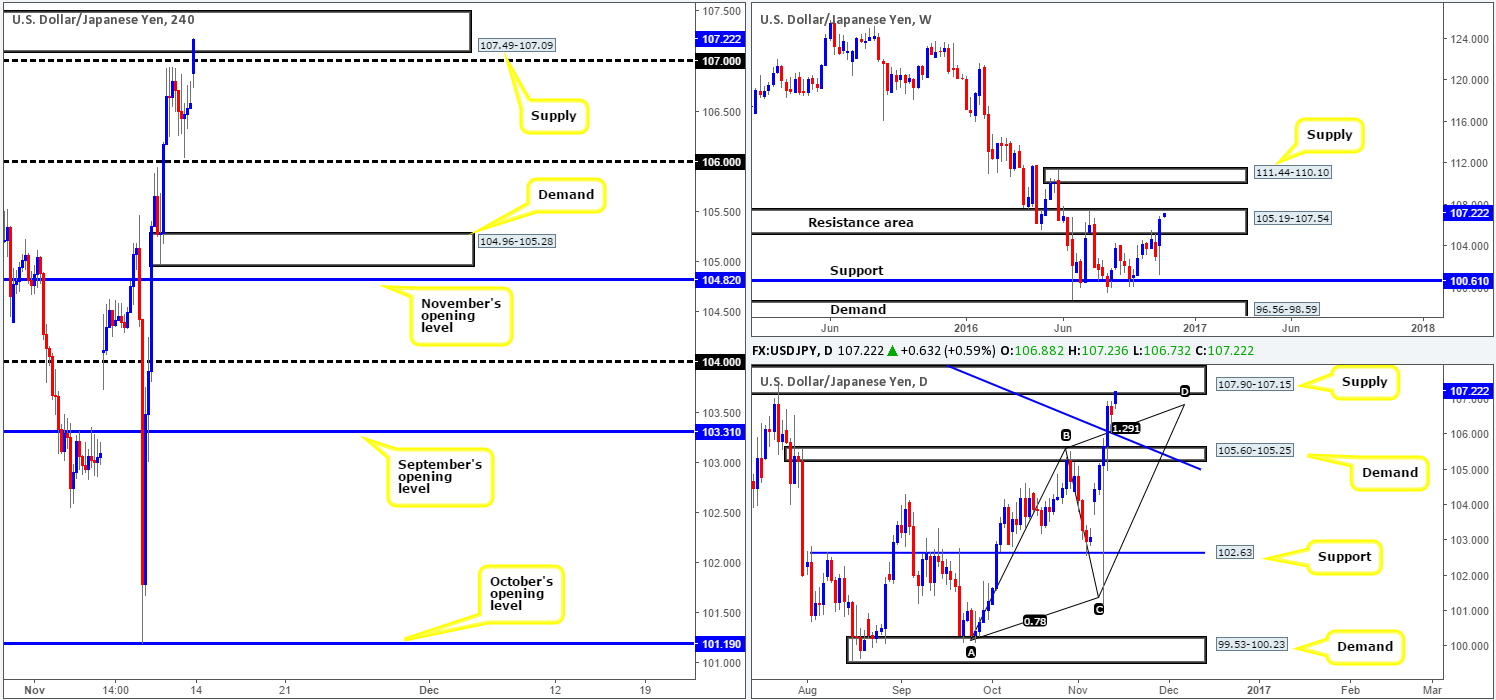
Weekly view: The aftermath of last week’s US election allowed the recently closed weekly candle to form a reasonably large bullish engulfing formation. Before candlestick enthusiasts get too excited, nonetheless, you may want to take into account that the week ended with price closing within the upper edge of a resistance area coming in at 105.19-107.54.
Daily view: In line with weekly structure, daily price also reveals that the market is currently trading at the underside of a supply zone drawn from 107.90-107.15, bolstered by a nearby AB=CD bearish completion point at 106.86. On the other side of the coin, however, daily price broke above a trendline resistance taken from the high 114.44 on Thursday and responded relatively well on Friday’s retest of this boundary, suggesting further buying may be on the cards.
H4 view: Following a near-retest of the 106 handle on Friday, this morning’s action begun with a 30-pip gap north, which has, as you can see, forced price above the 107 handle into supply carved in at 107.49-107.09. Though this supply looks appealing due to it being positioned within the daily supply mentioned above and also located within the extremes of the aforementioned resistance area, we still have to be prepared for a fakeout above this zone to a nearby resistance level coming in at 107.65!
Direction for the week: From a structural perspective, we consider the pair to be trading in overbought conditions. As a result, this could presage a selloff this week.
Direction for today: We do not see price breaching the H4 resistance mentioned above at 107.65 today, and therefore, believe a selloff is more likely back down to around the 106 region.
Our suggestions: Instead of looking to short the current H4 supply area, we’re more drawn to the H4 resistance at 107.65. The reason is that there’s undoubtedly a truckload of stops sitting just above this supply, and these stops, once filled, become buys which are needed to sell! Therefore, we anticipate a fakeout above the current H4 supply area, with the H4 resistance looking like an ideal area to fake into. Now, we would, dependent on time of day, look to short from here at market. Why? Well, mainly due to the higher-timeframe structure, and the fact that the H4 resistance is also a Quasimodo resistance (see June 2016). Moreover, we can comfortably places stops above the apex of this Quasimodo formation at 107.90.
Levels to watch/live orders:
- Buys: Flat (stop loss: N/A).
- Sells: 107.64 ([pending order] stop loss: 107.90).
USD/CAD:
Weekly gain/loss: + 134 pips
Weekly closing price: 1.3533
Weekly opening price: 1.3500
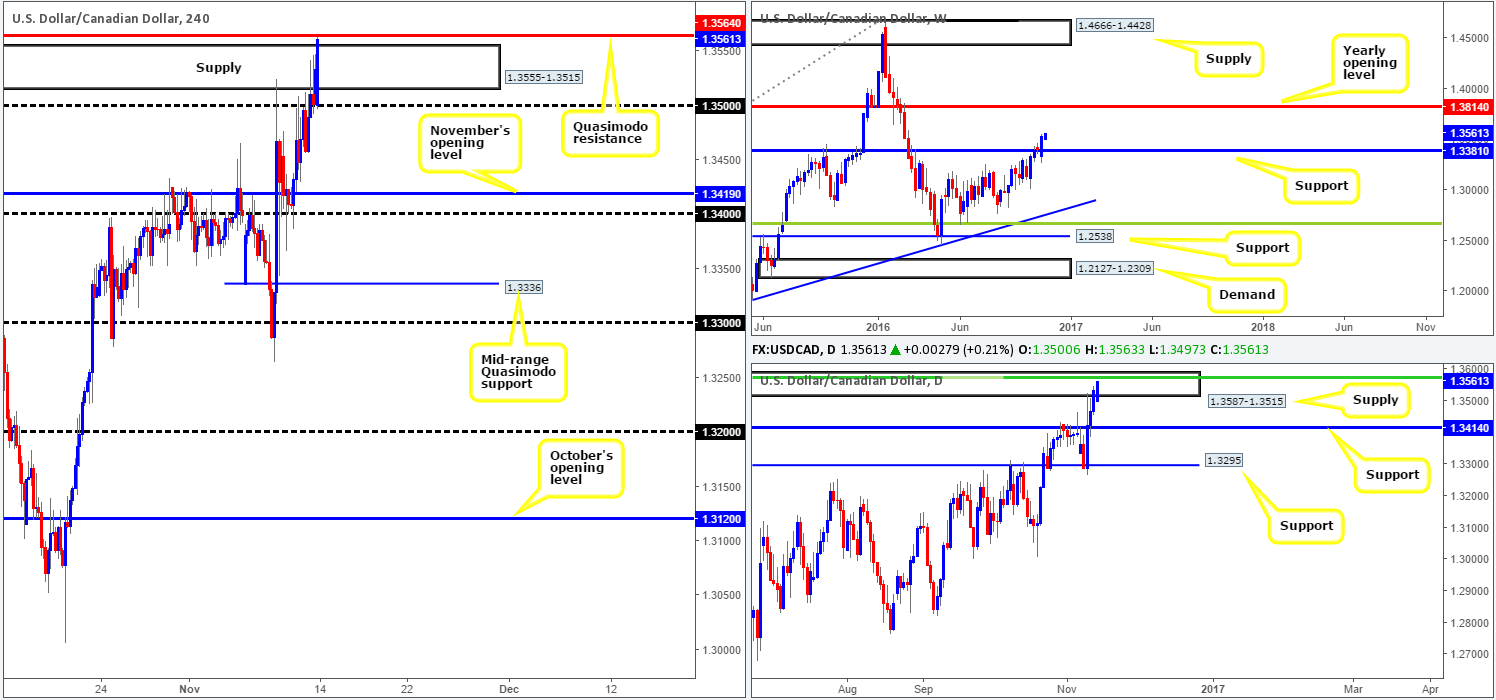
Weekly view: The after-effects of last week’s US election saw price action chalk up a full-bodied bullish engulfing candle, which chewed through resistance at 1.3381 (now acting support barrier). Assuming that the buyers continue to bolster this market, the next upside target to have eyeball on can be seen at the yearly opening level drawn from 1.3814.
Daily view: Before one looks to buy this market, however, there’s a supply zone coming in at 1.3587-1.3515 (fuses with a 50.0% FIB resistance at 1.3570) to overcome. A sustained move above this barrier would likely place supply at 1.3859-1.3765 (molds with a 61.8% FIB resistance at 1.3832) on the hit list. What's more, the aforementioned yearly opening also sits right in the middle of this zone!
H4 view: For those who read Friday’s report you may recall that our desk highlighted the H4 Quasimodo resistance level at 1.3564 as a nice level for shorts. Stop-loss orders taken from 1.35 and the H4 supply 1.3555-1.3515 would, in our opinion, provide sufficient liquidity for the big players to sell into. And, let’s also not forget that this level is located beautifully within the upper extremes of the daily supply!
As can be seen from the chart, the week opened 30-pips lower consequently placing the H4 candles at 1.35, which, in recent hours, sent the pair above the current H4 supply and is now seen within striking distance of the aforementioned H4 Quasimodo resistance level.
Direction for the week: Medium-term direction is a tricky one. On the one hand the weekly bulls look set to extend higher, while the daily bears are stuck trading within supply (see above)! Therefore, higher-timeframe movement is somewhat restricted for the time being.
Direction for today: In light of how close the market is to testing the aforementioned H4 Quasimodo resistance, we feel a BOUNCE from here is likely. However, seeing as our desk has already set a pending sell order on the USD/JPY, we may look to pass on this trade. For those who remain interested in the USD/CAD outlook, we’d recommend placing stops above the H4 Quasimodo formation apex at 1.3590.
Our suggestions: Look to sell at the current H4 Quasimodo formation, targeting 1.35 as your immediate take-profit target.
Levels to watch/live orders:
- Buys: Flat (stop loss: N/A).
- Sells: 1.3564 region ([dependent on the time of day, a market order from here is valid] stop loss: 1.3590).
USD/CHF:
Weekly gain/loss: + 192 pips
Weekly closing price: 0.9871
Weekly opening price: 0.9889
Weekly view: With last week’s action ranging close to 350 pips, we saw weekly price shake hands with support at 0.9581, and end the week closing just ahead of a supply zone coming in at 1.0092-0.9928 (houses the yearly opening level at 1.0004). However, shortly after the markets opened this morning, the bulls dug in deep and managed to connect with the underside of the aforementioned supply area, which has managed to cap upside since May 2016.
Daily view: From this viewpoint, the week concluded with Friday’s session printing an indecision candle amid a trendline resistance stretched from the high 1.0328 and a support level penciled in at 0.9841. Despite this, this morning’s opening candle has, as you can see, pushed through offers around the trendline resistance and connected beautifully with supply coming in at 0.9956-0.9921 (glued to the underside of the above said weekly supply).
H4 view: In light of this morning’s opening gap, our team’s attention is now focused on the 0.9950 range that blends nicely with the 88.6% FIB resistance at 0.9947. If one looks a little deeper into the action, nevertheless, you’ll see that H4 price (0.9950 region) is held by a supply marked with a blue arrow at 0.9958-0.9949.
Direction for the week: There’s a very good chance that the unit will see a pullback from the underside of the current weekly supply zone this week, potentially pushing price back down to daily support mentioned above at 0.9841.
Direction for today: All things considered, the team believes that the Swissy is ready to punch lower. Nevertheless, what they’ve also noted is that there’s a possibility price action may tag in offers around the 0.9950 region before turning red. The next downside target from 0.9950 is the 0.99 handle/November’s opening level at 0.9892.
Our suggestions: Keep a very close tab on the 0.9950 region today. In view of this number positioned within the extremes of the current daily supply zone, as well as lodged within the current weekly supply, 0.9950 is most certainly a high-probability turning point to consider placing in your watchlists.

Levels to watch/live orders:
- Buys: Flat (stop loss: N/A).
- Sells: 0.9950 region ([H4 bearish close required prior to pulling the trigger] stop loss: ideally beyond the trigger candle).
DOW 30:
Weekly gain/loss: + 957 points
Weekly closing price: 18841
Weekly opening price: 18841
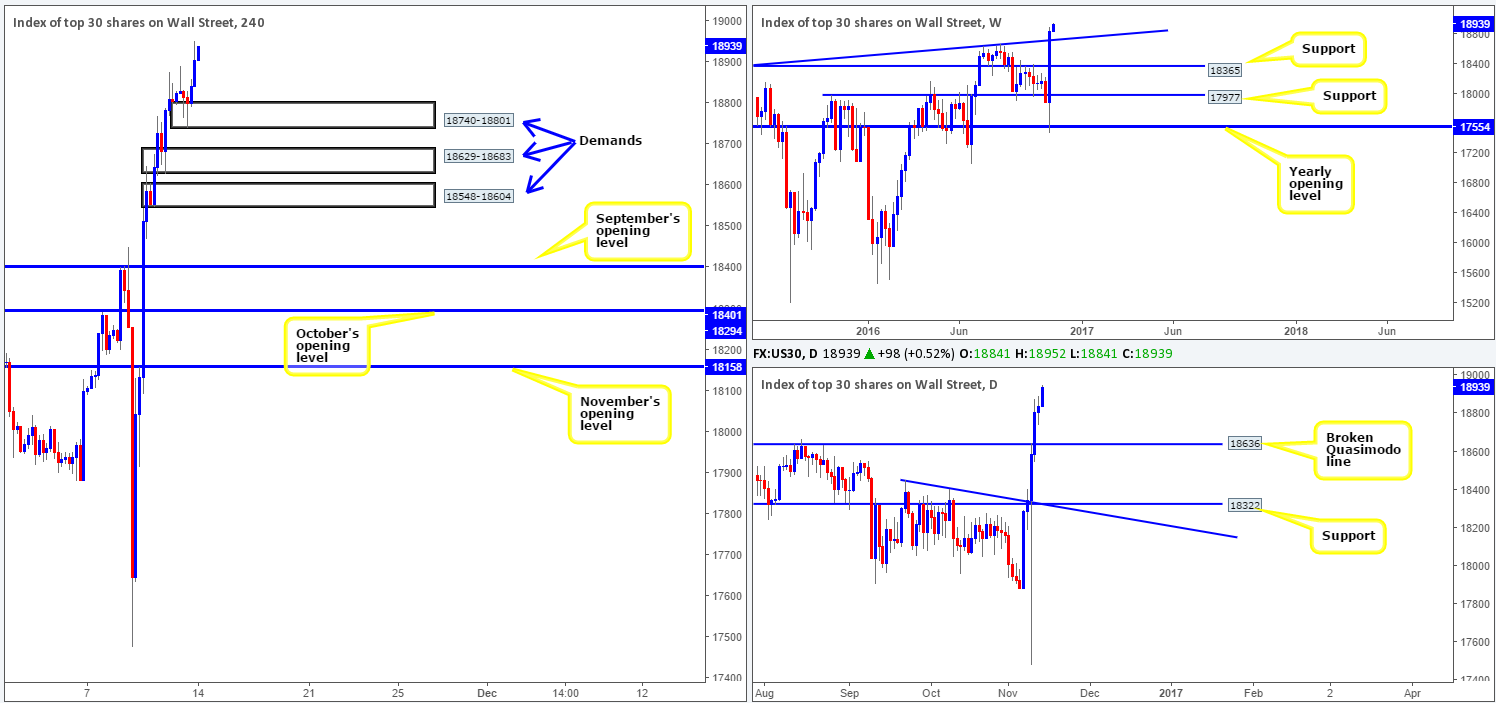
Weekly view: During the course of last week’s session, US equities tapped the yearly opening level at 17554 and ended the week closing over 950 points in the green! Impacted largely by Trump’s presidential win over Clinton, the index closed the week out above a trendline resistance drawn from the high 18365 and clocked fresh highs of 18891. As far as we can see, there is very little stopping the unit from stretching higher this week. Should we encounter a pullback, nonetheless, the first port of call will be the recently broken trendline resistance, now acting support.
Daily view: Technically speaking, there’s very little difference between the weekly and daily chart. Perhaps the most compelling factor is that should price pullback this week, the next downside target on this scale falls in at 18636: a broken Quasimodo line.
H4 view: In our opinion, the overall tone remains biased to the upside. And with that in mind, we have three noted areas of interest this morning. The first, the lowest of the three, comes in at 18548-18604: a H4 demand which was formed following the break of the daily Quasimodo resistance level at 18636. The second, the middle of the three is seen at 18629-18683: a H4 demand base that intersects beautifully with the aforementioned weekly trendline support, boosting its appeal for longs. And the third area drawn from 18740-18801, which, again, is a H4 demand barrier, unfortunately has little higher-timeframe significance so is, in our book, liable to be faked should price reach this low.
Direction for the week: We see absolutely very little standing in the way of a further push to the upside this week.
Direction for today: Our desk is anticipating a pullback in price to either of the above said H4 demand areas. Granted, this may not come to fruition today, but when/if it does, it’s best to be prepared!
Our suggestions: The two lower H4 demands are stable enough zones to consider entering at market given their connection with the higher timeframes. The upper area, while it has no connection to the bigger picture, could still react. However, we’d advise waiting for at least a H4 bullish close to form prior to pulling the trigger here to avoid the possibility of getting caught on any fakeout.
Levels to watch/live orders:
- Buys: 18740-18801 ([reasonably sized H4 bullish close required prior to pulling the trigger] stop loss: ideally beyond the trigger candle). 18629-18683 ([a possible area to consider entering at market from] stop loss: 18618). 18548-18604 ([a possible area to consider entering at market from] stop loss: 18537).
- Sells: Flat (stop loss: N/A).
GOLD:
Weekly gain/loss: – $78
Weekly closing price: 1226.2
Weekly opening price: 1226.2
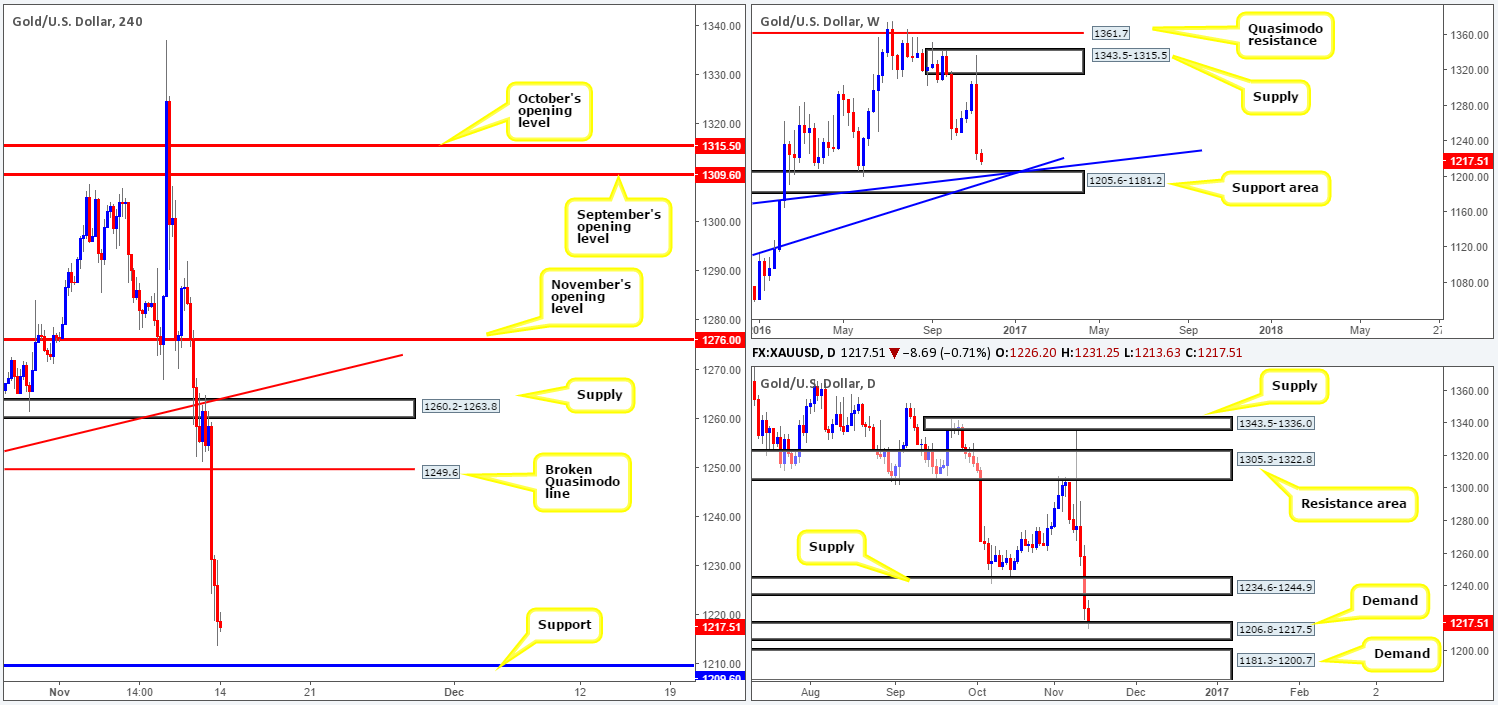
Weekly view: Following a somewhat aggressive move north up to supply drawn from 1343.5-1315.5, the yellow metal went on to take an incredible beating as investors dumped the safe-haven metal in favor of riskier assets such as equities. With the US dollar continuing to strengthen, gold maintains a bearish stance. From a technical standpoint, however, there’s a support area seen nearby at 1205.6-1181.2, which not only stretches as far back as mid-June 2015, but also happens to coincide with two trendline supports (1130.1/1071.2).
Daily view: The story on the daily chart shows that price smashed through demand at 1234.6-1244.9 (now acting supply) on Friday, and is currently seen touching gloves with demand formed from 1206.8-1217.5 (sits directly above another demand seen at 1181.3-1200.7).
H4 view: For those who read Friday’s report you may recall our desk highlighting the possibility of a selloff from supply at 1260.2-1263.8 (bolstered by a trendline resistance extended from the low 1241.2). Unfortunately, we were unable to pin down a lower timeframe setup to sell from here. Well done to any of our readers who did though! At time of writing, we can see that the H4 candles are lurking just ahead of a support barrier coming in at 1209.6, followed closely by another H4 support registered at 1201.2.
Direction for the week: Despite the daily candles teasing the top edge of demand at 1206.8-1217.5, we feel further downside is on the cards to daily demand at 1181.3-1200.7. The reason as to why why simply comes down to the weekly chart showing room to drive south down to the weekly support area at 1205.6-1181.2 which is located below the current daily demand.
Direction for today: Between 1200.7 (the top edge of the daily demand mentioned above) and the current H4 support 1209.6 is, at least in our opinion, a reasonably nice-looking buy zone. It is certainly somewhere we anticipate a bullish presence since it is associated with the current weekly support area!
Our suggestions: Put simply, watch for a reasonably sized H4 bullish candle to take shape between 1200.7/1209.6. Should this come to fruition, we would, dependent on the time of day, look to enter long with stops ideally placed beyond the trigger candle.
Levels to watch/live orders:
- Buys: 1200.7/1209.6 ([reasonably sized H4 bullish close required prior to pulling the trigger] stop loss: ideally beyond the trigger candle).
- Sells: Flat (stop loss: N/A).