EUR/USD:
Weekly gain/loss: -0.16%
Weekly closing price: 1.1938
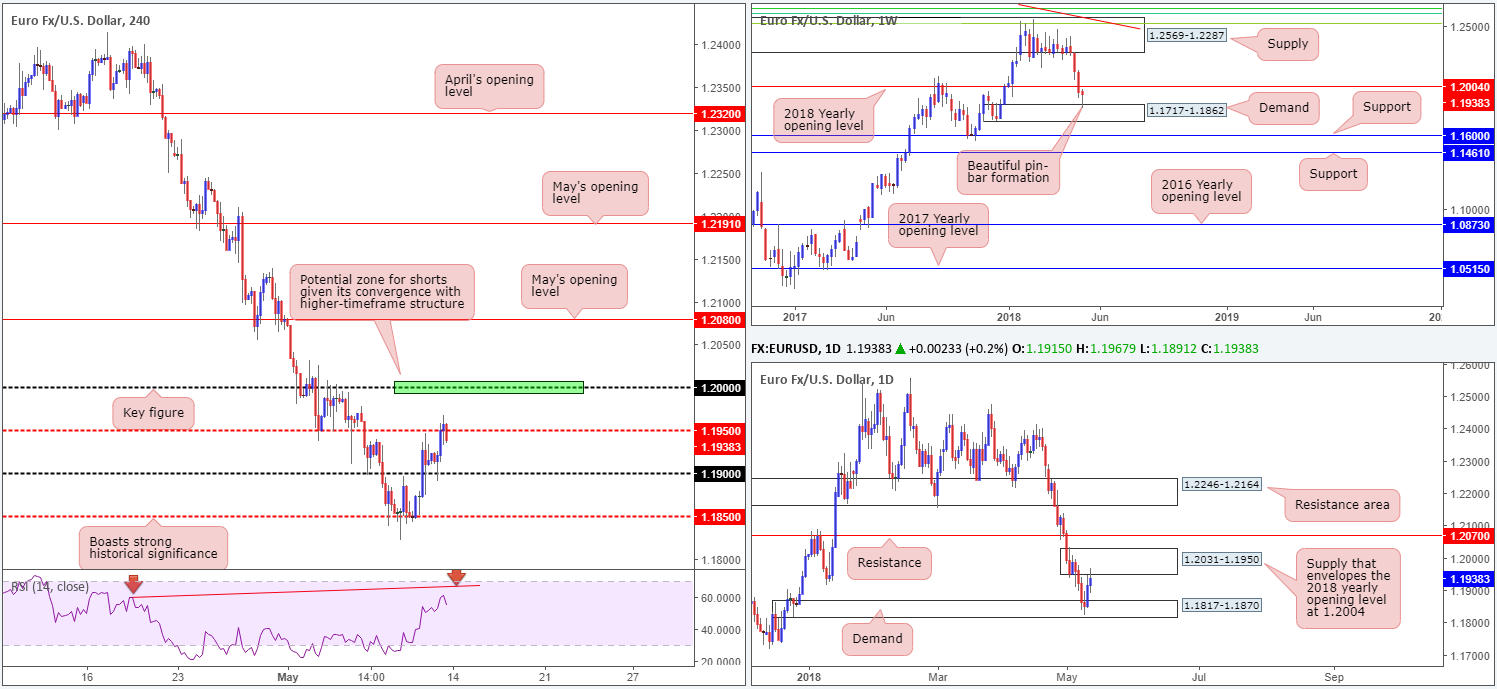
Over the course of last week’s movement, the shared currency dipped to a fresh 2018 yearly low of 1.1822 and crossed paths with strong weekly demand plotted at 1.1717-1.1862. As is evident from the weekly timeframe, the pair responded favorably to the demand and concluded the week almost unchanged in the shape of a weekly bullish pin-bar formation. While this is likely to excite candlestick enthusiasts, the 2018 yearly opening level seen overhead at 1.2004 poses a serious threat to the buyers this week.
The story on the daily timeframe emphasizes the concern of potential resistance forming off of the weekly 2018 yearly opening level. Following a modest recovery off daily demand drawn from 1.1817-1.1870, which happens to be glued to the top surface of the aforementioned weekly demand, the daily candles shook hands with a daily supply area that envelopes the aforesaid weekly open level at 1.2031-1.1950!
A quick recap of Friday’s trade on the H4 scale displays a near-perfect retest off the 1.19 barrier that was fashioned in the form of a H4 bullish pin-bar formation. While this encouraged market buying, the major failed to sustain gains beyond the H4 mid-level resistance at 1.1950 as we entered US hours, consequently ending the week sketching in a near-full-bodied H4 bearish candle.
Potential trading zones:
Although weekly price finished the week in reasonably strong fashion, entering long is challenging as it poses a number of competing themes. For this reason, the focus remains on the key figure positioned above 1.1950 on the H4 timeframe at 1.20 for potential shorting opportunities. Not only is 1.20 a watched number across the board, it’s also seen fixed within the walls of the current daily supply and converges nicely with the 2018 yearly opening level mentioned above on the weekly timeframe. Also worth noting is the H4 RSI offering a potential divergence play off the 1.20 region.
Stop-loss orders, technically speaking, are best placed above the confines of daily supply (1.2031) as this allows the trade room to breathe. As for take-profit targets, the first initial area of concern falls in around the 1.1950 mark, as of current price.
Data points to consider today: FOMC member Mester takes to the stage just ahead of London’s open.
GBP/USD:
Weekly gain/loss: +0.07%
Weekly closing price: 1.3538
The British pound experienced a somewhat muted session last week compared to recent movement. The 2018 yearly opening level seen on the weekly timeframe at 1.3583, as you can see, held ground in the shape of a weekly indecision candle. Both this level and the weekly demand zone seen directly below it at 1.3301-1.3420 communicate strength.
A closer look at price action on the daily timeframe exhibits a tightly confined market between daily demand at 1.3458-1.3534 and daily resistance coming in at 1.3613. With that being said, though, the sellers do seem to have the upper hand here, according to the candlesticks. Note there were multiple upside attempts seen last week but on each occasion the sellers defended with aggression, leaving a trail of daily selling wicks.
The story on the H4 timeframe continues to demonstrate a clear consolidative process between 1.36/1.35 (yellow area). Directly above the area, we can see H4 supply at 1.3665-1.3627, whereas below there’s the H4 mid-level support at 1.3450 in view. What’s also interesting from a technical perspective is that the current H4 range is surrounded by the daily areas mentioned above.
Potential trading zones:
This is a tricky market right now. On the one hand, further buying could materialize off the 2018 yearly opening barrier at 1.3503, which not only represents the lower edge of the current H4 range, it is also placed within daily demand at 1.3458-1.3534. On the other hand, however, we have the daily candles bringing out weakness (as explained above), and a clear downtrend present that could be too much for the buyers to take on!
Despite current structure, this could be an opportunity for range traders to take advantage of the noted H4 consolidation (1.36/1.35). We would strongly advise placing stop-loss orders beyond the surrounding daily zones, though, as this will help avoid any nasty surprises in the form of a fakeout which are all too common around psychological numbers!
Data points to consider today: FOMC member Mester takes to the stage just ahead of London’s open.

AUD/USD:
Weekly gain/loss: -0.01%
Weekly closing price: 0.7541
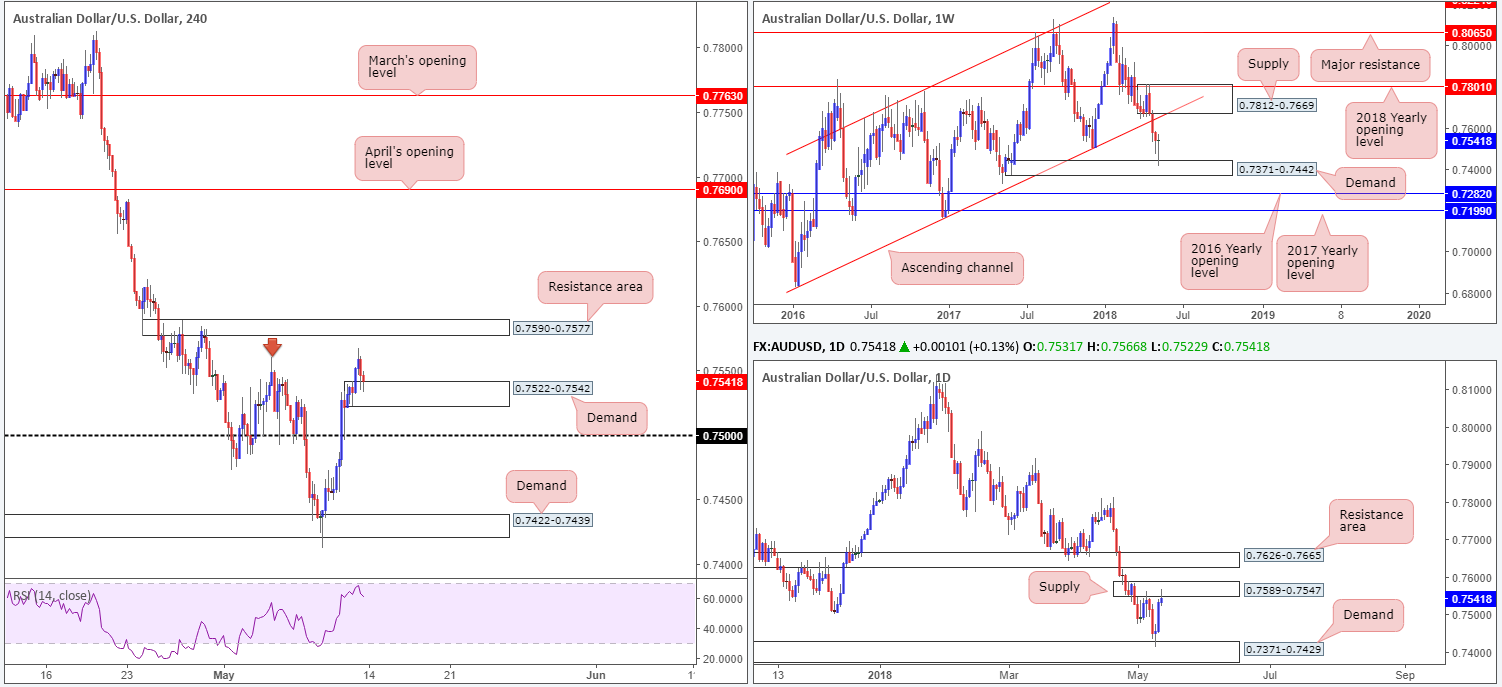
Following a three-week slide, the commodity currency penciled in a strong-looking weekly bullish pin-bar formation last week off the top edge of weekly demand at 0.7371-0.7442. Assuming that the buyers remain authoritative, further buying could materialize and ultimately connect price with weekly supply at 0.7812-0.7669 that intersects with a weekly channel resistance (taken from the low 0.6827).
While the weekly canvas represents a bullish theme, one has to take into account that daily movement recently checked in with a daily supply zone printed at 0.7589-0.7547, and formed a daily bearish pin-bar formation. Should this area give way, the next zone on the hit list falls in at 0.7626-0.7665: a daily resistance zone sited just south of the aforementioned weekly supply.
Casting our lines across to the H4 timeframe, we can see that the candles breached the May 4 high at 0.7560 (red arrow) amid Friday’s US hours and receded lower. The move brought in H4 demand at 0.7522-0.7542, which was effectively the ‘decision point’ to break higher, and held ground into the closing bell. In the event that buyers continue to defend this zone, there’s a healthy chance that the market may climb higher to cross swords with a H4 resistance zone at 0.7590-0.7577, seen planted just south of the 0.76 band.
Potential trading zones:
Overall, we do believe Aussie bulls have more gas left in the tank, despite daily price suggesting otherwise.
Should H4 price chalk up a full or near-full-bodied H4 bull candle off the current H4 demand, an intraday long from here could be considered, targeting the H4 resistance zone mentioned above at 0.7590-0.7577/0.76 handle, followed then by the underside of the daily resistance at 0.7626-0.7665.
Data points to consider today: FOMC member Mester takes to the stage just ahead of London’s open.
USD/JPY:
Weekly gain/loss: +0.26%
Weekly closing price: 109.35
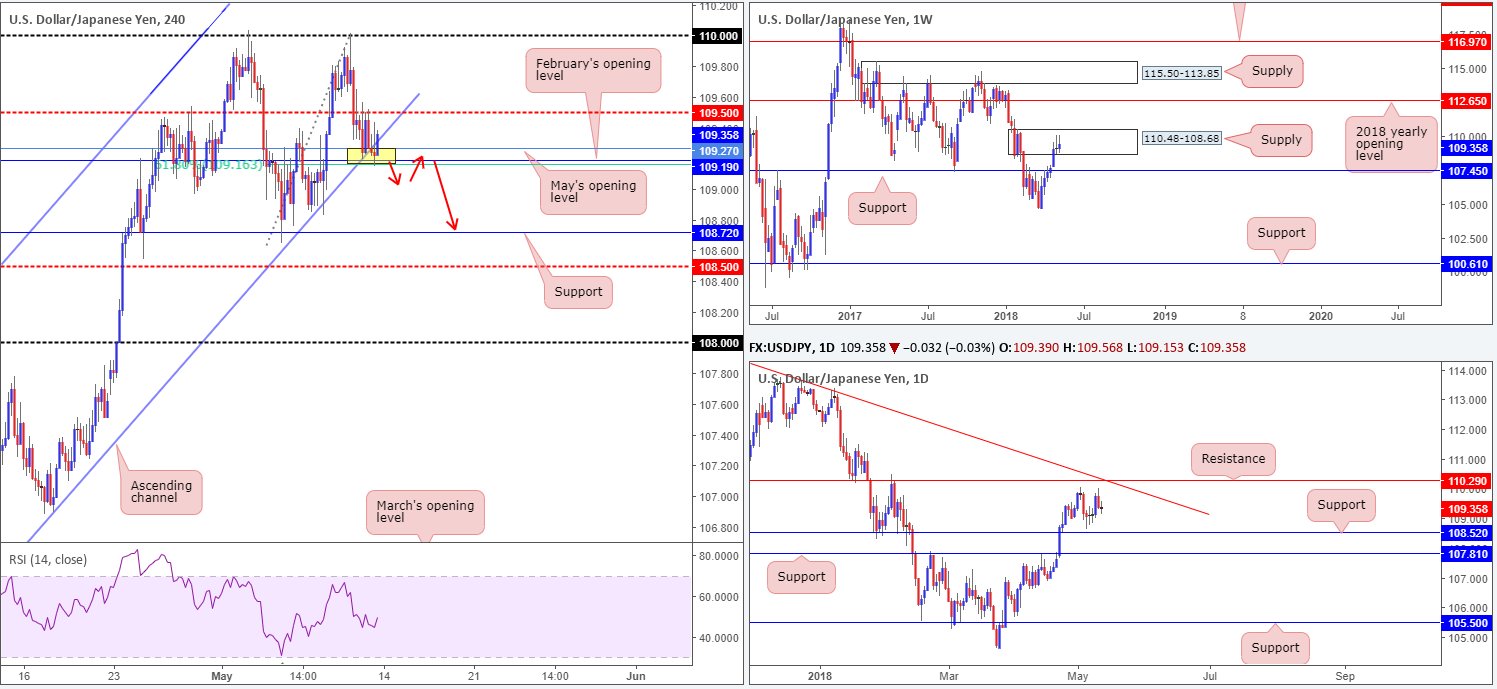
Once again, we observed weekly price attempting to journey north into the bounds of a weekly supply zone at 110.48-108.68 last week. Despite a stellar effort, the pair concluded the week penciling in another weekly selling wick, also known as a bearish pin-bar formation. Assuming this is of interest to the sellers this week, the weekly support level at 107.45 is a likely target. A break higher, however, has the 2018 yearly opening level at 112.65 in view.
Turning the focus down to the daily timeframe, the market appears to be loitering in no man’s land between daily resistance located at 110.29, which happens to converge beautifully with a daily trend line resistance taken from the high 114.73, and a daily support seen at 108.52. Traders may also want to note that the aforementioned daily resistance level is situated within the upper limit of the noted weekly supply zone!
For those who read Friday’s report you may recall the team highlighting 109.16/109.27 (yellow zone) as a reasonable buy zone on the H4 timeframe. The motivation behind this simply came down to the following confluence:
- 109.19/109.27: February and May’s opening levels.
- H4 channel support extended from the low 104.62.
- 61.8% H4 Fib support value at 109.16.
As you can see, the market showed interest here, and held into the close, but did not really print anything meaningful to the upside as it found strong selling around the H4 mid-level resistance point at 109.50.
Potential trading zones:
Having seen 109.16/109.27 remain in the fight and print a near-full-bodied H4 bull candle going into the day’s close, this could be enough to entice buyers into the market. However, seeing 109.50 hold prices lower in reasonably strong fashion, along with weekly supply at 110.48-108.68 in motion, this could be a potentially hazardous long right now.
With the above in mind, all eyes will be on the lookout for a decisive H4 close beneath 109.16/109.27. This likely opens downside to H4 support at 108.72, shadowed closely by H4 mid-level support 108.50 which also represents daily support mentioned above at 108.52. A retest to the underside of 109.16/109.27 (as per the red arrows) that holds ground is, therefore, a short worthy of attention, given the surrounding picture.
Data points to consider today: FOMC member Mester takes to the stage just ahead of London’s open.
USD/CAD:
Weekly gain/loss: -0.40%
Weekly closing price: 1.2791
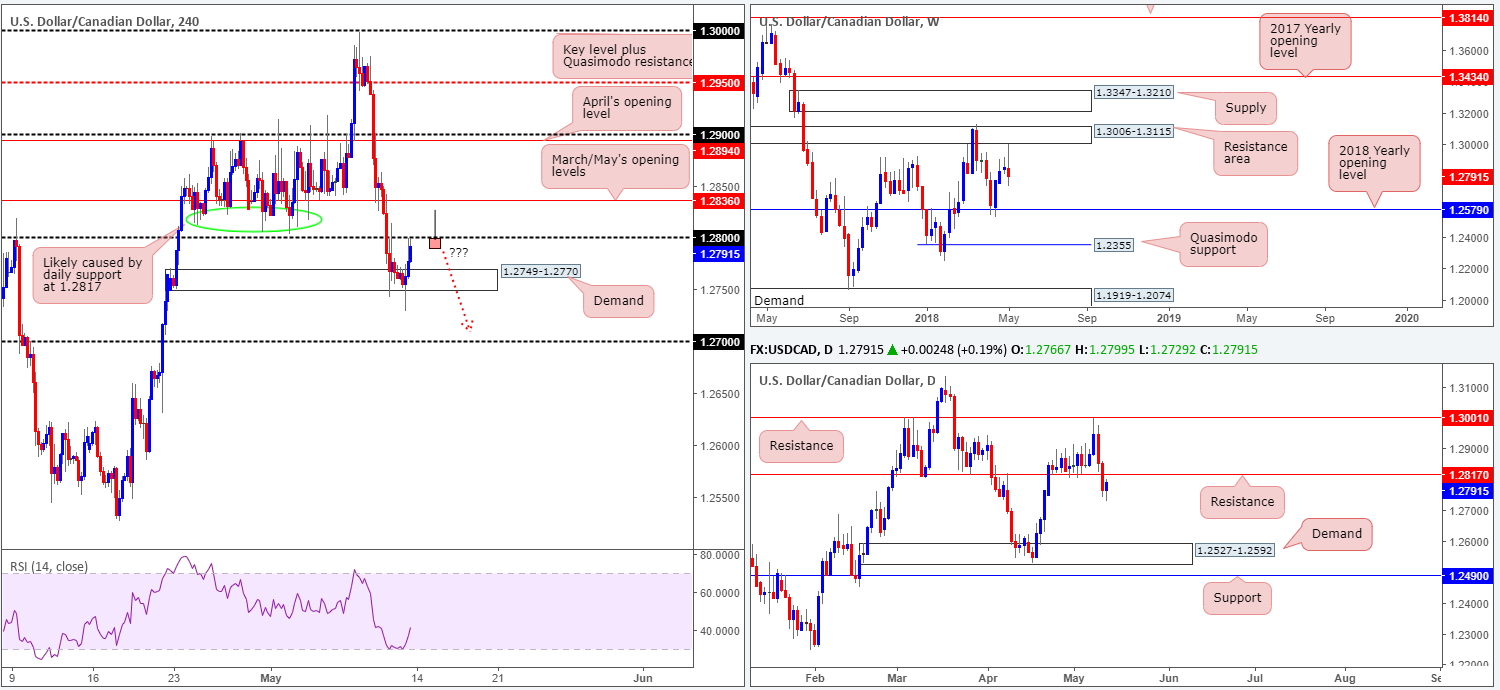
After coming within a few pips reach of a weekly resistance area at 1.3006-1.3115 last week, the US dollar lost ground against its Canadian counterpart. Apart from a mild end-of-week correction, the week ended in bearish territory. Continued selling from this point is certainly plausible, due to the fact that the weekly timeframe shows limited supportive structure in view until reaching the 2018 yearly opening level at 1.2579.
In conjunction with weekly flow, Thursday’s movement obliterated a daily support level at 1.2817 in the shape of a near-full-bodied daily bearish candle. A retest of this level that holds as resistance would help confirm bearish intent on the weekly timeframe, and firmly place 1.2527-1.2592 in the firing range: a daily demand area which also happens to encapsulate the noted 2018 level.
The aftermath of Friday’s Canadian job’s report sent the USD/CAD higher. April’s unemployment rate came in line with expectations, while net change in employment fell below market consensus: -1.1k vs. 17.8k forecasted. H4 demand at 1.2749-1.2770 managed to remain in the fray and eventually saw H4 prices reconnect with the 1.28 boundary into the close.
Potential trading zones:
With buyers likely heavily weakened around the current H4 demand (thanks to a push to lows of 1.2728 on Friday), along with both weekly and daily structure suggesting further downside may be in store, is 1.28 a viable platform to sell? While a selloff from 1.28 could very well be seen, a whipsaw above this number is also just as likely. We say this for two reasons. Firstly, psychological numbers tend to suffer whipsaws to fill stops circulating the area, and secondly we know that a daily resistance is lurking just above it at 1.2817, followed closely by March/May’s opening levels at 1.2836.
In the event a H4 bearish pin-bar formation takes shape that pierces through 1.28 and taps the daily resistance/monthly open levels (as drawn on the chart), a sell trade could be something to consider, targeting 1.27 as the initial take-profit zone. Stop-loss orders are best placed above the wick of the H4 rejection candle.
Data points to consider today: FOMC member Mester takes to the stage just ahead of London’s open.
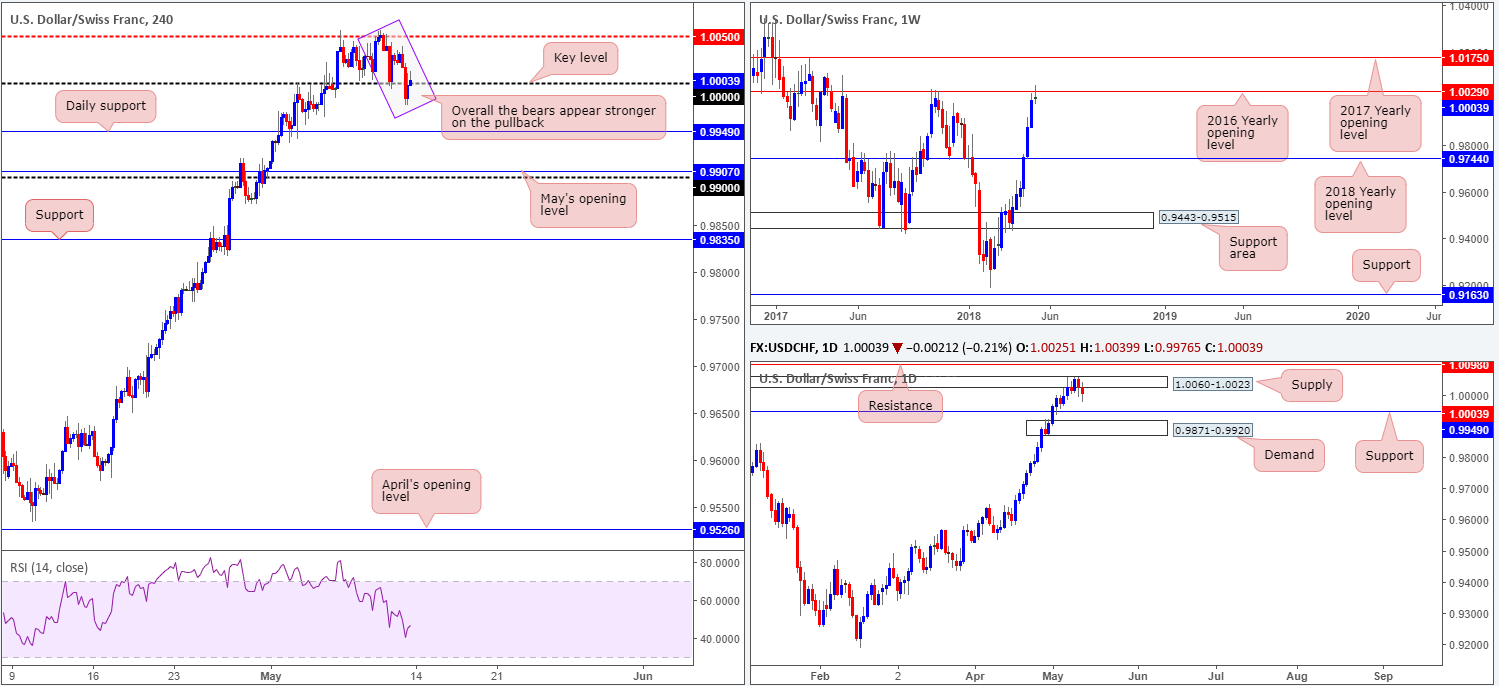
USD/CHF:
Weekly gain/loss: +0.03%
Weekly closing price: 1.0003
As highlighted in our previous weekly report, the 2016 yearly opening level seen on the weekly timeframe at 1.0029 was not a barrier one should overlook (check out the clean rejection formed on October 2017 from this level which dropped price in excess of 800 pips). As you can see, the USD/CHF bumped heads with 1.0029 amid trade last week and closed lower. Given the history surrounding this level and the fact that downside appears relatively unrestricted on the weekly timeframe until the 2018 yearly opening level at 0.9744, further selling is entirely possible.
Daily supply at 1.0060-1.0023, an area which encapsulates the noted 2016 open line, held firmly over the course of recent trade. Credible support on this timeframe is stationed reasonably nearby at 0.9949, followed closely by a daily demand area coming in at 0.9871-0.9920. Until we witness a decisive daily close beneath this demand, it’s going to be difficult to reach the 2018 open line mentioned above on the weekly timeframe at 0.9744.
Parity (1.0000), as you can see, suffered a strong break to the downside amid Friday’s London trade on the H4 timeframe. The move, however, was a short-lived one. Going into the early hours of US trade, the pair bottomed at 0.9976 and marginally reclaimed 1.0000 by the day’s end.
Potential trading zones:
Knowing weekly and daily structure show room for additional downside, as well as weakening support seen emerging from 1.0000 on the H4 chart, buying this market is not considered a high-probability move, in our view. With this in mind, another H4 close seen beneath 1.0000 followed up with a retest as resistance would likely be enough to validate intraday shorting opportunities, targeting daily support mentioned above at 1.0049 as an initial take-profit zone.
Data points to consider today: FOMC member Mester takes to the stage just ahead of London’s open.
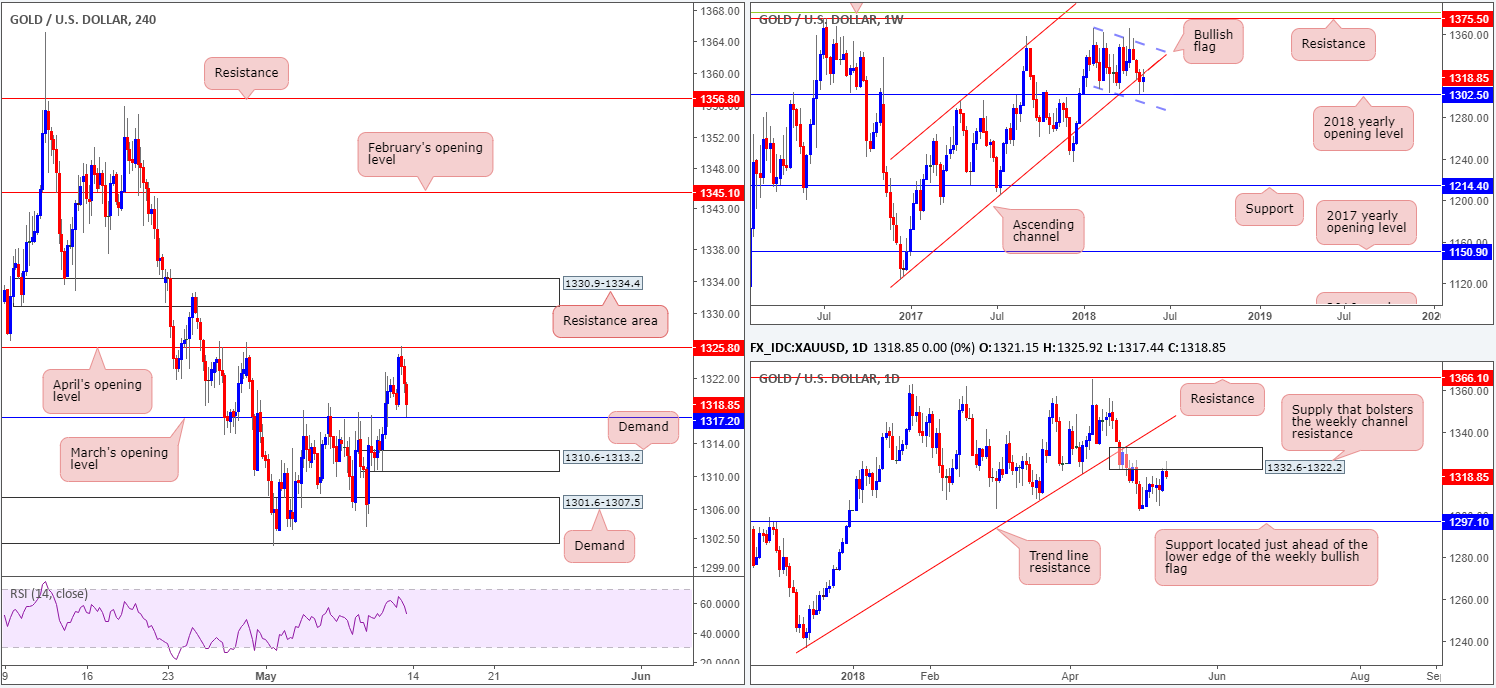
GOLD:
Weekly gain/loss: +0.23%
Weekly closing price: 1318.8
During the course of last week’s session, we witnessed the price of gold recover some lose ground. Following a near to-the-pip reaction off the 2018 yearly opening level seen on the weekly timeframe at 1302.5 the week prior, the yellow metal has since reconnected with the underside of a nearby weekly channel resistance taken from the low 1122.8.
Looking down to the daily timeframe, however, daily supply at 1326.4-1316.7 remains in play. Perhaps the most compelling factor here, though, apart from Friday’s mouthwatering daily bearish pin-bar formation, is that the area adds strength to the current weekly channel resistance.
In Friday’s report, the team underlined April’s opening level at 1325.8 as a potential area to consider shorting. What attracted us to this level was the fact that it fuses closely with the aforementioned weekly channel resistance, and is also positioned within the confines of the noted daily supply. The first take-profit target was achieved going into Friday’s close at 1317.2: March’s opening level on the H4 timeframe, so well done to any of our readers who managed to take advantage here!
Potential trading zones:
Longs from 1317.2 would, in our humble opinion, not be considered high-probability trades. As to why should be obvious: we’re trading from structure on both the weekly and daily timeframes!
A H4 close below March’s opening level would be a welcomed sight to those who are short this market since price will likely follow through and hit H4 demand at 1310.6-1313.2. For those who missed the short call at 1325.8, it is likely going to be a struggle to etch in a short below 1317.2 (assuming we close lower of course) given how close the H4 demand sits.
Therefore, neither a long nor short seems attractive at current pricing.
This site has been designed for informational and educational purposes only and does not constitute an offer to sell nor a solicitation of an offer to buy any products which may be referenced upon the site. The services and information provided through this site are for personal, non-commercial, educational use and display. IC Markets does not provide personal trading advice through this site and does not represent that the products or services discussed are suitable for any trader. Traders are advised not to rely on any information contained in the site in the process of making a fully informed decision.
This site may include market analysis. All ideas, opinions, and/or forecasts, expressed or implied herein, information, charts or examples contained in the lessons, are for informational and educational purposes only and should not be construed as a recommendation to invest, trade, and/or speculate in the markets. Any trades, and/or speculations made in light of the ideas, opinions, and/or forecasts, expressed or implied herein, are committed at your own risk, financial or otherwise.
The use of the site is agreement that the site is for informational and educational purposes only and does not constitute advice in any form in the furtherance of any trade or trading decisions.
The accuracy, completeness and timeliness of the information contained on this site cannot be guaranteed. IC Markets does not warranty, guarantee or make any representations, or assume any liability with regard to financial results based on the use of the information in the site.
News, views, opinions, recommendations and other information obtained from sources outside of www.icmarkets.com.au, used in this site are believed to be reliable, but we cannot guarantee their accuracy or completeness. All such information is subject to change at any time without notice. IC Markets assumes no responsibility for the content of any linked site. The fact that such links may exist does not indicate approval or endorsement of any material contained on any linked site.
IC Markets is not liable for any harm caused by the transmission, through accessing the services or information on this site, of a computer virus, or other computer code or programming device that might be used to access, delete, damage, disable, disrupt or otherwise impede in any manner, the operation of the site or of any user’s software, hardware, data or property.


