A note on lower timeframe confirming price action…
Waiting for lower timeframe confirmation is our main tool to confirm strength within higher timeframe zones, andhas really been the key to our trading success. It takes a little time to understand the subtle nuances, however, as each trade is never the same, but once you master the rhythm so to speak, you will be saved from countless unnecessary losing trades. The following is a list of what we look for:
- A break/retest of supply or demand dependent on which way you’re trading.
- A trendline break/retest.
- Buying/selling tails – essentially we look for a cluster of very obvious spikes off of lower timeframe support and resistance levels within the higher timeframe zone.
- Candlestick patterns. We tend to only stick with pin bars and engulfing bars as these have proven to be the most effective.
For us, lower timeframe confirmation starts on the M15 and finishes up on the H1, since most of our higher timeframe areas begin with the H4.
EUR/USD:
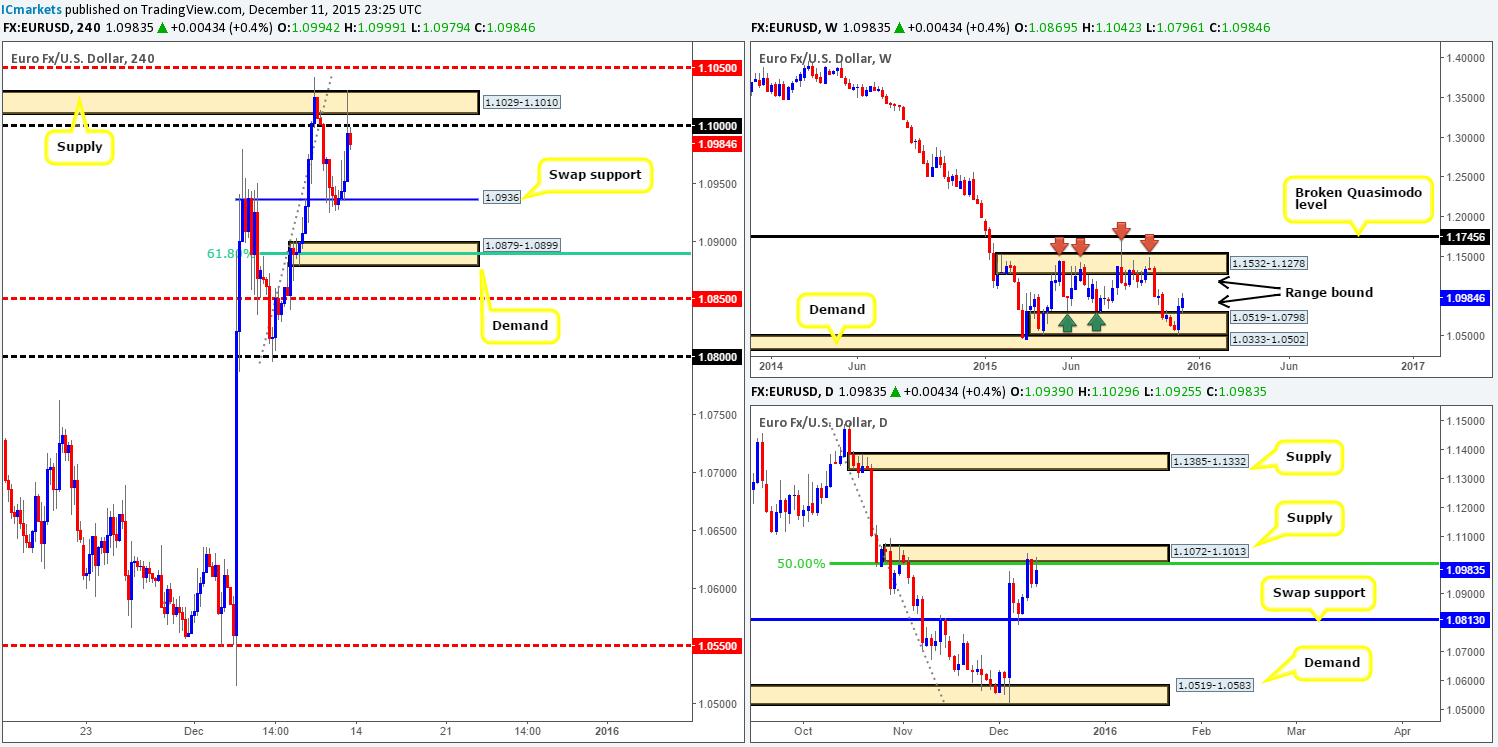
Following a stronger-than-expected rebound from the weekly range demand two weeks ago at 1.0519-1.0798, the single currency continued to appreciate last week, gaining 110 pips by the close 1.0984. In the event that the buyers continue to push this pair higher this week, we might, just might, see the EUR fill this range up to supply coming in at 1.1532-1.1278.
On the other side, however, daily supply at 1.1072-1.1013 and its converging 50.0% Fibonacci level at 1.1011 is proving a troublesome obstacle to overcome. A sustained break above this zone would suggest that this pair may want to plug into offers around supply drawn from 1.1385-1.1332 (hangs within the above said weekly range supply). Conversely, if the sellers continue to put up a fight here, the swap support level seen at 1.0813 may come into play this week.
A quick look at Friday’s trade on the H4 shows us that price was relatively well-bid from the swap support barrier given at 1.0936, pulling the currency up to the large psychological resistance 1.1000/ supply at 1.1029-1.1010 by the day’s end.
Given these points, the buyers clearly have work to do before they can touch base with the upper boundary of the weekly range (see above). And as such, our team has come to a general consensus that buying the EUR medium-term is out of the question unless either a decent break above daily supply is seen, or price connects with the daily swap (support) barrier (see above for levels).
Regarding today, however, we see this market being sold from 1.1000 back down to retest 1.0936, which would certainly be an intraday short we’d consider trading as long as confirming resistance is seen from the lower timeframes. For traders with their eye on the H4 demand zone at 1.0879-1.0899, nevertheless, caution is advised. Admittedly, this is a tempting area due to it converging with the 61.8% Fibonacci level at 1.0890 and psychological support 1.0900 and, as such, will probably bounce this market. However,do bear in mind that price could very easily ignore this zone and head for either the mid-level support just below at 1.0850 or the daily swap support mentioned above, which is our more preferred area to look for longs this week!
Levels to watch/live orders:
- Buys: 1.0879-1.0899 [Tentative – confirmation required] (Stop loss: dependent on where one confirms this area). 1.0813 [Tentative – confirmation required] (Stop loss: dependent on where one confirms this level).
- Sells:1.1000 [Tentative – confirmation required] (Stop loss: dependent on where one confirms this level).
GBP/USD: (Trade update: taken out at breakeven with 50% profits previous locked in).
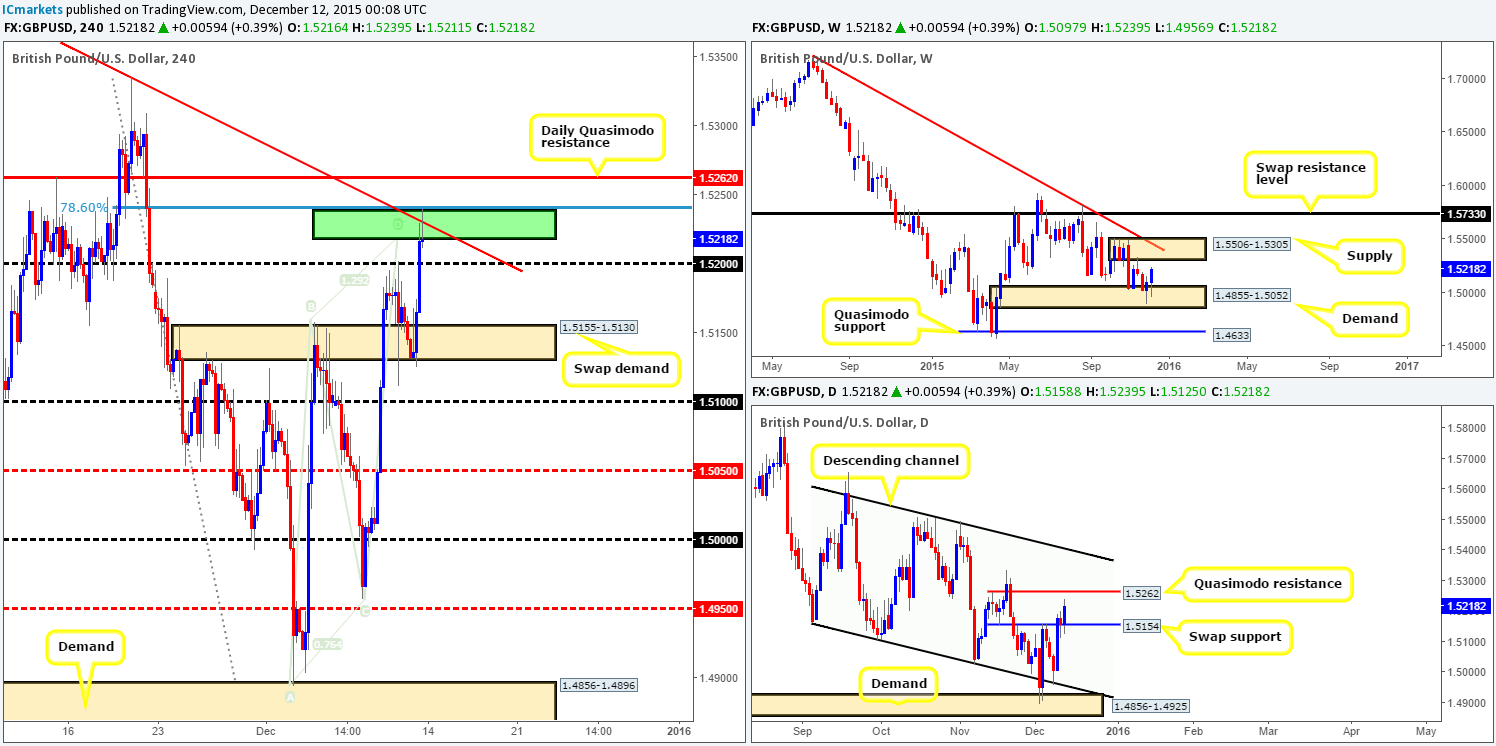
Very much like the EUR/USD, the GBP/USD also reported relatively healthy gains for a second consecutive week. As can be seen from the weekly chart, last week’s 115-pip rally from demand at 1.4855-1.5052 pushed prices in the direction of oncoming supply seen at 1.5506-1.5305 (converges nicely with trendline resistance from the high 1.7190), consequently finishing the week off near its highs at 1.5218.
Turning our attention to the daily timeframe, we can see that following Wednesday’s close above 1.5154, this barrier held beautifully as support for the remainder of the week. The next upside target on our radar can be seen at a Quasimodo resistance level coming in at 1.5262, which is, in our opinion, effectively the last line buyers have to break through before reaching the above said weekly supply. It will be interesting to see what the H4 timeframe has to offer…
Well, from the H4, it’s clear to see that the swap demand base at 1.5155-1.5130 held firm, aggressively pushing Cable up to fresh highs of 1.5239 on the day. Additionally, psychological resistance 1.5200 was taken out and price connected with an AB=CD bear top (1.5218), which converges nicely with trendline resistance (1.5401) and a deep 78.6% Fibonacci level seen at 1.5239.Selling from here (green zone at 1.5218/1.5238) may be inviting due to its converging structures (it certainly was for us last week), but we remain very wary now. Reason being is the aforementioned daily Quasimodo resistance level is positioned just above current price and has ‘fakeout’ written all over it! Therefore, we’re going to pass on selling from this H4 green sell zone, and wait to see if price connects with the daily level before making any further judgment, as this is a key decision-point level for us.
Levels to watch/ live orders:
- Buys: Flat (Stop loss: N/A).
- Sells:Currently watching the 1.5262 level for a possible sell.
AUD/USD:
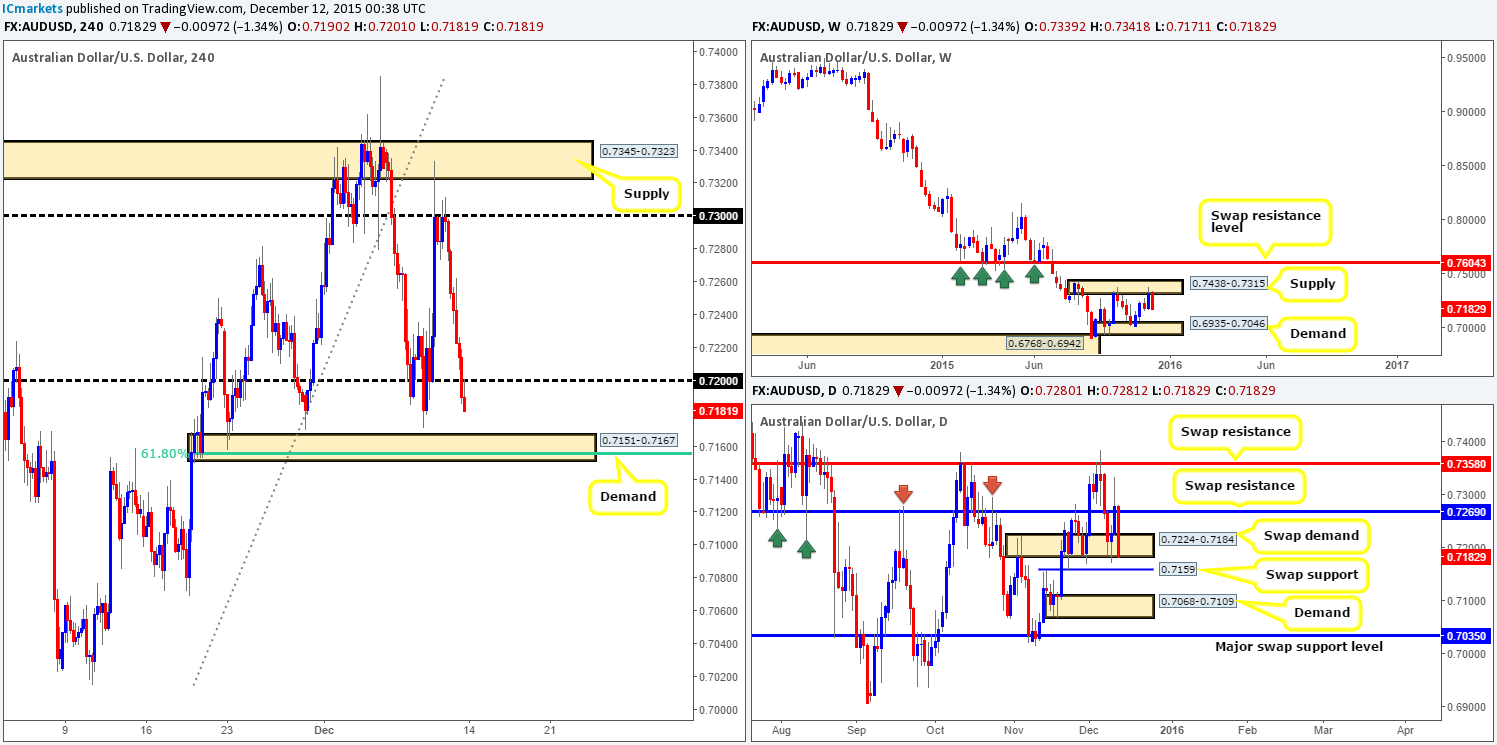
From the weekly chart, we can see that the AUD/USD sold off from supply at 0.7438-0.7315 last week, shredding close to 150 pips off its value, and engulfing any gains recorded the week prior. Seeing as how the weekly candle closed on its lows at 0.7182, this could suggest further selling in this market this week. Therefore, do keep a close eye on demand seen below drawn from 0.6935-0.7046.
Moving down to the daily timeframe, the swap demand base seen at 0.7224-0.7184 came under pressure on Friday ending the week closing at the lower limits of this area. This likely suggests price will attack bids around the swap support hurdle lurking just below this zone at 0.7159 sometime this week. Beyond this level, however, we see little stopping this market driving down to demand coming in at 0.7068-0.7109.
Stepping down one more level to the H4, price closed the week out retesting the 0.7200 figure as resistance. Consequent to this, and the points made above, the sellers will likely continue driving this market lower until demand seen at 0.7151-0.7167. Not only has this demand proved itself once already back on the 23rd November, it also boasts the following confluence:
- Surrounds the daily swap (support) level at 0.7159.
- Encapsulates the 61.8% Fibonacci level at 0.7154.
For us to be permitted entry at this demand, we’d need to see lower timeframe buying confirmation beforehand. Ultimately, if all goes to plan, we’d target 0.7200 first and foremost, but would ideally like to see this level taken out, as there’s plenty of room seen above this number to run north on the H4. Despite this, we mustn’t forget that the Aussie just sold off from weekly supply (see above), so do not expect that price will ride to the moon on this one!
Levels to watch/ live orders:
- Buys: 0.7151-0.7167[Tentative – confirmation required] (Stop loss: dependent on where one confirms this area).
- Sells: Flat (Stop loss: N/A).
USD/JPY:
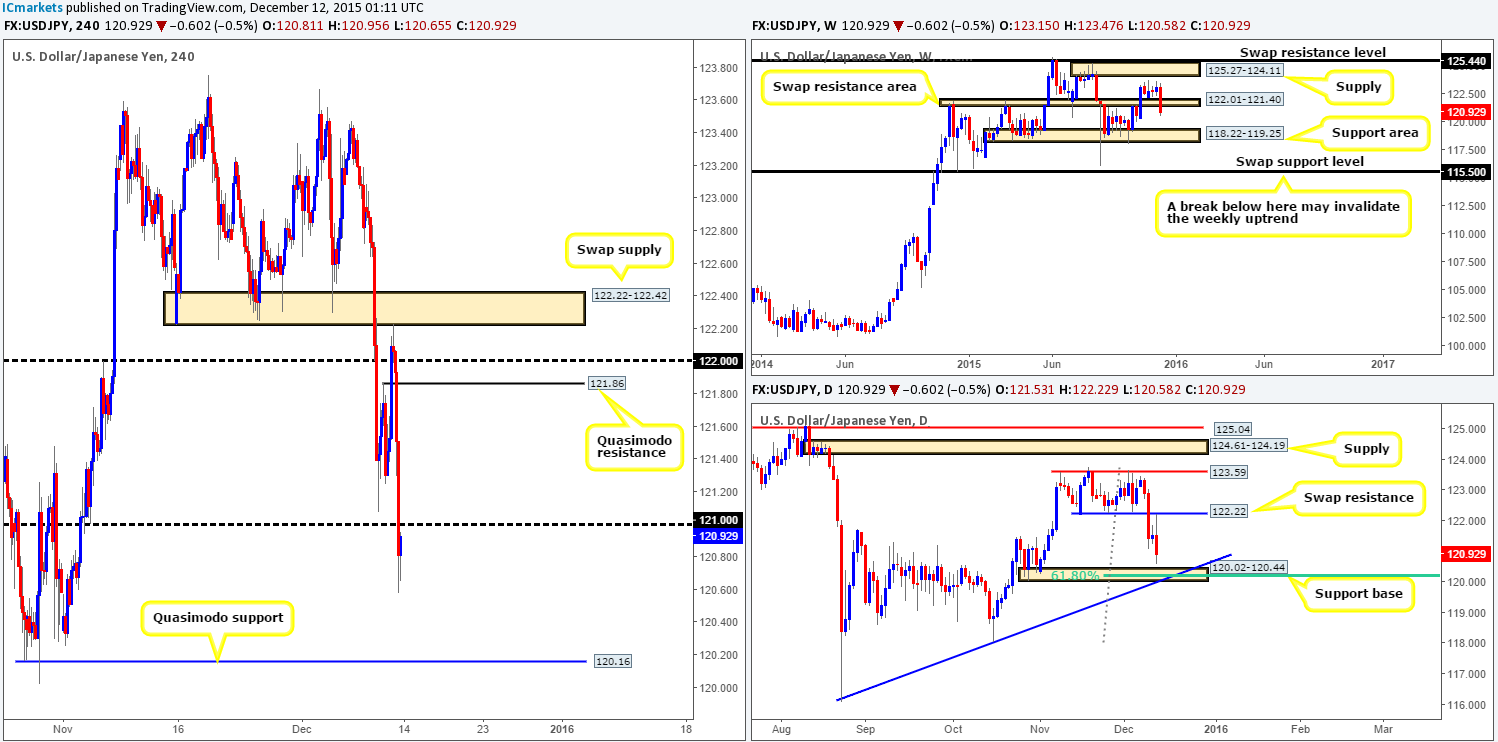
After four weeks of rather monotonous trading, the USD/JPY came alive last week! A 220-pip decline took place consequently slicing through a weekly swap support (now resistance) area at 122.01-121.40, and closing relatively near its lows at 120.92. On the condition that the sellers are able to hold this market lower from here this week, we may see the weekly support area at 118.22-119.25 come into play.
From the daily timeframe, however, price is painting a slightly different picture. Last week’s selling broke through 122.22 (previous range support) on Wednesday, and later on retested this number as resistance during Friday’s trade. This, as you can see, aggressively pushed price lower winding up closing the week just above a daily support base at 120.02-120.44. This area, combined with trendline support taken from the low116.07 and 61.8% Fibonacci level at 120.24, makes this one heck of a buy zone to have on your watch lists this week traders.
Moving down into the pits of the H4, U.S. trade closed the week below psychological support 121.00. Taking into consideration all of the above, we are hoping to see this figure hold as resistance today and push this market lower. The reason for why is simply because we have our beady little eye on the Quasimodo support level seen below at 120.16. This hurdle sits snug within the above said daily support base and looks ripe for a rebound sometime this week.
With this, our team has placed a pending buy order just above this level at 120.18 with stop set below at 119.90. We will be extra cautious regarding profit taking here, and will have little hesitation in closing the full position early, since let’s not forget where the weekly action is currently positioned (see above).
Levels to watch/ live orders:
- Buys: 120.18 [Pending order] (Stop loss: 119.90).
- Sells: Flat (Stop loss: N/A).
USD/CAD:
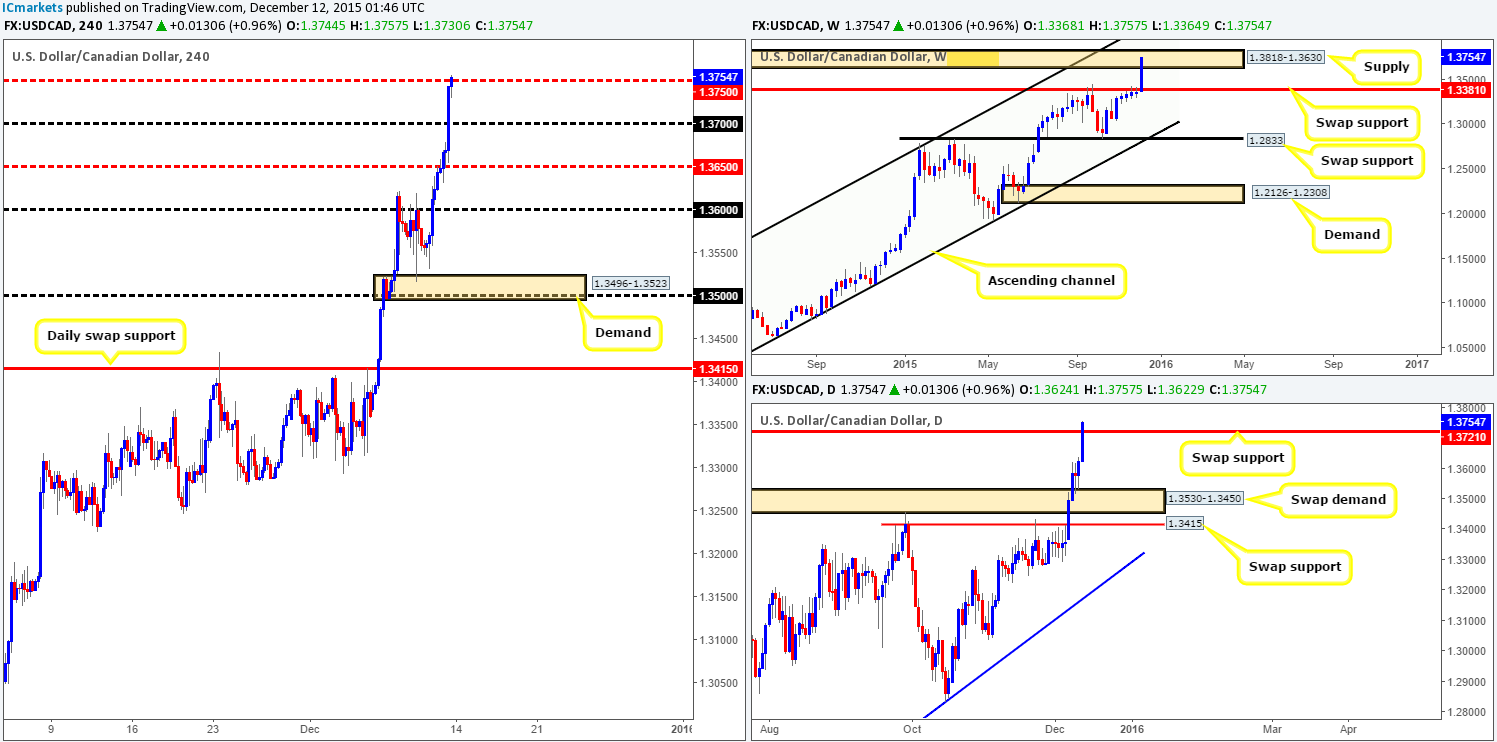
It was another depressing week for the Canadian dollar last week as prices rallied close to a whopping 400 pips into close 1.3754. This upside move took out a weekly swap resistance (now support) level at 1.3381 and drove the Loonie pair high into weekly supply at 1.3818-1.3630.
Rolling a page lower to the daily timeframe, we can see the currency pair rallied most aggressively on Friday, following a beautiful retest off of a swap demand area coming in at 1.3530-1.3450. Friday’s 130-pip advance forced price to close above a swap resistance (now support) level at 1.3721, potentially opening the gates for further buying this week towards extreme supply from mid-2004 at 1.4001-1.3904.
Friday’s H4 action, as you can see from the chart, ended the week poking its head above mid-level resistance 1.3750. Quite frankly, given what we’ve seen recently on the higher timeframe structures and the fact that oil closed in the red at $35.27/barrel, the only logical path for this pair seems to be north! Granted, we cannot ignore the fact that weekly trade is now loitering within supply (see above), but one cannot deny that this weekly area has its work cut out for it if it is to halt this current buying frenzy.
That being the case, our team will continue looking to ‘buy the dips’ into supportive structures on the H4 today and possibly into the week. Seeing as how price closed the week above 1.3750, this could be a nice platform to begin hunting for longs. Although the direction of this market is relatively high probability, fakeouts at support levels are highly likely, so buying this market will only be permitted for us should lower timeframe confirmation be seen.
Levels to watch/ live orders:
- Buys:1.3750[Tentative – confirmation required] (Stop loss: dependent on where one confirms this level).
- Sells: Flat (Stop loss: N/A).
USD/CHF:
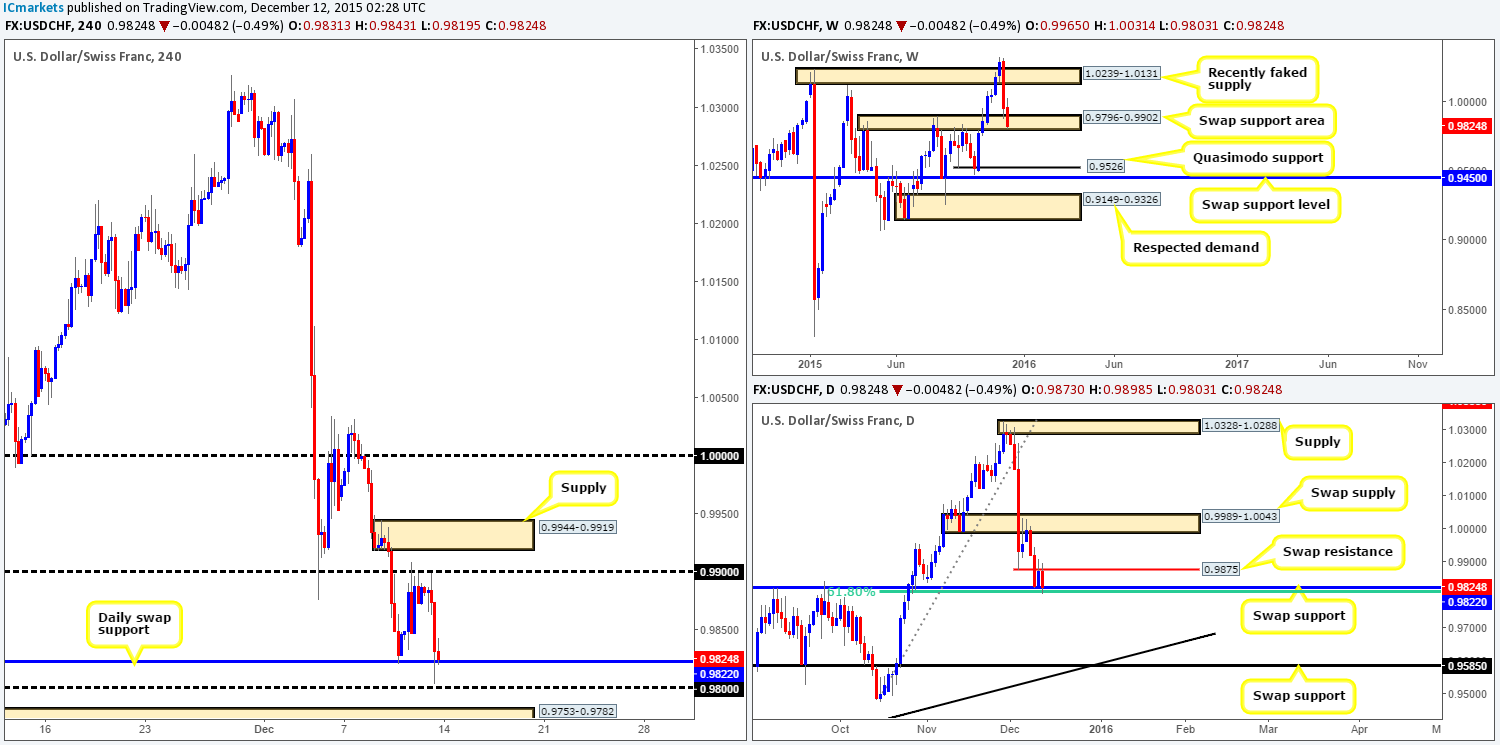
Last week’s movement saw the USD/CHF suffer a further 130-pip decline in value last week, resulting in price diving deeper into the jaws of the weekly swap (support) area at 0.9796-0.9902 by the close 0.9824. If this area is taken out, the next objective to reach looks to be the Quasimodo support seen at 0.9526.
Although the current weekly swap (support) area appears weak due to the lack of buying interest seen here, it may still be worth waiting for this week’s candle to close shop before presuming this area to be checked out.
Zooming in and looking at the daily picture, however, reveals price is currently sandwiched between a swap support level at 0.9822 (bolstered by a 61.8% Fibonacci level below it at 0.9803) and a minor swap resistance level at 0.9875. A sustained move below this region could force this market down towards a swap support drawn from 0.9585, which, as you can see, converges nicely with a long-term trendline support taken from the low 0.9077. Conversely, a push above 0.9875 likely has the swap supply zone at 0.9989-1.0043 to target.
Shifting another gear lower into H4 territory shows that not only is price trading at a daily swap (support) level and a merging 61.8% Fibonacci barrier (see above), it also shows there’s psychological support 0.9800 lurking just below these structures. 0.9800 has, in our book, proved itself (through history) to be a relatively significant support and resistance level. As such, with the weekly and daily currently hovering around supports, we’re going to be looking for price to fake lower and tag in bids sitting around this round number today. Should this come to fruition and we manage to spot a lower timeframe setup to enter long, we’ll be looking to hold this until at least 0.9900. The reason for requiring confirming lower timeframe price action is because there is a high probability price may fake below 0.9800 into demand seen just at 0.9753-0.9782 (which in itself is another buy zone to watch today).
Levels to watch/ live orders:
- Buys: 0.9800 [Tentative – confirmation required] (Stop loss: dependent on where one confirms this level). 0.9753-0.9782[Tentative – confirmation required] (Stop loss: dependent on where one confirms this area).
- Sells: Flat (Stop loss: N/A).
DOW 30
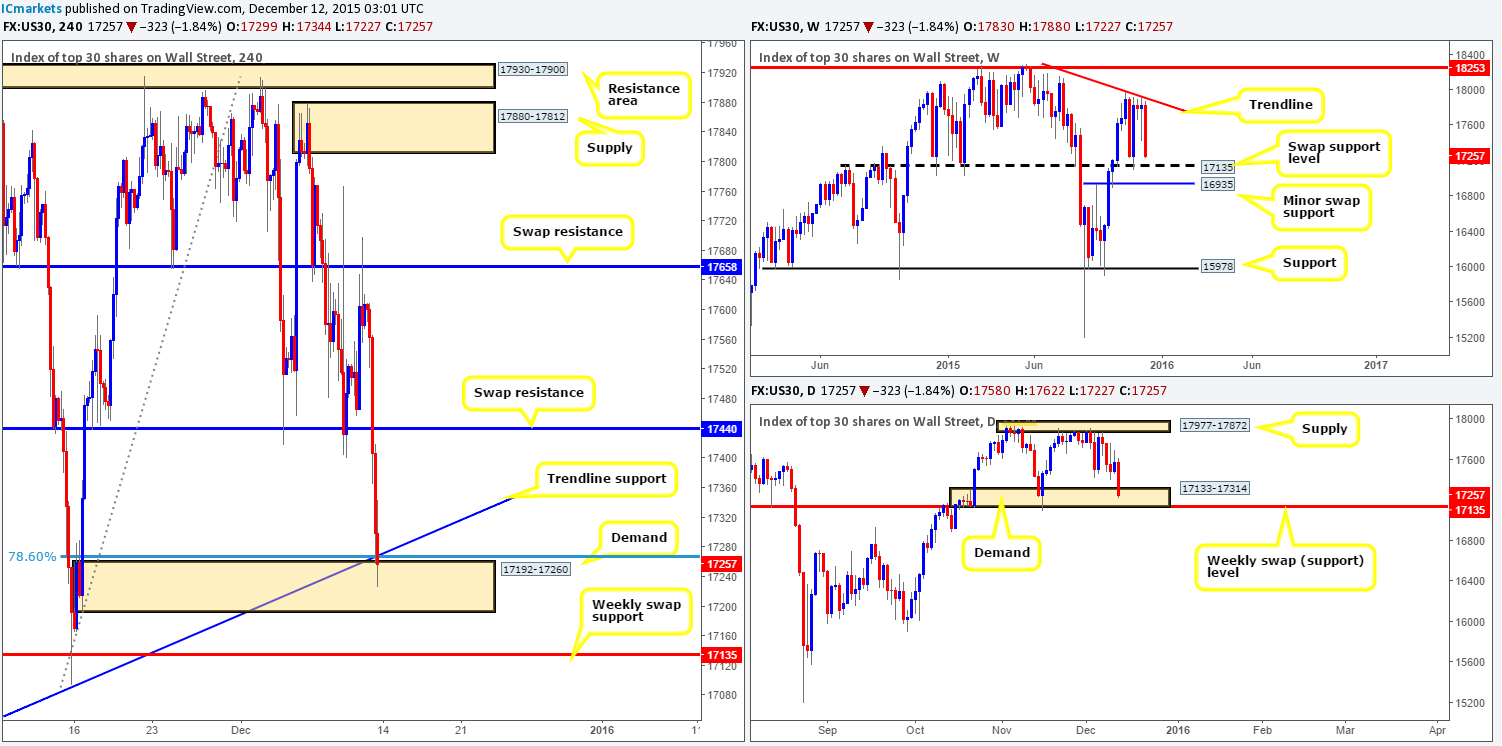
The DOW took a relatively large hit last week, falling sharply from the underside of a weekly trendline resistance extended from the high 18365, forcing price to close the week around 600 points in the red at 17257. This downside move also brought this market down to within touching distance of a weekly swap (support) level coming in at 17135, thus there’s a high probability this level could see some action this week.
Down on the daily chart, however, price concluded trade for the week within demand seen at 17133-17314 (sits on top of the above said weekly swap [support] level). Therefore, we have to be prepared for the possibility that price may turn bullish before connecting with the weekly level. It will be interesting to see what the H4 offers…
Consequent to the recent sell-off , H4 action also finished off the week closing within demand drawn from 17192-17260. This area offers deep 78.6% support at 17266 and trendline support extended from the low 16889. As we can all see though, both these converging barriers were slightly breached on Friday, suggesting possible weakness here.
In view of the above, our approach to this market today and possibly into the week will be as follows:
- Watch for lower timeframe buy entries within the current H4 demand zone at 17192-17260. We agree that the consumption of the 78.6% Fibonacci level and trendline support is not ideal, but with the aforementioned daily demand encapsulating this area, it is, at least in our book, still worthy of consideration. We’d ideally be looking for price to rally to the swap resistance level at 17440 before taking partial profits.
- In case the current H4 demand gives way, all eyes will be on the weekly swap support seen below it at 17135. This level is extremely significant in itself – just look at how much this market respected this number on the weekly chart! With that, we believe this level to be worthy enough to condone a market order (no confirmation required). However, we will be taking into consideration the H4 approach, and of course, the time of day before risking capital on this idea.
Levels to watch/ live orders:
- Buys: 17192-17260 [Tentative – confirmation required] (Stop loss: dependent on where one confirms this area). 17135 [Likely enter here at market] (Stop loss: 17081).
- Sells: Flat (Stop loss: N/A).
XAU/USD: (Gold)
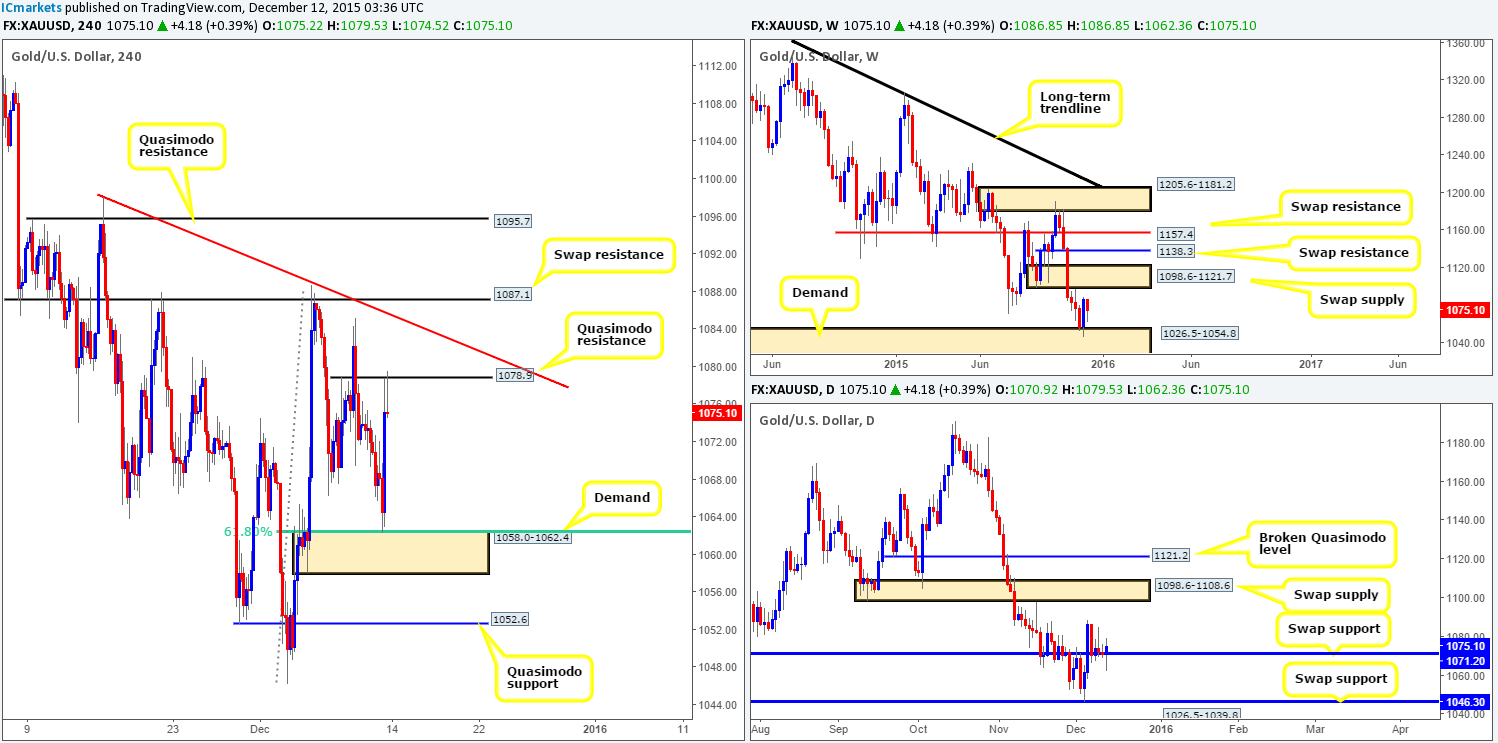
From the weekly chart, we can see that Gold saw no further buying last week following the rebound from demand at 1026.5-1054.8. As a result, the precious metal closed lower at 1075.1, consequently losing $11.70 in value. Admittedly, this was a losing week, but not really one that suggests further selling will follow suit. Reason being is down on the daily timeframe, it was only Monday that was negative for Gold, Tuesday onwards price was seen holding firm at a daily swap (support) level drawn from 1071.2.
Friday’s action on the H4, however, was relatively painful for us. For those who read Friday’s report (http://www.icmarkets.com/blog/friday-11th-december-daily-technical-outlook-and-review/), you may recall us mentioning to watch for confirmed longs from both support at 1068.3 (no longer on the chart) and demand at 1058.0-1062.4 (boasts 61.8% Fibonacci support at 1062.0). Unfortunately, we were unable to pin-point a lower timeframe buy entry at the respected demand due to price rebounding so fast from the top-side of this area, which is a crying shame since it rallied beautifully up to Quasimodo resistance taken from 1078.9.
With what we’ve noted on the higher timeframe structures (see above), the two H4 rejection wicks seen at this Quasimodo level before the close will not likely see follow-through selling today in our opinion. In fact, we’re actually looking for price to break above this barrier and touch gloves with trendline resistance taken from the high 1098.0, followed closely by swap resistance just above at 1087.1.
One could look for intraday (confirmed) bounces from these barriers, but be aware that the more attractive zone for shorts sits above at 1095.7 – another Quasimodo resistance level (corresponds nicely with the underside of both the weekly and daily swap supplies [1098.6-1121.7/1098.6-1108.6]).
In the event that our analysis is correct, and Gold does indeed rally this week, we will also be looking to take advantage of any buy opportunities on the break above and retest of 1087.1, targeting 1095.7. We would advise trading this move only with the backing of supporting lower timeframe confirmation since one can never be sure if price will fakeout.
- Buys: Watch for offers to be consumed around 1087.1 and then look to trade any retest seen at this level (confirmation required).
- Sells: H4 trendline resistance [Tentative – confirmation required] (Stop loss: dependent on where one confirms this line). 1087.1 [Tentative – confirmation required] (Stop loss: dependent on where one confirms this level).