Key risk events today:
Bank of England Governor Bailey Speaks.
(Previous analysis as well as outside sources – italics).
EUR/USD:
Weekly gain/loss: +0.48%
Weekly close: 1.1297
Weekly perspective:
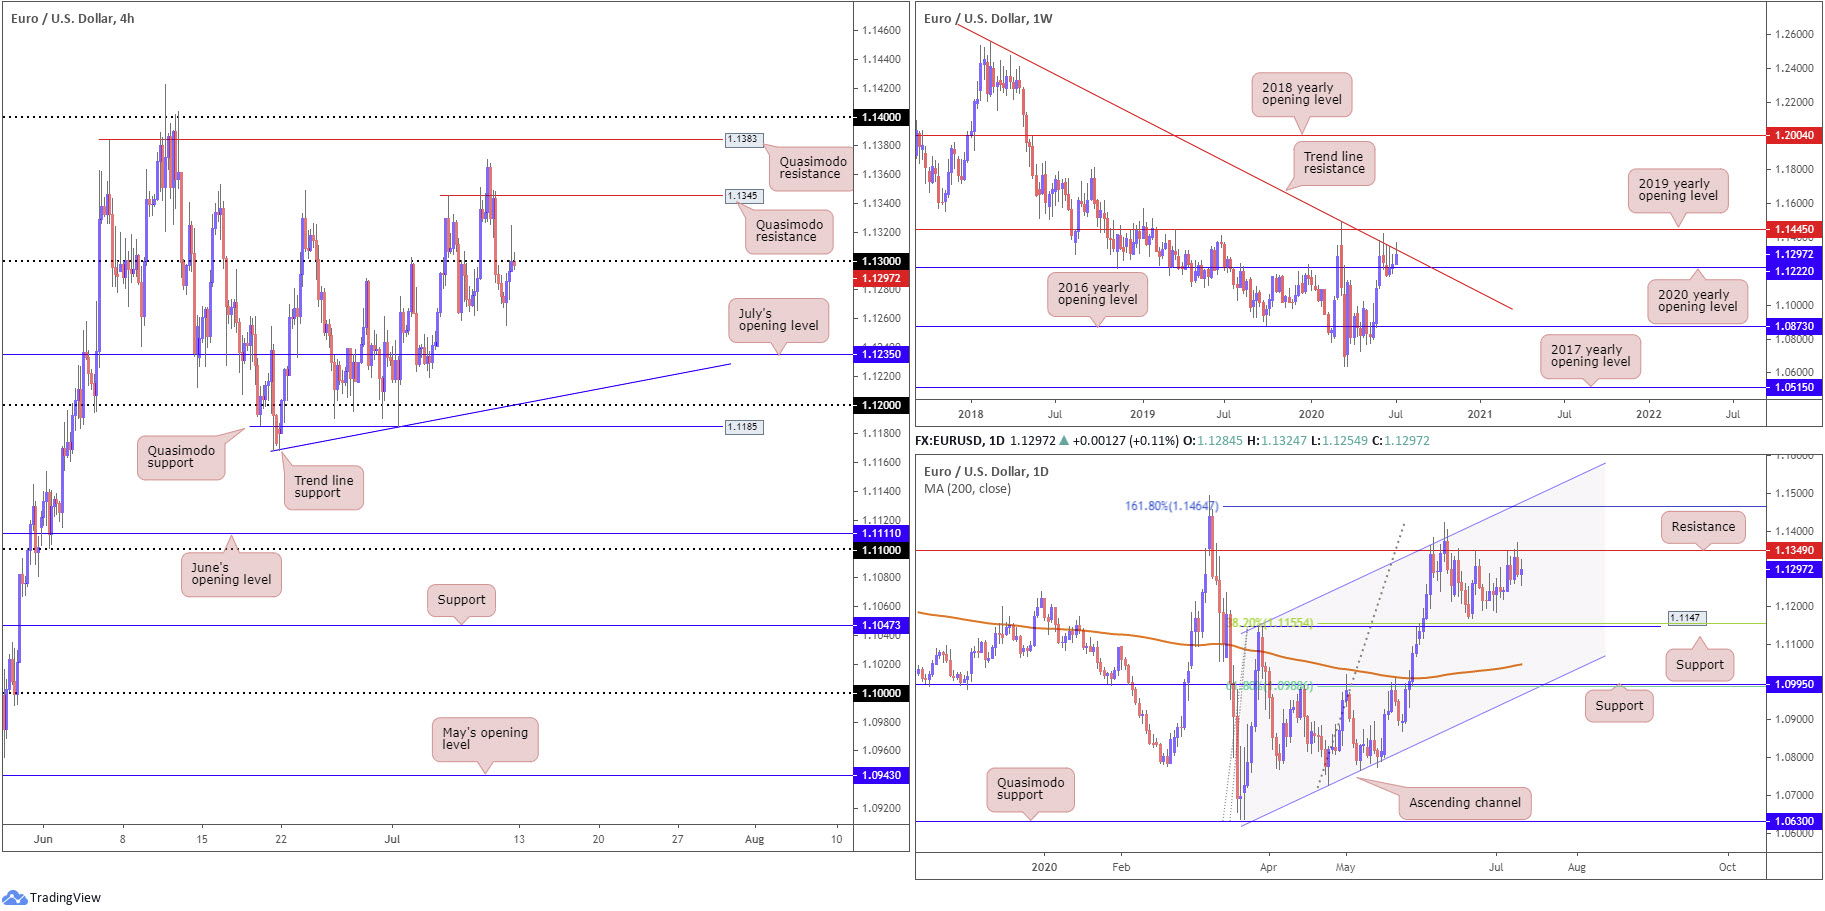
Although concluding higher for a third consecutive week, albeit off best levels, price action remains limited between the 2020 yearly opening level at 1.1222 and long-term trend line resistance, taken from the high 1.2555.
A breakout to the upside this week shifts focus to the 2019 yearly opening level at 1.1445, whereas a dip to lower levels exposes the 2016 yearly opening level at 1.0873.
Daily perspective:
Since the beginning of June, resistance at 1.1349 has, as you can see, held back buyers.
Breaking 1.1349 this week points to a 161.8% Fibonacci extension point at 1.1464 as workable resistance, combined with a channel resistance, extended from the high 1.1147.
A significant move south, assuming moves beneath the 1.1168 June 22 low, has support from the 1.1147 27 March high to target, a level merging closely with a 38.2% Fibonacci retracement ratio at 1.1155.
H4 perspective:
Europe’s single currency reclaimed earlier losses Friday, latching onto a healthy bid off 1.1255 to 1.13 against the buck, boosted by US producer prices unexpectedly declining in June. The Producer Price Index for final demand fell 0.2 percent in June, seasonally adjusted, the US Bureau of Labour Statistics reported Friday. This decrease followed a 0.4 percent increase in May and a -1.3 percent decline in April.
Skies above the 1.13 handle are moderately clear until Quasimodo resistance at 1.1345, with a break here revealing another Quasimodo formation at 1.1383 and the 1.14 handle. To the downside, space below 1.13 targets lows around 1.1258ish, closely followed by July’s opening level at 1.1235.
Areas of consideration:
Ultimately, upside attempts on the bigger picture remain capped by the weekly trend line formation and daily resistance at 1.1349. This reflects a bearish stance going into the week, positioning 1.13 (H4) in the frame as possible resistance for bearish scenarios back to at least 1.1258 and July’s opening level at 1.1235.
A break above 1.13, on the other hand, shines the spotlight on H4 Quasimodo resistance at 1.1345. Coupled with daily resistance at 1.1349 and weekly trend line resistance in motion, 1.1345 could also be a probable resistance to work with this week.
GBP/USD:
Weekly gain/loss: +1.05%
Weekly close: 1.2612
Weekly perspective:
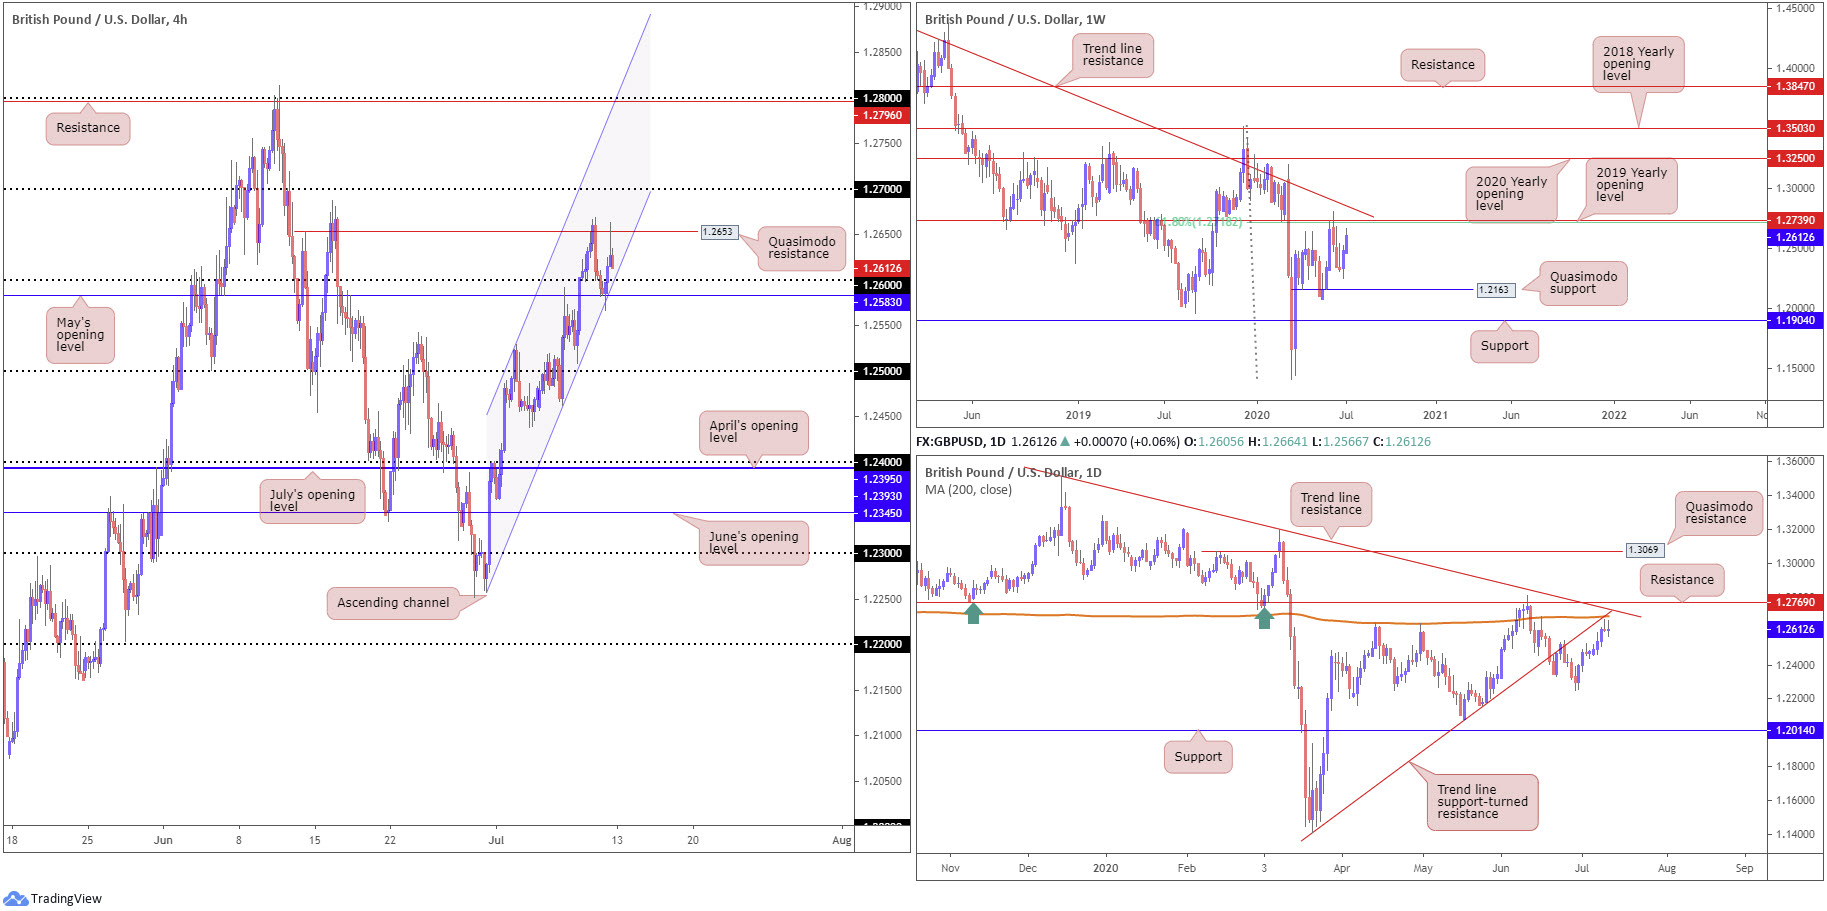
Two consecutive weeks of gains has sited price movement within touching distance of a 61.8% Fibonacci retracement ratio at 1.2718 and the 2019 yearly opening level at 1.2739. Striking this area this week, may have sellers make an appearance.
To the downside, support resides at 1.2163, a Quasimodo formation.
Daily perspective:
Movement on the daily timeframe, meanwhile, trades just south of substantial resistance, made up of trend line support-turned resistance, taken from the low 1.1409, another trend line resistance, extended from the high 1.3514, the 200-day SMA (orange – 1.2688) and resistance at 1.2769.
This resistance combination also boasts a connection to the aforementioned weekly resistances.
H4 perspective:
Friday, as you can see, enticed dip-buying at May’s opening level from 1.2583 (and channel support, taken from the low 1.2257), stalling Thursday’s retracement slide from 1.2669. The US dollar index failed to sustain gains, therefore recognised as one of the key influences behind GBP/USD reclaiming 1.26 to the upside and retesting Quasimodo resistance at 1.2653.
Territory north of 1.2653 this week underlines the 1.27 handle. A break here may call for the 1.28ish region. A failure of 1.2583, nonetheless, paves the way for an approach back to the 1.25 neighbourhood.
Areas of consideration:
Friday’s retest at May’s opening level from 1.2583, although facing opposition at nearby H4 Quasimodo resistance from 1.2653, may be sufficient to lure additional buying to 1.27 this week.
1.27 is interesting. Not only does the psychological base represent a take-profit target for longs north of the 1.26 vicinity, the round number emphasises robust resistance across the board, closely joined by a collection of daily and weekly resistances (highlighted above in bold).
AUD/USD:
Weekly gain/loss: +0.05%
Weekly close: 0.6946
Weekly perspective:
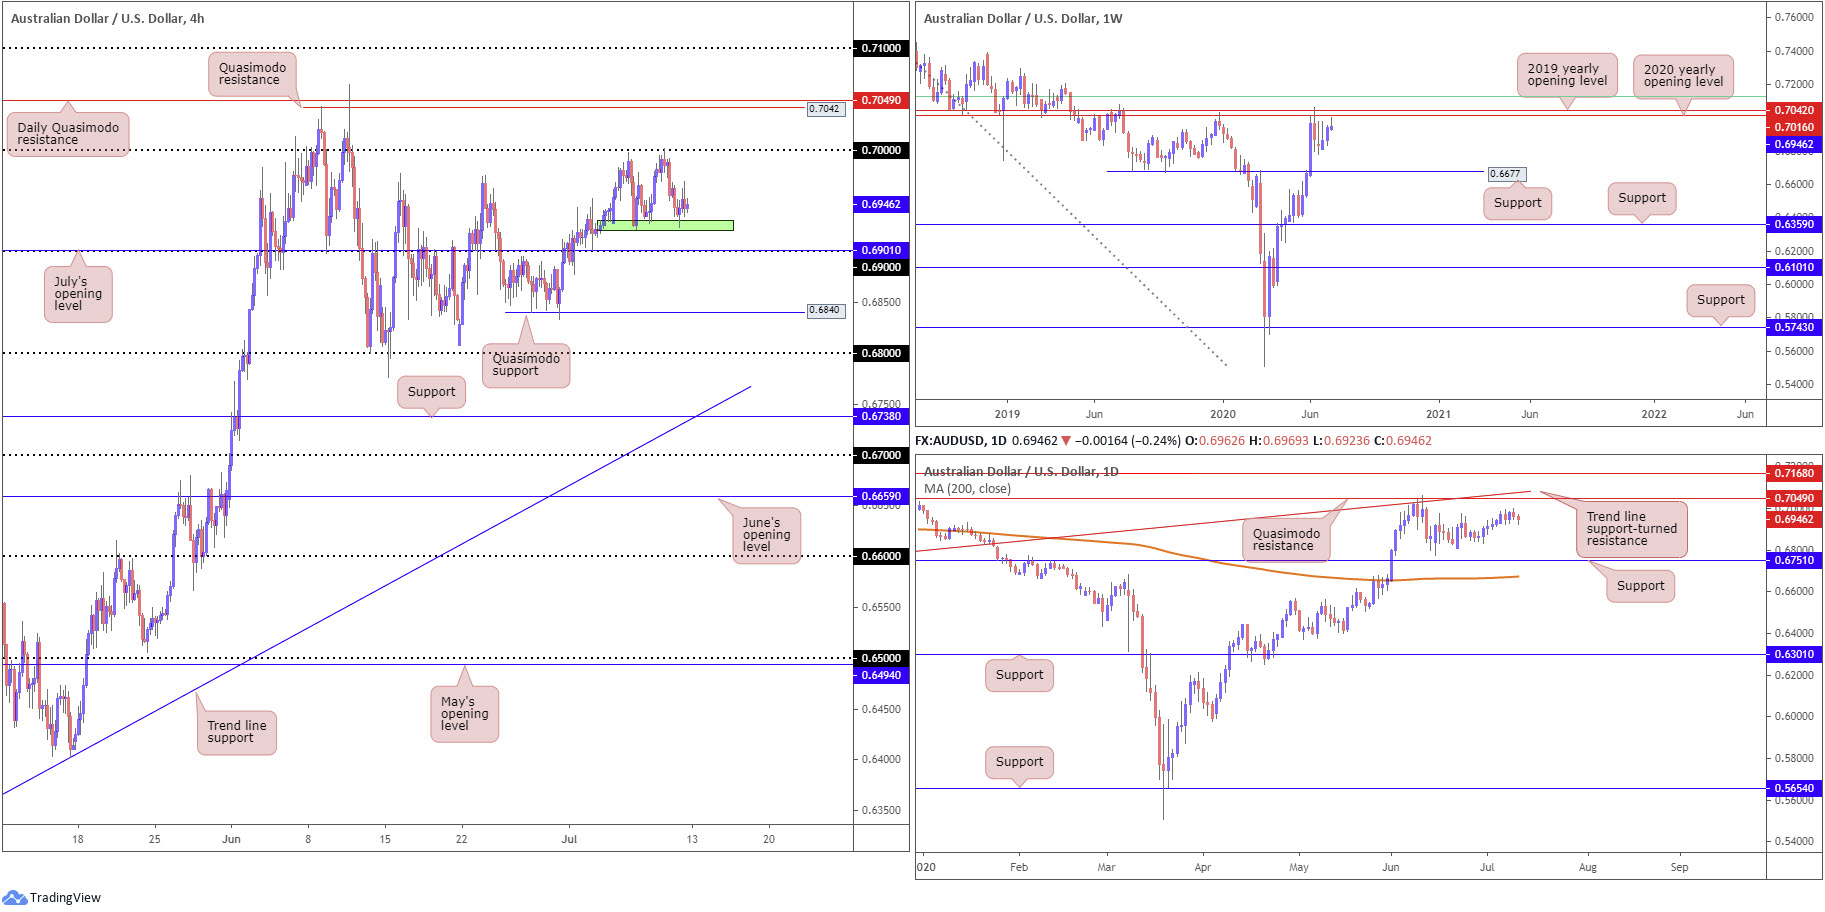
With AUD/USD recording a third consecutive week in positive territory, albeit considerably off best levels, prime focus is on resistance this week, forged in the shape of a 2020 yearly opening level and a 2019 yearly opening level, at 0.7016 and 0.7042, respectively.
It might also interest some traders to note just above the said resistances we have a 61.8% Fibonacci retracement ratio sited at 0.7128 (green).
In terms of support on the weekly timeframe, crosshairs remain fixed on 0.6677.
Daily perspective:
A closer reading of candle action on the daily timeframe shows price wandering no man’s land (lack of technical structure), albeit steadily grinding higher.
Of particular interest on the chart this week, however, is Quasimodo resistance positioned at 0.7049, a level linking with trend line support-turned resistance, taken from the low 0.6670. Another level worth noting is support coming in at 0.6751 and the 200-day SMA (orange – 0.6673).
H4 perspective:
The risk-sensitive Australian dollar was relatively tame Friday, despite US equity indexes discovering higher ground amid US hours.
The key figure 0.70 made an appearance Thursday, a widely watched level in this market, directing AUD/USD to local support around 0.6930ish (green) Friday, which held into the week’s end. If a break comes to pass, the H4 candles are bound for 0.69 and July’s opening level at 0.6901. South of here, the pair appears starved of support until a Quasimodo formation hits at 0.6840.
Areas of consideration:
With the round number 0.70 (H4) sharing space with weekly resistance at 0.7016, the 2020 yearly opening level, this combination remains a key reversal zone to watch this week.
Clearing 0.70, on the other hand, brings H4 Quasimodo resistance at 0.7042 to light, which not only lines up with the 2019 yearly opening level on the weekly timeframe, daily Quasimodo resistance also resides close by at 0.7049. Given this, this area is also worthy of the watchlist this week.
To the downside, we have the 0.69 handle merging with July’s opening level at 0.6901 on the H4. Although capable of withstanding downside attempts, the base lacks higher timeframe confluence, therefore vulnerable.
USD/JPY:
Weekly gain/loss: -0.55%
Weekly close: 106.89
Weekly perspective:
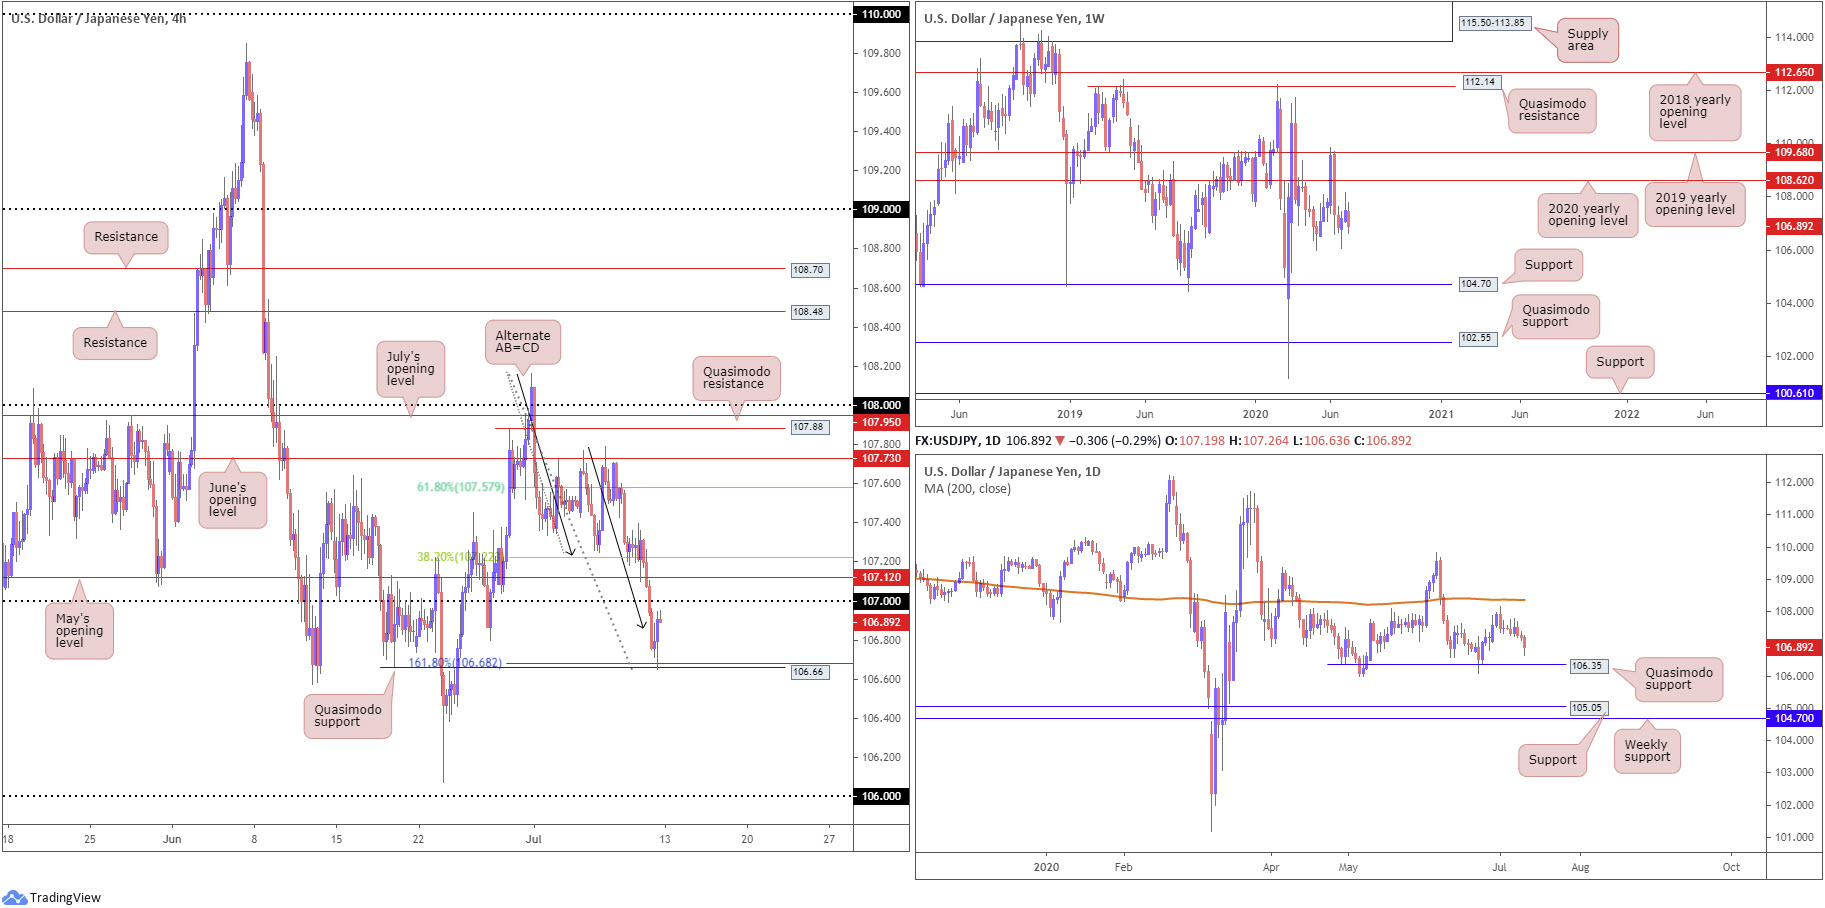
Snapping a two-week bullish phase, USD/JPY navigated lower terrain last week. Leaving the 2020 yearly opening level at 108.62 unchallenged, support derived from the 105.98 6th May low is in sight this week, with a break uncovering long-term support plotted at 104.70.
Daily perspective:
After pencilling in a top a few pips shy of the 200-day SMA (orange – 108.36), shaped by way of a bearish outside day, the pair appears to be making its way towards Quasimodo support at 106.35, the origin of the recent leg higher.
Beyond 106.35, traders will watch support priced in at 105.05, closely followed by weekly support mentioned above at 104.70.
H4 perspective:
The US dollar extended losses against its Japanese counterpart Friday, leaping through 107 support and testing an interesting area of support at 106.68, in the shape of a strong bullish candle. 106.68, a 161.8% Fibonacci extension point that converges closely with Quasimodo support at 106.66, represents the completion of what is known as an ‘alternate AB=CD (black arrows) correction’.
It is common for AB=CD traders to target the 38.2% Fibonacci retracement (derived from legs A-D), which in this case is seen at 107.22. The second take-profit target is generally found at the 61.8% Fibonacci retracement ratio (107.57).
Areas of consideration:
AB=CD traders will likely be watching the round number 107, May’s opening level at 107.12 and the 38.2% Fibonacci retracement ratio mentioned above at 107.22 as initial upside targets early week. Traders are also urged to pencil in the possibility of a turn from the aforementioned levels, due to the H4 AB=CD lacking higher timeframe confluence.
Breaking 106.66 this week, throws daily Quasimodo support at 106.35 into the pot as the next downside target.
USD/CAD:
Weekly gain/loss: +0.33%
Weekly close: 1.3590
Weekly perspective:
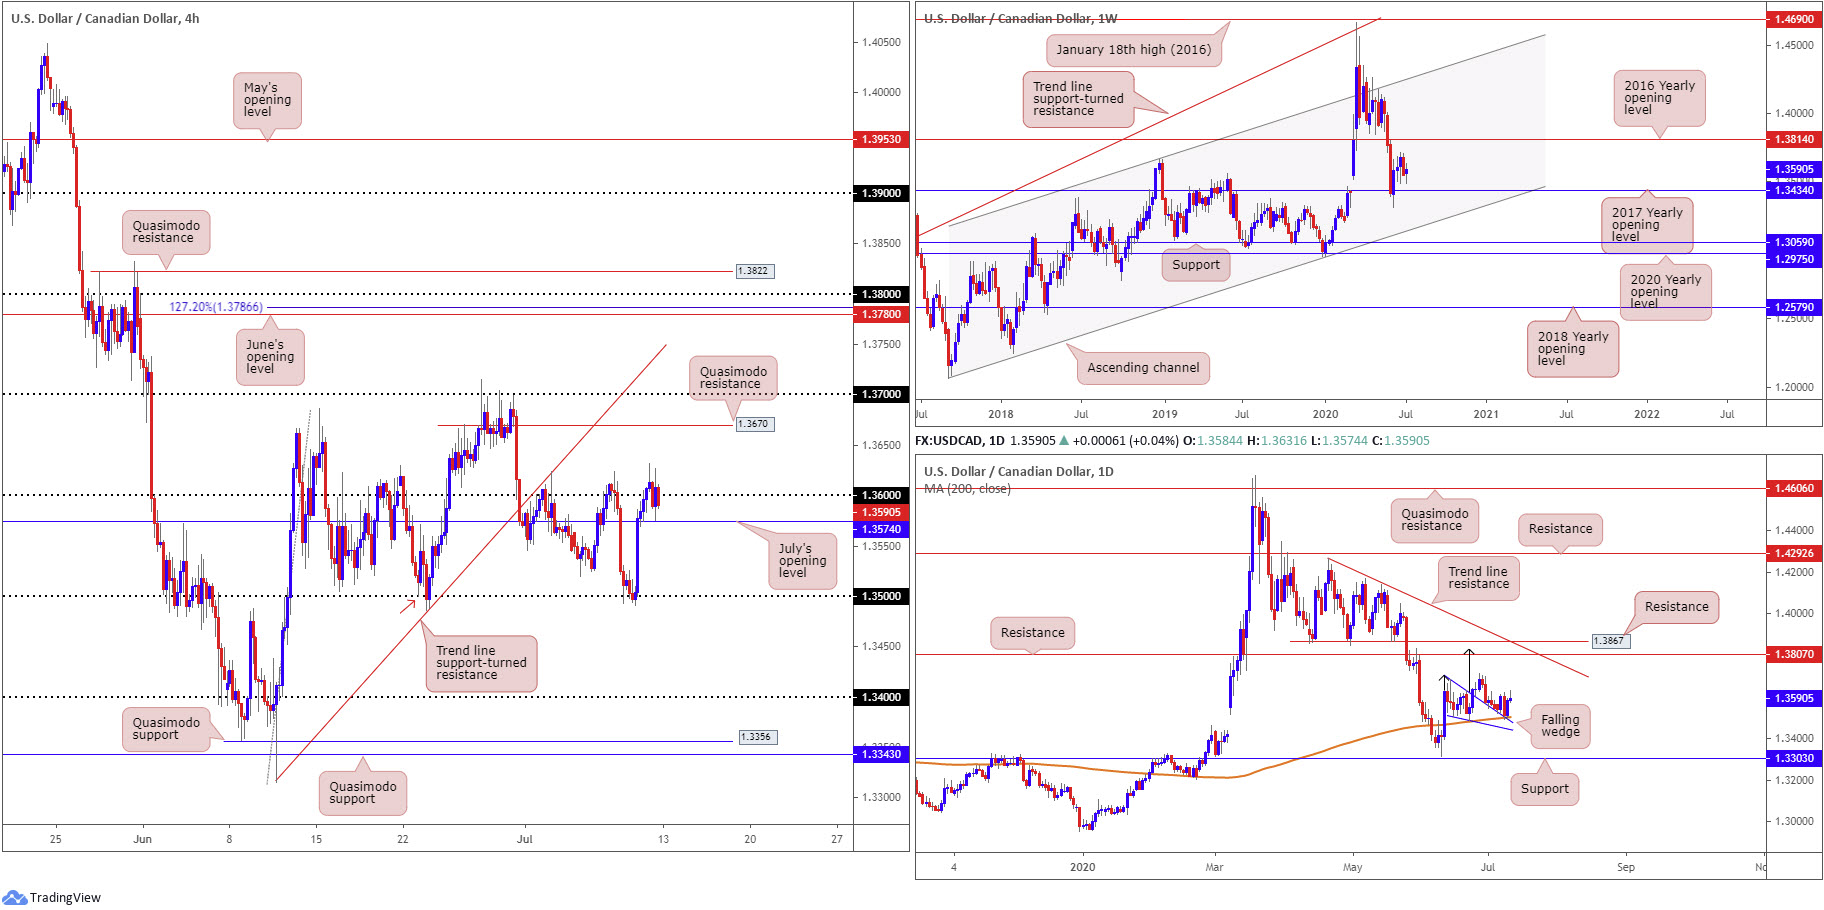
Action on the weekly timeframe currently hovers north of the 2017 yearly opening level at 1.3434.
Beyond 1.3434, channel support, taken from the low 1.2061, can be viewed as the next potential floor.
A USD/CAD bid throws the 2016 yearly opening level at 1.3814 in the pot as feasible resistance this week, with follow-through buying to try and tackle a dense block of supply between 1.4190/1.3912.
Daily perspective:
Technical action on the daily timeframe witnessed a recovery form from the upper edge of a breached falling wedge pattern (1.3686/1.3504) into the second half of last week, merging with the 200-day SMA (1.3503). Take-profit targets out of a falling wedge pattern can be measured by taking the base value and adding this figure to the breakout point (black arrows), which as you can see in this case, meets closely with resistance at 1.3807, followed by another layer of resistance at 1.3867.
H4 perspective:
The Canadian economy added 952K jobs in June, Statistics Canada reported Friday, beating consensus, and the unemployment rate dropped 1.4 percentage points from 13.7% in May to 12.3% in June. Despite upbeat figures, USD/CAD offered a relatively muted response.
For technical traders who read Friday’s analysis you may recall the following notes (italics):
Going forward, traders likely have 1.36 in the crosshairs today. A H4 close above the aforementioned level, in light of where we’re coming from on the daily timeframe, may see traders seek bullish scenarios towards H4 Quasimodo resistance mentioned above at 1.3670.
As evident from the H4 chart, price closed above 1.36 on Friday but failed to maintain position, resulting in a dip back to July’s opening level nearby at 1.3574.
Areas of consideration:
Owing to daily structure, and lack of resistance on the weekly timeframe, traders are still likely watching for a decisive H4 close to form above 1.36 this week, seeking bullish themes towards H4 Quasimodo resistance at 1.3670.
USD/CHF:
Weekly gain/loss: -0.38%
Weekly close: 0.9406
Weekly perspective:
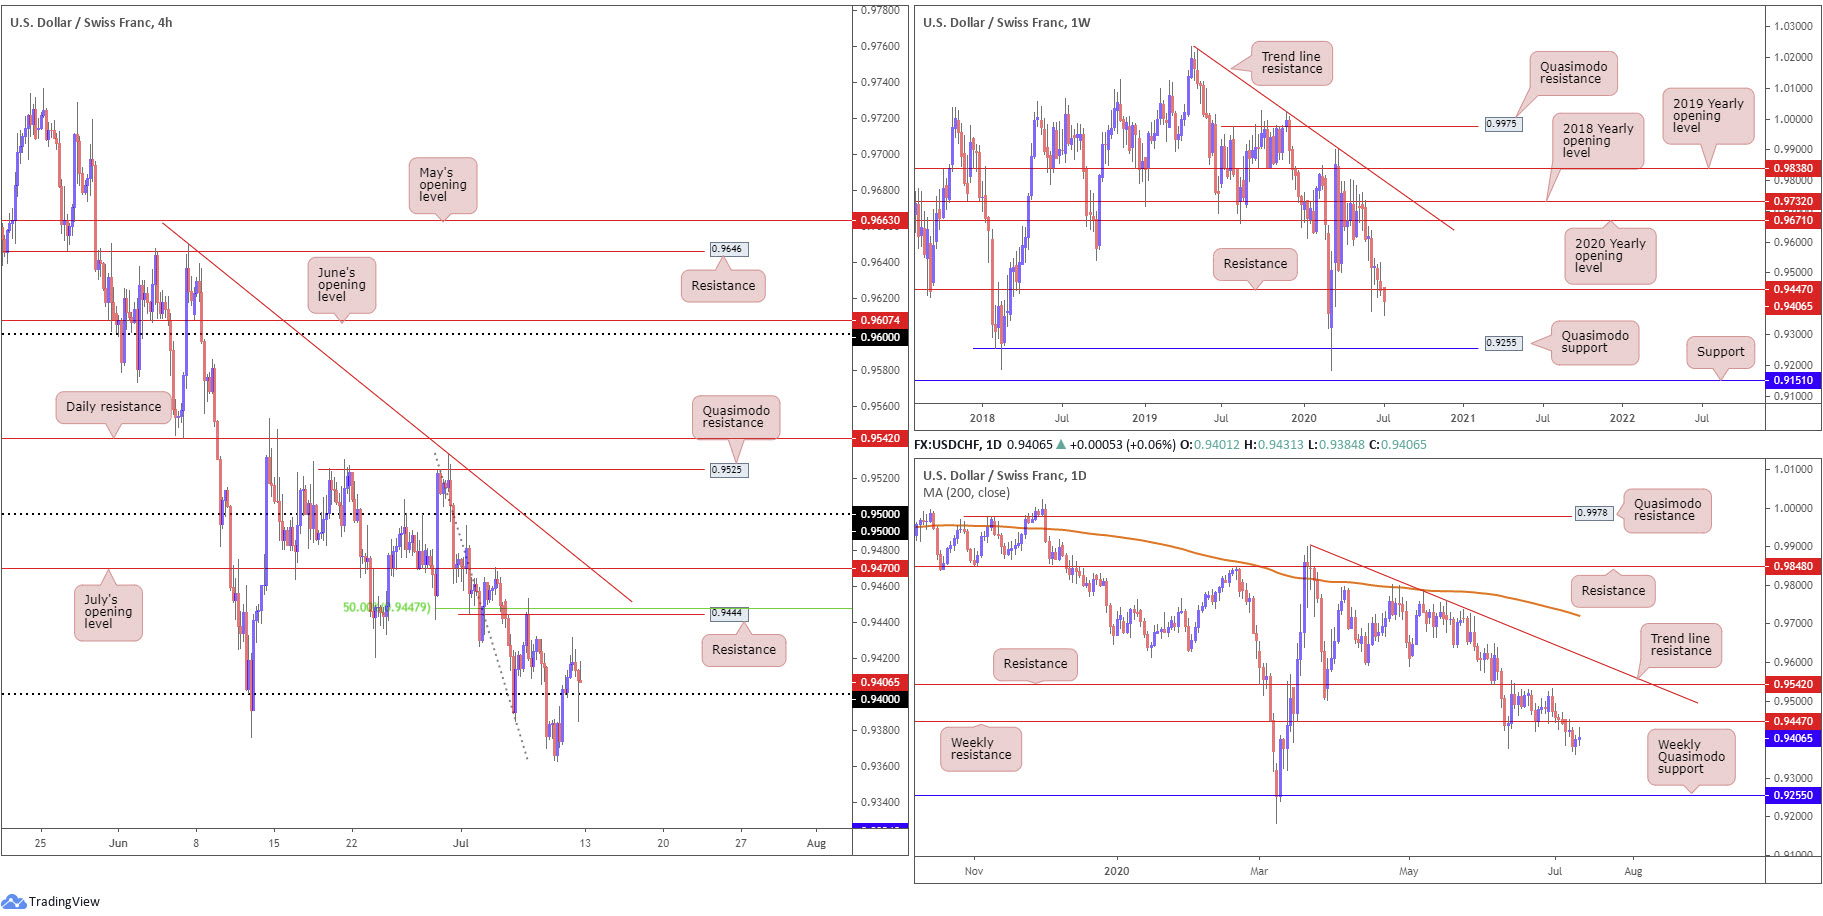
Last week saw price action soften through support at 0.9447 (now a serving resistance), chalking up a third consecutive weekly decline. However, downside stalled into the second half of the week and staged a modest recovery, similar to EUR/USD (two inversely correlated markets).
The break south has likely caught the attention of sellers this week, targeting Quasimodo support plotted at 0.9255.
Daily perspective:
The daily timeframe offers a similar picture to the weekly chart at the moment, underlining bearish themes south of the recently penetrated weekly support at 0.9447, targeting 0.9255.
H4 perspective:
USD/CHF bulls, as you can see, defended 0.94 as support late Friday, withstanding an energetic pop to lows at 0.9384 which established a hammer candlestick formation.
Assuming buyers uphold position this week, resistance at 0.9444 could make an appearance, a level aligning closely with a 50.00% retracement ratio at 0.9447 and weekly resistance, also at 0.9447.
Areas of consideration:
Some intraday buyers will establish bullish positions off 0.94 early week, given the retest of the latter formed by way of a H4 bullish candlestick signal. Upside targets, as underscored above, can be found just south of 0.9450, an area containing weekly resistance at 0.9447.
If, on the other hand, higher timeframe sellers head for deeper waters this week, it is likely a breach of 0.94 will materialise, re-opening the possibility of moves to 0.9324 on the H4, a Quasimodo support.
Dow Jones Industrial Average:
Weekly gain/loss: +1.39%
Weekly close: 26107
Weekly perspective:
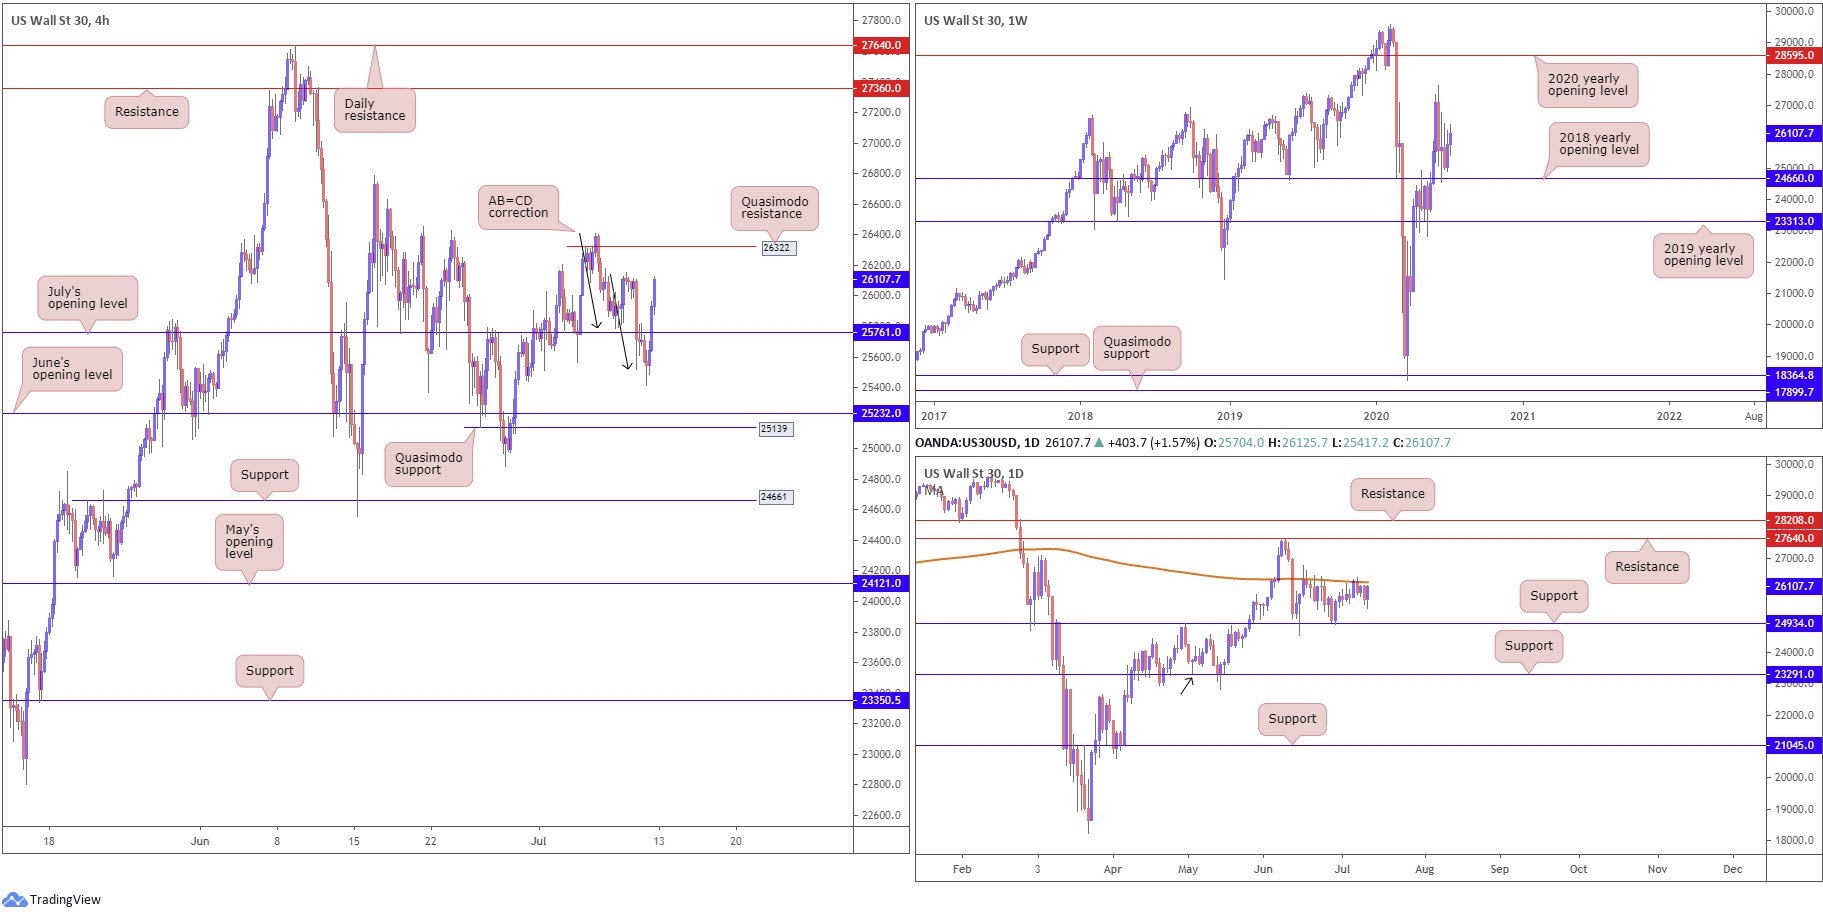
The 2018 yearly opening level at 24660 remains an important base of support on the weekly timeframe, as buyers pushed for their second consecutive weekly gain in recent trade.
In the event traders manage to keep their head above water here, we might pull in the 27638 high this week, followed by the 2020 yearly opening level at 28595.
Overrunning 24660, however, could bring light to the 2019 yearly opening level at 23313.
Daily perspective:
Since June 15, price action on the daily timeframe has ranged between the 200-day SMA (orange – 26242) and support from 24934.
The aforementioned SMA remains in the spotlight for the time being, restraining buyers last week. A break higher this week not only helps confirm upside strength on the weekly timeframe, it points to a probable run towards daily resistance from 27640.
H4 perspective:
US equity benchmarks finished higher Friday on positive news surrounding Gilead’s antiviral drug to treat COVID-19. The Dow Jones Industrial Average advanced 369.21 points, or 1.44%; the S&P 500 rallied 32.99 points, or 1.05%, and the tech-heavy Nasdaq 100 concluded higher by 81.74 points, or 0.76%.
Price action on the H4 timeframe found a footing off AB=CD structure (black arrows) at 25518. As of the week’s close, we can see movement overthrew July’s opening level at 25761 and re-joined peaks around 26107. Above this point, traders’ crosshairs are likely fixed on the 200-day SMA at 26242, closely followed by H4 Quasimodo resistance at 26322.
Areas of consideration:
For technicians who read Friday’s briefing you may recall the following (italics):
A decisive H4 close above 25761 will likely stir buyers today, targeting 26107 as an initial take-profit zone, followed by the 200-day SMA at 26241 and then H4 Quasimodo resistance at 26322.
Well done to any readers who managed to take advantage of recent upside. Further buying is possible, according to technical studies on the weekly chart.
As we move into the new week, a daily close above the 200-day SMA would send across a strong bullish sign, with room to press as far north as daily resistance at 27640.
XAU/USD (GOLD):
Weekly gain/loss: +1.32%
Weekly close: 1798.4
Weekly perspective:
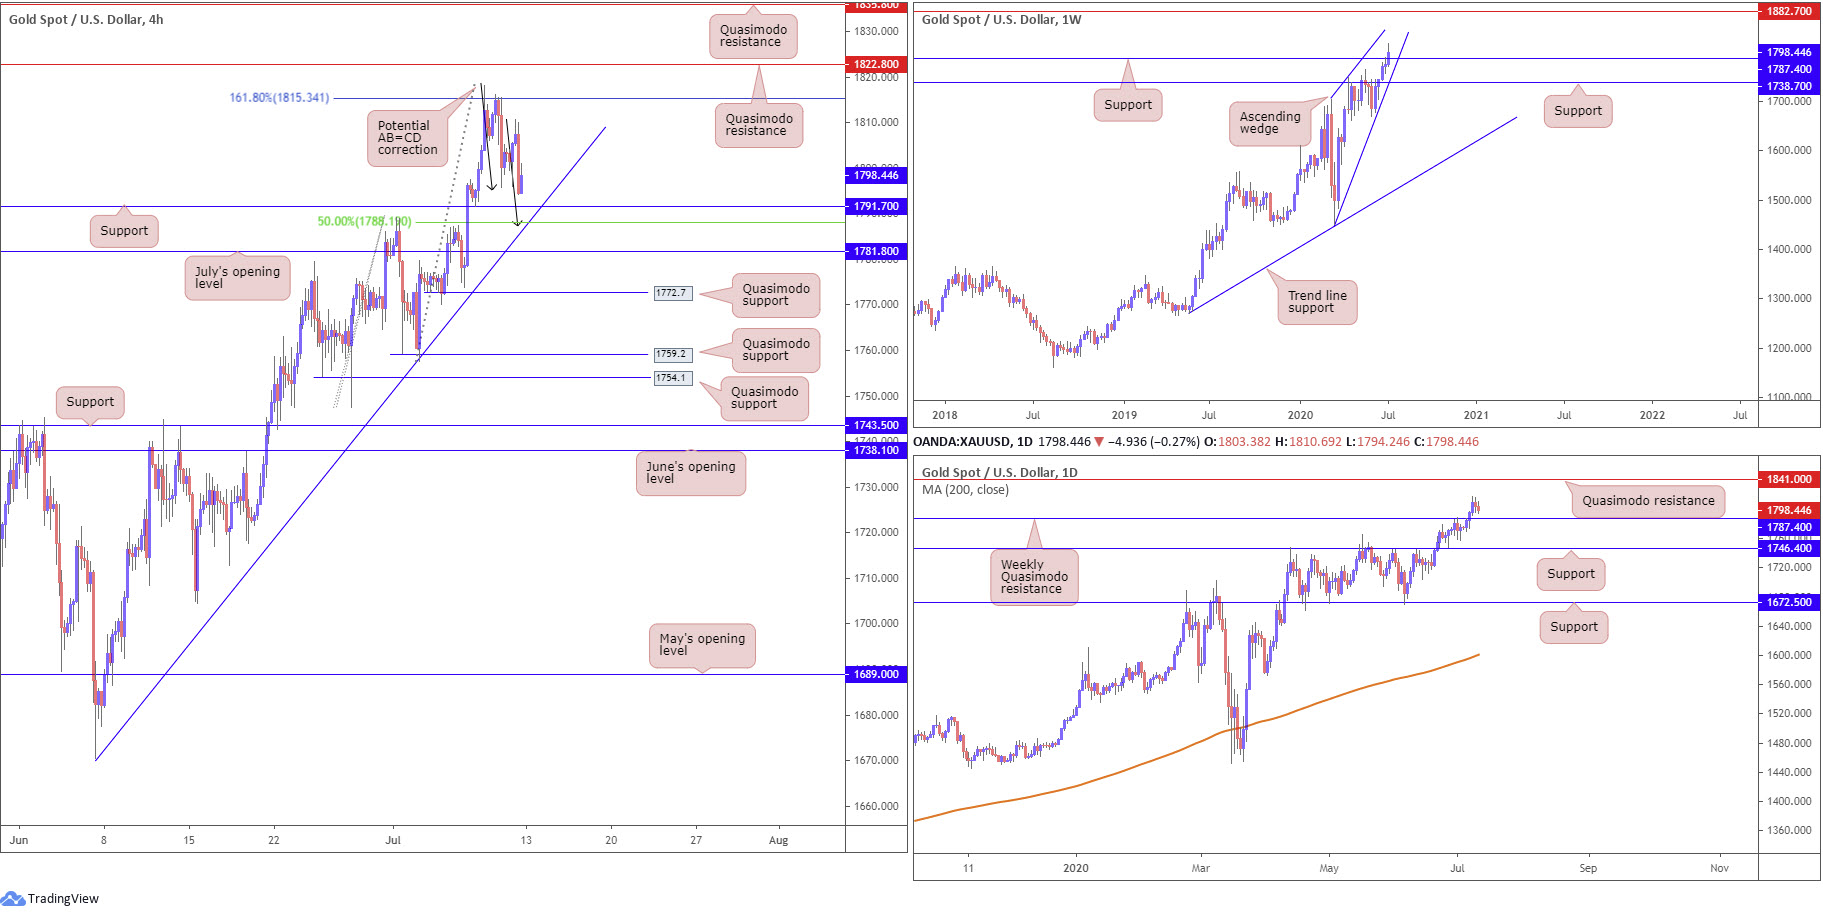
Registering a fifth consecutive weekly gain, XAU/USD bulls elbowed above Quasimodo resistance at 1787.4 (now a serving support) in recent trading. In line with the underlying trend, the break higher has perhaps laid the foundation for continuation buying to resistance stationed at 1882.7 this week.
Also of interest on the weekly timeframe is a potential ascending wedge pattern, forming between 1451.4/1703.2.
Daily perspective:
Clearing weekly Quasimodo resistance at 1787.4 on the daily timeframe stresses a possible run to daily Quasimodo resistance at 1841.0 this week.
Before reaching 1841.0, though, traders may want to pencil in the possibility of a 1787.4 retest.
H4 perspective:
XAU/USD dipped Friday, extending Thursday’s retracement slide off the 161.8% Fibonacci extension point at 1815.3. This has, as displayed on the chart, emphasised a possible AB=CD bullish correction (black arrows) at 1787.0, closely merging with support at 1791.7, a trend line support, extended from the low 1670.4, and a 50.00% retracement at 1788.1. What’s also appealing here is weekly support at 1787.4 dovetails with the aforementioned structure.
Sinking lower this week, nevertheless, points to July’s opening level nearby at 1781.8.
Areas of consideration:
A H4 AB=CD completion early week is a strong possibility. There are a number of technical elements supporting a reaction from this region, highlighted above in bold. As for upside targets, traders will likely have the 161.8% H4 Fibonacci extension point at 1815.3 eyed as the initial take-profit zone, followed by H4 Quasimodo resistance at 1822.8.
The accuracy, completeness and timeliness of the information contained on this site cannot be guaranteed. IC Markets does not warranty, guarantee or make any representations, or assume any liability regarding financial results based on the use of the information in the site.
News, views, opinions, recommendations and other information obtained from sources outside of www.icmarkets.com.au, used in this site are believed to be reliable, but we cannot guarantee their accuracy or completeness. All such information is subject to change at any time without notice. IC Markets assumes no responsibility for the content of any linked site.
The fact that such links may exist does not indicate approval or endorsement of any material contained on any linked site. IC Markets is not liable for any harm caused by the transmission, through accessing the services or information on this site, of a computer virus, or other computer code or programming device that might be used to access, delete, damage, disable, disrupt or otherwise impede in any manner, the operation of the site or of any user’s software, hardware, data or property.


