A note on lower timeframe confirming price action…
Waiting for lower timeframe confirmation is our main tool to confirm strength within higher timeframe zones, and has really been the key to our trading success. It takes a little time to understand the subtle nuances, however, as each trade is never the same, but once you master the rhythm so to speak, you will be saved from countless unnecessary losing trades. The following is a list of what we look for:
- A break/retest of supply or demand dependent on which way you’re trading.
- A trendline break/retest.
- Buying/selling tails/wicks – essentially we look for a cluster of very obvious spikes off of lower timeframe support and resistance levels within the higher timeframe zone.
- Candlestick patterns. We tend to only stick with pin bars and engulfing bars as these have proven to be the most effective.
We search for lower timeframe confirmation between the M15 and H1 timeframes, since most of our higher-timeframe areas begin with the H4. Stops are usually placed 5-10 pips beyond confirming structures.
EUR/USD:
Weekly gain/loss: + 79 pips
Weekly closing price: 1.1230
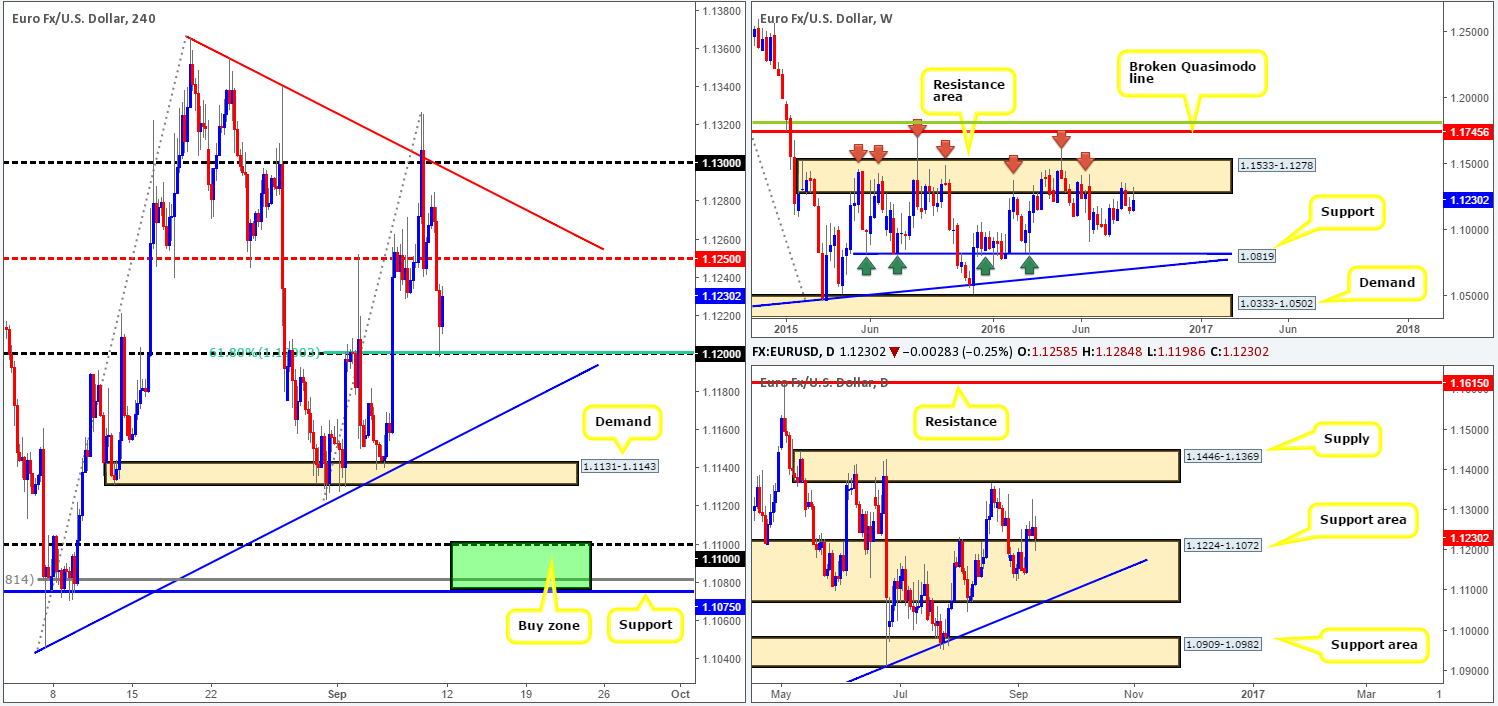
Weekly view: Although the EUR did see an increase in value last week, we have to take into account that price was unable to close above the prior week’s high, and also rejected from the underside of a major resistance area at 1.1533-1.1278. Seeing as how this zone has managed to cap upside since May 2015, the bulls will likely have their work cut out for them should they intend on pushing this market north this week!
Daily view: Down here on the daily chart, however, price recently found a floor of bids from within a support area at 1.1224-1.1072. While this may be true, we can also see that the buyers were rather lethargic going into mid-week trading, with the market ending the week chalking up a prominent bearish candle. The next downside target from here can be seen at the trendline support extended from the low 1.0516, followed by a support area sitting at 1.0909-1.0982.
H4 view: A quick recap of Friday’s sessions on the H4 chart show that the single currency sold off going into London lunchtime, following comments made by Fed member Eric Rosengren. As a result, the mid-way support 1.1250 was taken out and price went on to connect with the 1.12 handle, which happens to merge beautifully with a 61.8% Fib support line.
Direction for the week: While there is a possibility of further consolidation around the current daily support area, we feel pressure from the overhead weekly supply will eventually push prices south to test the aforementioned daily trendline.
Direction for today: With there being little market-moving news scheduled for release today, we may see some ranging action between the 1.12 hurdle and the H4 mid-way resistance 1.1250. If, however, the market closes beyond 1.12, this could spark a selloff down to at least the H4 trendline support taken from the low 1.1045, and maybe even the H4 demand base seen below it at 1.1131-1.1143.
Our suggestions: In the event that the market does indeed close below 1.12, a short trade could be possible on the retest of this number if followed up by a H4 bearish close. Should this come to view, the above said H4 supports in bold would be our initial take-profit targets. Our ultimate take-profit zone, nevertheless, is seen between the H4 support at 1.1075 and the 1.11 band.
Not only is this a good take-profit area, it is also a fantastic barrier to look for longs. It sits within the depths of the aforementioned daily support area, and merges with both the above noted daily trendline support and also a deep H4 88.6% Fib support at 1.1081. Therefore, do keep an eyeball on this area during the week guys!
Levels to watch/live orders:
- Buys: 1.1075/1.11 [strong-looking buy zone which could, dependent on the time of day and approach, be sufficient enough to condone an entry without lower timeframe confirmation] (Stop loss: 1.1060).
- Sells: Watch for price to close below the 1.12 handle and then look to trade any retest seen thereafter (H4 bearish close required prior to pulling the trigger).
GBP/USD:
Weekly gain/loss: – 28 pips
Weekly closing price: 1.3261
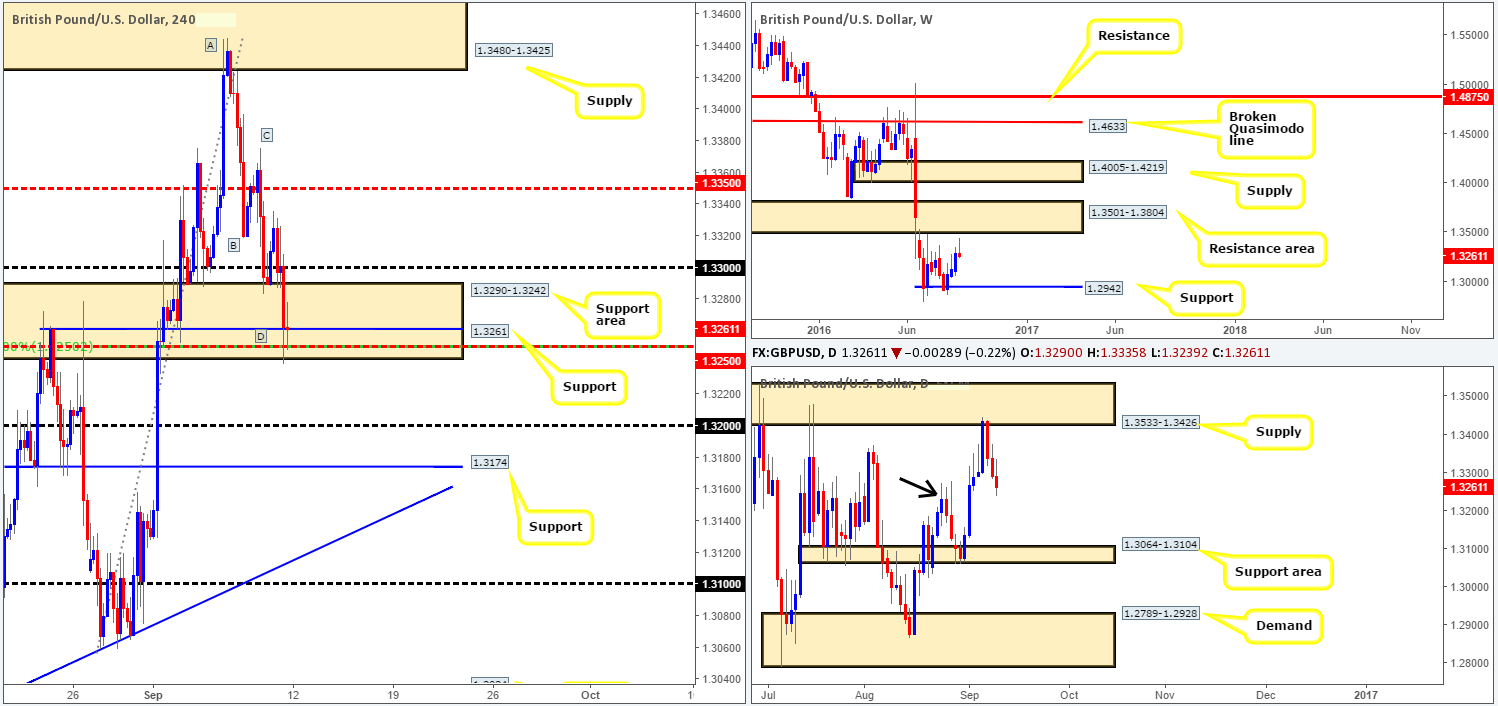
Weekly view: Following three weeks of gains, the GBP/USD printed a clear-cut bearish selling tail last week just ahead of a resistance area coming in at 1.3501-1.3804. This, along with the predominant bearish trend currently in place, could force cable back down to support at 1.2942 this week.
Daily view: From this angle, candle action rotated beautifully from the underside of a supply zone last week drawn from 1.3533-1.3426, which happens to be glued to the underside of the aforementioned weekly resistance area. While support could form from around the recently broken highs at 1.3240ish (see black arrow), the support area seen below penciled in at 1.3064-1.3104 appears to be the more attractive zone to bring price to this week.
H4 view: In a similar fashion to that of the EUR/USD, the GBP also collapsed following comments made by Fed member Eric Rosengren. In consequence to this, the 1.33 handle was consumed, allowing price to shake hands with the lower edge of the H4 support area seen at 1.3290-1.3242 by the week’s end.
Direction for the week: Apart from the possibility that support may form on the daily chart around the 1.3240 range, the pound is likely going to eventually depreciate down to at least the daily support area mentioned above at 1.3064-1.3104.
Direction for today: Well this is tricky since our analysis for the week portends a drop in prices, and from the H4 we see a highly confluent buy zone currently in play. Along with price now treading water within the above said H4 support area, we see a H4 mid-level support at 1.1250, a H4 50.0% Fib support around the same level, a H4 support at 1.3261 and to top it off there’s a H4 AB=CD bullish completion point also seen around the 1.1250ish range.
Our suggestions: Given the above H4 confluence and the possibility of daily support forming around 1.3240, we feel buying from the current H4 buy zone is certainly worth a shot. To be on the safe side, nevertheless, we would advise liquidating some of the position around the 1.33 handle and reducing risk to breakeven, since getting caught on the wrong side of weekly flow (see above) would not be a pretty sight for one’s account!
Levels to watch/live orders:
- Buys: 1.3261 region (Stop loss: 1.3235).
- Sells: Flat (Stop loss: n/a).
AUD/USD:
Weekly gain/loss: – 31 pips
Weekly closing price: 0.7535
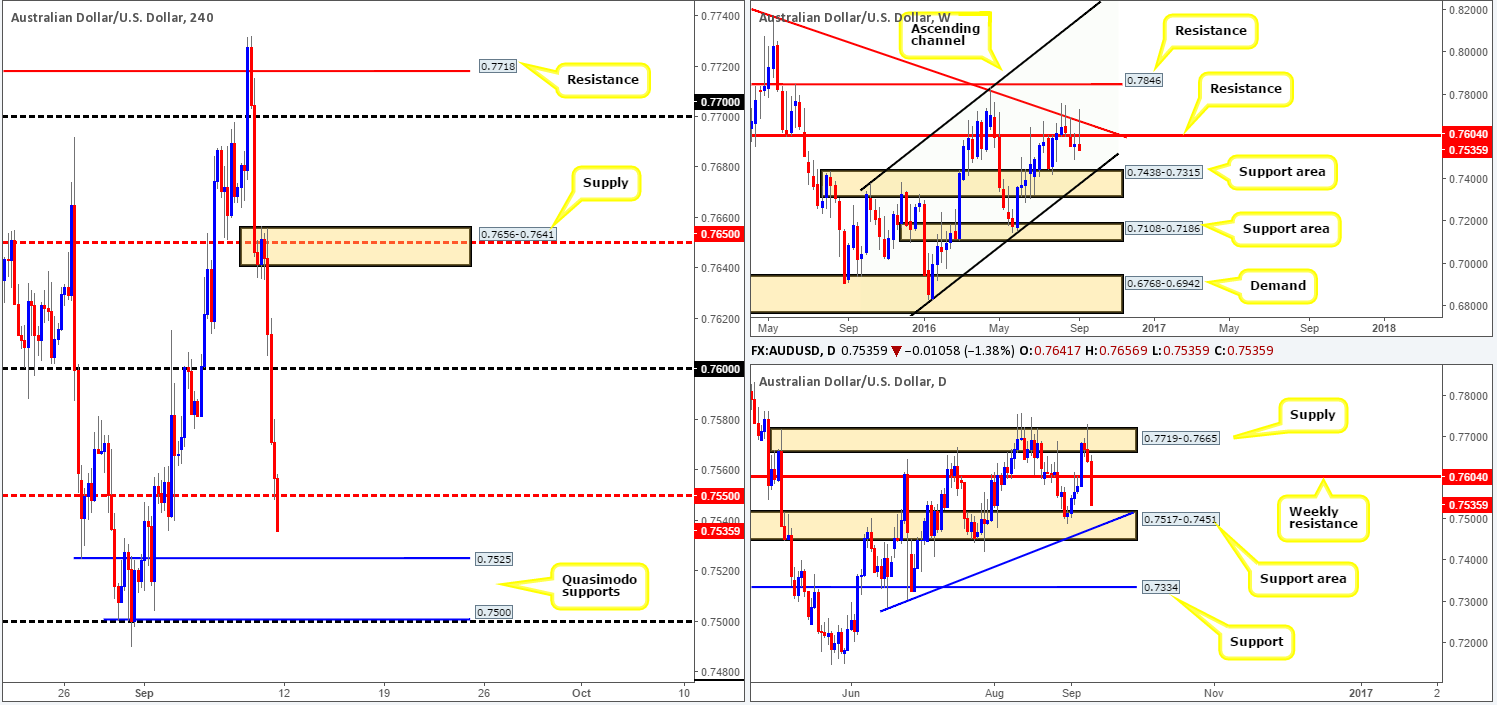
Weekly view: The past week saw the AUD/USD pair chalk up an absolutely beautiful-looking bearish selling wick. Not only did it pierce through a resistance level seen at 0.7604 but it also managed to extend past a trendline resistance taken from the high 0.8295. From a technical perspective, this certainly indicates that the commodity currency may further depreciate this week down to the support area at 0.7438-0.7315, which is complemented by a channel support line extended from the low 0.6827.
Daily view: Before we all go and punch the sell button though, one has to be aware of their surroundings! On the daily chart, price closed the week just ahead of a support area seen at 0.7517-0.7451 (fuses with a trendline support [0.7285] and sits just above the current weekly support area), which, as you can see, has managed to hold this market higher since early July! Should price break below this area, however, there’s a good chance that the unit will selloff down to 0.7334: a support level located within the extremes of the above said weekly support area.
H4 view: A brief look at recent dealings on the H4 chart, reveal that Friday was certainly not a good day for anyone long! Comments made by Fed member Eric Rosengren pressured this market lower as the US dollar index went on to touch highs of 95.58. The 0.76 handle was wiped out as was the H4 mid-level support 0.7550, with the currency closing just ahead of a H4 Quasimodo support level drawn from 0.7525.
Direction for the week: Well, looking solely at the weekly chart, one could say that this pair is likely headed lower. Be that as it may, taking into consideration that there’s a nearby daily support area, which is positioned just above the weekly chart’s next downside target: the support area at 0.7438-0.7315, direction for this pair is restricted as far as higher-timeframe structures go.
Direction for today: A push lower is likely to take place, since there’s little support standing in the way until the H4 Quasimodo support sat at 0.7525 along with another H4 Quasimodo support at 0.7500.
Our suggestions: On account of the above points, the above said H4 Quasimodo supports will likely be key levels going into the week, with the lower Quasimodo line at 0.7500 being the more attractive of the two. Not only does it unite beautifully with the 0.75 handle, it also sits within the aforementioned daily support area, whereas the upper Quasimodo line does not. As such, we would, dependent on the approach and time of day, look to enter long from 0.75 at market with a small stop below at 0.7485. The H4 Quasimodo support at 0.7525 on the other hand, would, at least for us, require a strong H4 bullish close before we’d consider buying from here.
Levels to watch/live orders:
- Buys: 0.7525 region [tentative – H4 bullish close required] (Stop loss: below the trigger candle). 0.75 (Stop loss: 0.7485).
- Sells: Flat (Stop loss: n/a).
USD/JPY:
Weekly gain/loss: – 123 pips
Weekly closing price: 102.64
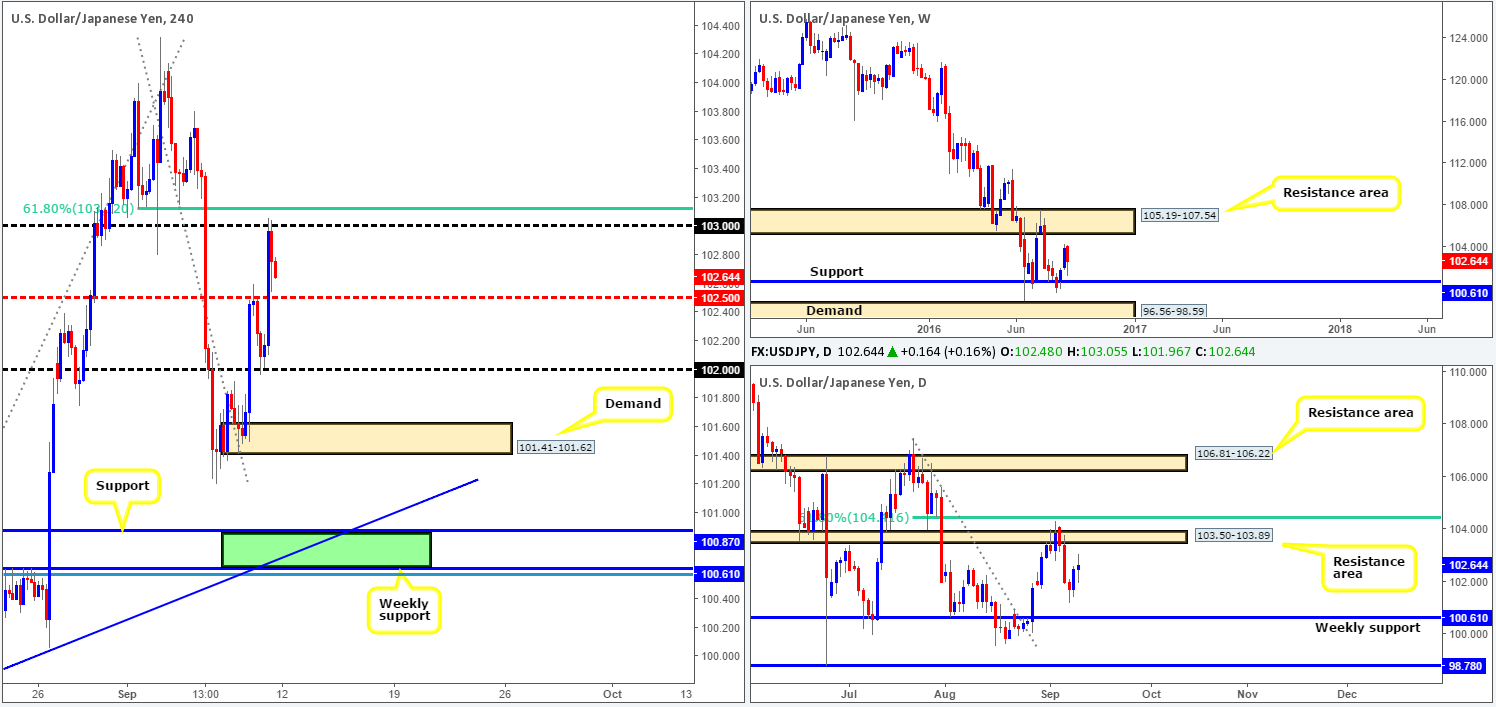
Weekly view: During the course of last week’s session, renewed selling interest flooded the market. As you can see, price did manage to breach the prior week’s lows, but did not, however, succeed in closing lower. As far as structures go this week, we have our eyes on both the support level seen at 100.61 and the resistance area coming in above at 105.19-107.54.
Daily view: So from this viewpoint, we can see that prices began to rotate on Monday last week from a resistance area at 103.50-103.89, just missing the 61.8% Fib resistance above it at 104.41. The pair managed to clock lows of 101.20 by Wednesday, which was then followed up with a bullish rotation. Going into the new week, we’re watching the above said weekly support and also the aforementioned daily resistance area.
H4 view: Comments from Fed member Eric Rosengren further boosted the US dollar on Friday, forcing the pair to attack the psychological handle 103. Leaving the 61.8% Fib resistance seen just above at 103.12 unchallenged, the couple sold off closing the week a few pips ahead of the H4 mid-way support line at 102.50.
Direction for the week: Despite the pair’s trend clearly pointing in a southerly direction, higher-timeframe structures are seen capping price in both directions this week (see above). Therefore, to our way of seeing things, direction is rather restricted for the time being.
Direction for today: At this point, today’s outlook is also very difficult to judge. Levels to keep an eyeball on, however, fall in at 103/102.50/102 and the H4 demand base drawn from 101.41-101.62.
Our suggestions: Despite the lack of direction, there is an area that caught our interest last week and is still as valid going into the new week: the H4 support at 100.87 and the aforementioned weekly support (green rectangle). Bolstered by a H4 trendline support taken from the low 99.64 as well as a H4 78.6% Fib support at 100.56, this zone boasts enough confluence to buy from here without requiring the backing of lower timeframe confirmation.
Levels to watch/live orders:
- Buys: 100.88 (Stop loss: 100.48).
- Sells: Flat (Stop loss: n/a).
USD/CAD:
Weekly gain/loss: + 63 pips
Weekly closing price: 1.3044
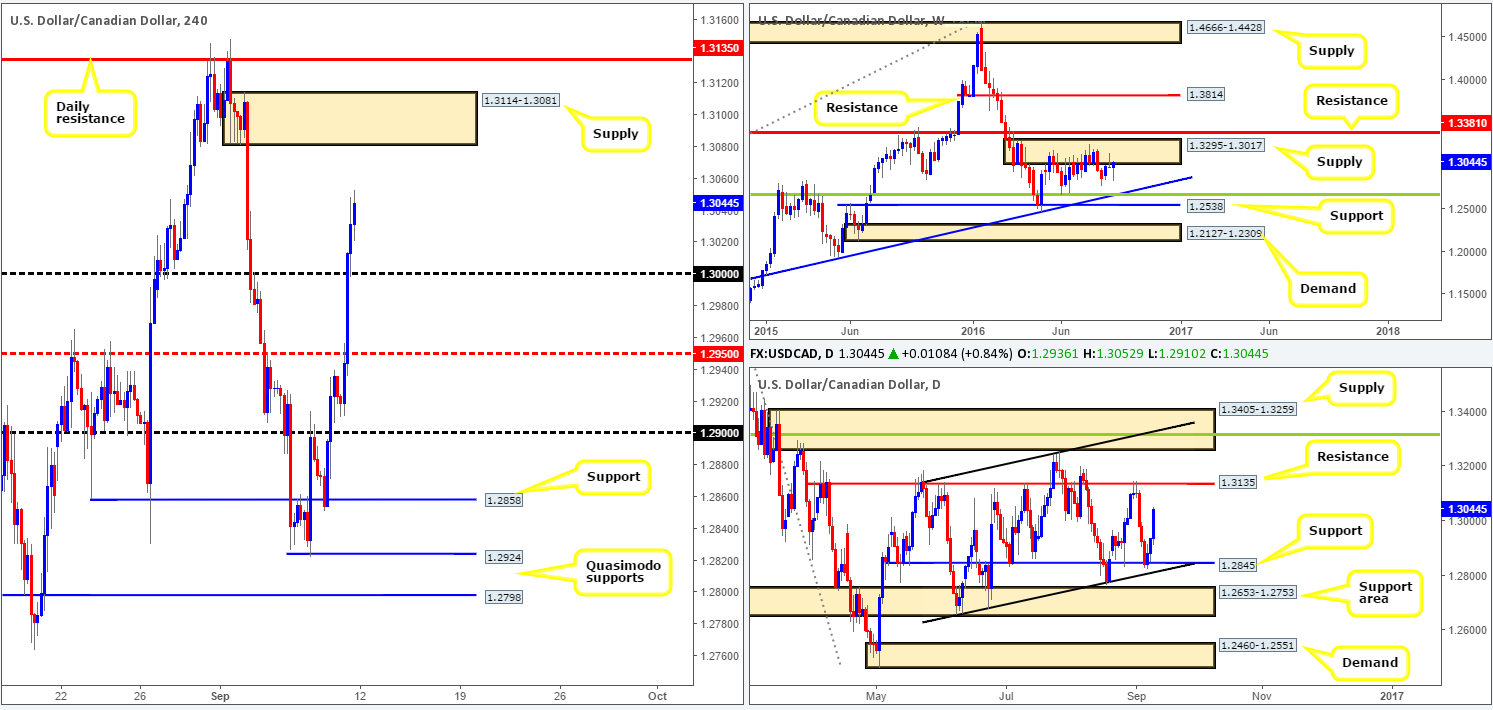
Weekly view: After the clear-cut bearish selling wick formed two weeks ago at the underside of supply coming in at 1.3295-1.3017, the sellers could not muster enough strength to close this market lower last week. In spite of this, the sellers still have a strong hand in this fight we believe, as the current area of supply has done a superb job in holding the loonie lower since the end of May. Assuming that the sellers notch it up a gear this week, there is a chance we could see a move down to the trendline support extended from the high 1.1278 (intersects beautifully with a Fib support line at 1.2649).
Daily view: With the weekly picture in mind, there is room seen on the daily chart for prices to continue advancing this week until reaching the resistance level at 1.3135. This level – coupled with the supply zone seen above it at 1.3405-1.3259, are both notable areas worth keeping a tab on this week!
H4 view: The Canadian labor market revealed on Friday that the unemployment rate jumped to 7.0%, while the number of employed people increased by 26.2k. Alongside this, we also had comments from Fed member Eric Rosengren further boosting the attractiveness of the US dollar, consequently pushing prices through the key level 1.30 and reaching highs of 1.3052 into the week’s end.
Direction for the week: Well, initial direction is likely to be northbound at least until the USD/CAD comes to grips with daily resistance at 1.3135.
Direction for today: According to the H4 chart, there is space for a continuation move north up to H4 supply at 1.3114-1.3081, which happens to be located directly below the aforementioned daily resistance. On the flip side, there is also a chance that price could pullback to collect any unfilled buy orders left around the 1.30 boundary on Friday.
Our suggestions: Long trades are valid from 1.30 today (alongside a H4 bullish close) on the condition that price does not strike the above said H4 supply zone beforehand, since this area would, along with the daily resistance line above it, be our take-profit range. Once, or indeed if, price manages to connect with the H4 supply area, our team would not advise hunting for long setups!
Levels to watch/live orders
- Buys: 1.30 region [tentative – H4 bullish close required] (Stop loss: below the trigger candle).
- Sells: Flat (Stop loss: n/a).
USD/CHF:
Weekly gain/loss: – 50 pips
Weekly closing price: 0.9750
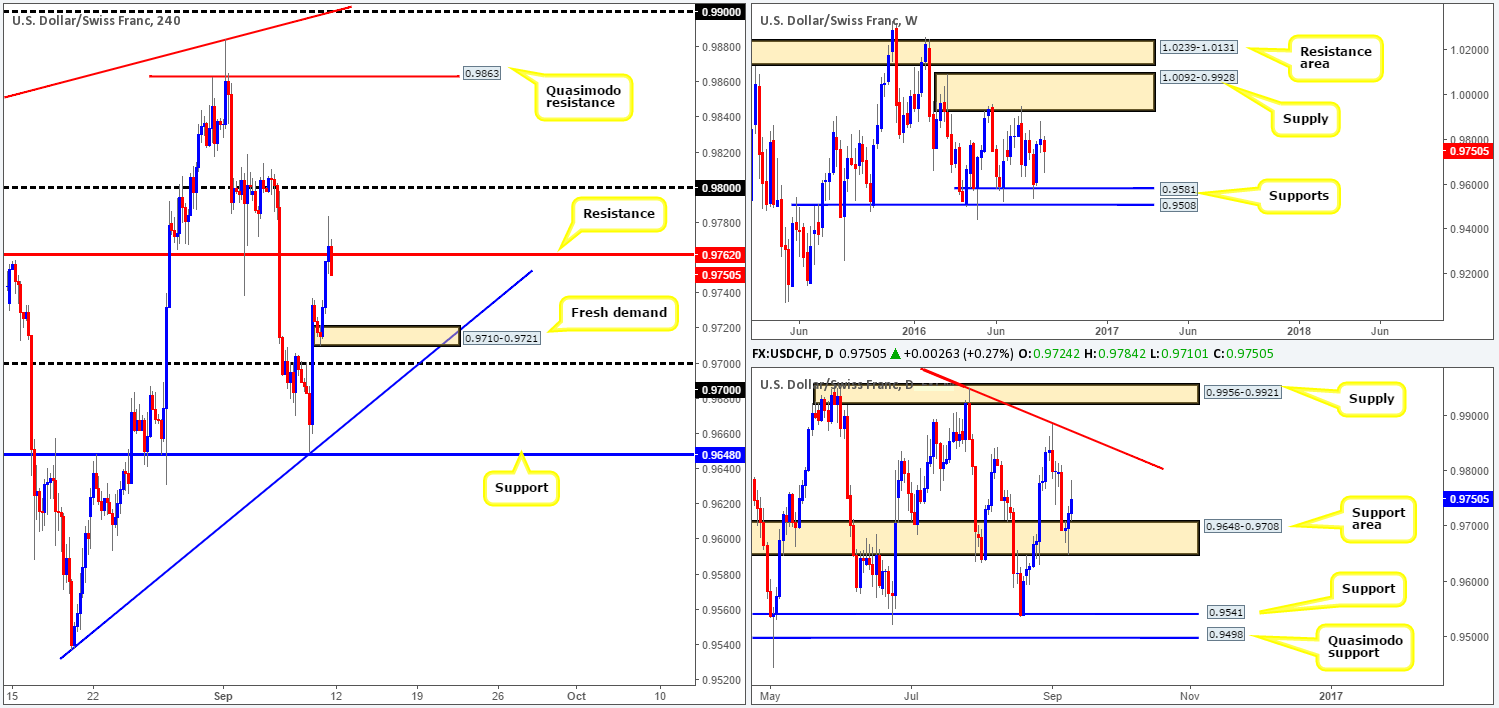
Weekly view: Since the beginning of May, the USD/CHF pair has been consolidating between a supply zone painted at 1.0092-0.9928 and a support band drawn from 0.9581. It’s unlikely that price will breach the walls of this range this week, so the best we can do on this timeframe is keep a tab on the edges of this consolidation.
Daily view: The story on the daily chart, however, shows that the Swissy managed to find a foothold around the daily support area at 0.9648-0.9708 on Wednesday last week, resulting in price punching to highs of 0.9784 by the week’s end. On the assumption that the bulls remain in a dominant position, the next upside target to have jotted down comes in at the trendline resistance extended from the high 1.0256, followed by the supply area seen at 0.9956-0.9921 (glued to the underside of the above said weekly supply zone).
H4 view: Helped by comments made from Fed member Eric Rosengren, a fresh bout of dollar buying came into the picture on Friday. With that, we saw price briefly punch above H4 resistance at 0.9762, but unfortunately, as can be seen from the chart, was unable to sustain gains beyond this number going into the week’s close.
Direction for the week: With weekly price seen loitering mid-range between the above said structures, and daily price reflecting more a bullish stance from the current daily support area, it’s likely we’ll see prices head north at least until we collide with the aforementioned daily trendline resistance.
Direction for today: Despite our above outlook for the week, today’s action will likely grind lower to connect with the fresh H4 demand base seen at 0.9710-0.9721, before further upside comes into view. Although this H4 demand base is fresh, we do not fully trust the zone given that there is a strong possibility that price may fake through this area to marry up with the nearby psychological band 0.97.
Our suggestions: Quite simply, keep a close watch on the above said fresh H4 demand. Should price attack this zone today, and a H4 bullish close is seen, we will look to buy this market with our stop placed below the trigger candle, targeting 0.9762 as our immediate take-profit area, followed by the 0.98 handle and then the daily trendline resistance mentioned above.
Levels to watch/live orders:
- Buys: 0.9710-0.9721 [H4 bullish close required] (Stop loss: below the trigger candle).
- Sells: Flat (Stop loss: n/a).
DOW 30:
Weekly gain/loss: – 446 points
Weekly closing price: 18043
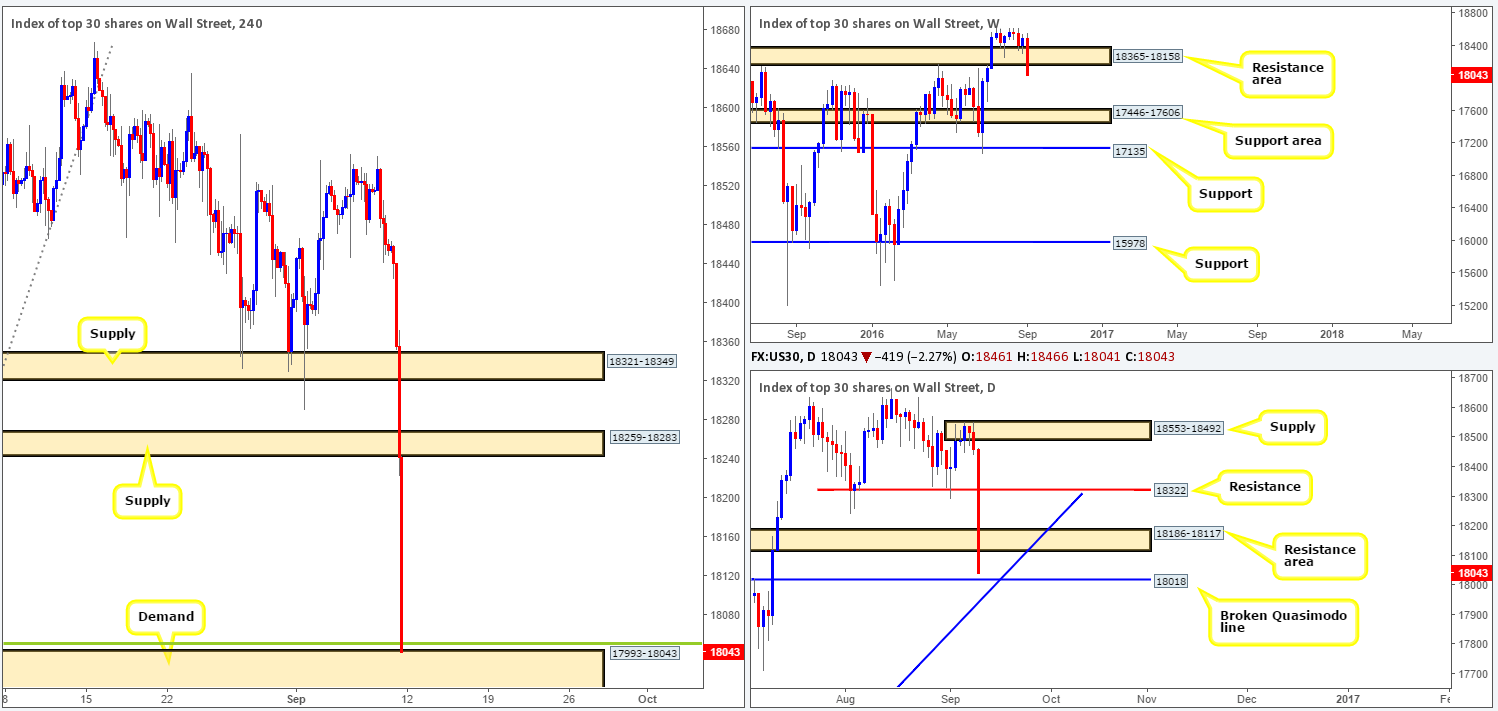
Weekly view: A succession of offers flowed into the market last week, resulting in prices punching through the support area at 18365-18158, consequently closing the week on its lows. Further selling from this point could potentially drag the equity market down to a support area carved from 17446-17606.
Daily view: Daily action on the other hand closed the week just ahead of a broken Quasimodo line at 18018 (converges with a trendline support extended from the low 15501). Support barriers such as these have a high tendency to bounce price, so do be prepared for a rotation back up to the underside of a resistance area at 18186-18117 (houses the lower edge of the above said weekly resistance area) sometime this week.
H4 view: A lot of eyebrows were likely raised on Friday following the aggressive selloff that took place. Concerns that the Fed may raise interest rates was thrown out there on Friday, causing US stocks to post its biggest single day’s loss since June 24. Several H4 tech supports were wiped out during this bearish onslaught, ending with price closing the week at the top of edge of a H4 (kink) demand seen at 17993-18043, which happens to surround the daily broken Quasimodo line at 18018 and merge with a H4 38.2% Fib support at 18050 (green line).
Direction for the week: Going by the weekly chart, one would likely guess that the candles are headed south given the strength of last week’s close. However, although we’re not expecting price to aggressively rally from the current H4 demand base, we do believe it will hold prices due to its connection with the daily broken Quasimodo level.
Direction for today: As already mentioned above, we feel higher prices are likely to transpire from the current H4 demand base.
Our suggestions: Despite the weekly chart, we are going to hunt for a buy entry around the H4 demand base today. We’ll be looking at the lower timeframes for confirmation in the form of either an engulf of supply followed by a retest or simply a collection of buying tails off of the H4 area prior to pulling the trigger. This will, at least for our team, be sufficient enough for us to condone a long entry, targeting the underside of the daily resistance area at 18117 as our immediate take-profit zone.
Levels to watch/live orders:
- Buys: 17993-18043 [tentative – lower timeframe confirmation required] (Stop loss: dependent on where one confirms this area).
- Sells: Flat (Stop loss: n/a).
GOLD:
Weekly gain/loss: + $3.5
Weekly closing price: 1327.7
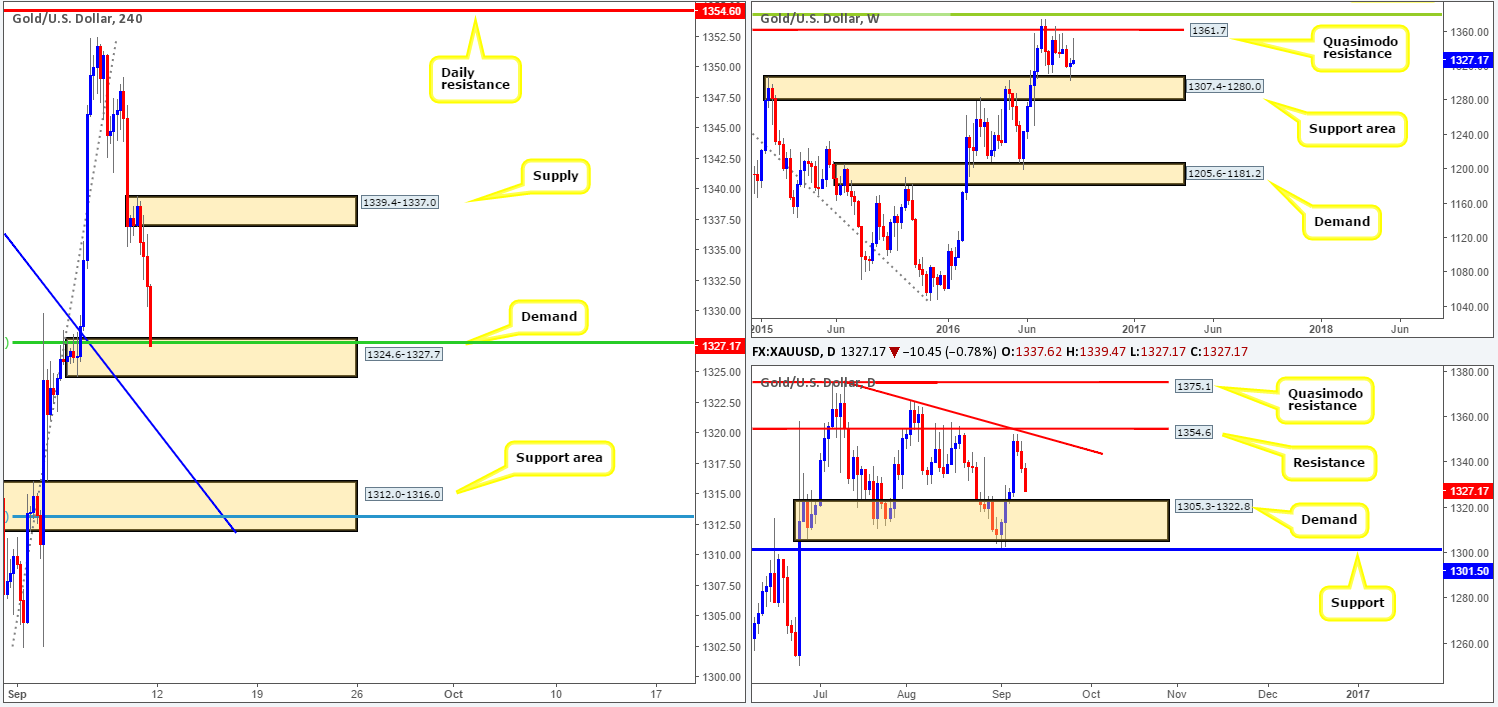
Weekly view: Given that price recently rebounded so beautifully off of the top edge of a support area at 1307.4-1280.0, our team expected a more decisive close to upside last week. In view of not seeing this, we do not see much to hang our hat on here at the moment other than to keep a close eye on both the aforementioned support area and the Quasimodo resistance barrier penciled in at 1361.7.
Daily view: Since the yellow metal topped out just ahead of resistance at 1354.6, we have seen the unit tumble lower for three consecutive days, closing the week out a few pips ahead of demand given at 1305.3-1322.8. This demand zone was, as you can see, already faked the week prior, which came so very close to tagging in support at 1301.5. So should price shake hands with this demand area this week, traders need to be prepared for the possibility that a fakeout may take place again.
H4 view: Across the board we saw the US dollar punch higher on Friday, consequently pushing the shiny metal down to a demand base drawn from 1324.6-1327.7 into the close. While this demand boasts strong momentum and converges with a 50.0% Fib support at 1327.4, we remain wary of this area. The reason? It sits just above the daily demand base at 1305.3-1322.8, which could potentially draw price below (fakeout) the current H4 area to tag in the top edge of the higher-timeframe barrier.
Direction for the week: Despite the possibility of a fakeout being seen through the current daily demand area, we believe downside will be capped here this week.
Direction for today: While the current H4 demand base could hold prices today, it is not an area we would stamp as a high-probability reversal zone. Therefore, we are opting to wait for a break of this zone and a continuation move down to the H4 support area seen at 1312.0-1316.0, which happens to merge with a H4 trendline support taken from the high 1355.9 and a H4 78.6% Fib support at 1313.1.
Our suggestions: Watch for a close below the current H4 demand area. From here we would not advise shorting due to how close price is sitting to the aforementioned daily demand area. The area that we would advise watching, nevertheless, is the H4 support zone mentioned above at 1312.0-1316.0. Not only does this beauty sport H4 structure confluence, it also sits within the current daily demand base! Be that as it may, we will not be looking to simply jump in here at market, since there is a risk of this area also being ignored as price may want to re-visit the top edge of the weekly support area discussed above. Be patient and WAIT for at least a H4 bullish close to form off of this H4 zone prior to pulling the trigger here guys!
Levels to watch/live orders:
- Buys: 1312.0-1316.0 [H4 bullish close required] (Stop loss: below the trigger candle).
- Sells: Flat (Stop loss: n/a).


