A note on lower timeframe confirming price action…
Waiting for lower timeframe confirmation is our main tool to confirm strength within higher timeframe zones, andhas really been the key to our trading success. It takes a little time to understand the subtle nuances, however, as each trade is never the same, but once you master the rhythm so to speak, you will be saved from countless unnecessary losing trades. The following is a list of what we look for:
- A break/retest of supply or demand dependent on which way you’re trading.
- A trendline break/retest.
- Buying/selling tails – essentially we look for a cluster of very obvious spikes off of lower timeframe support and resistance levels within the higher timeframe zone.
- Candlestick patterns. We tend to only stick with pin bars and engulfing bars as these have proven to be the most effective.
EUR/USD:
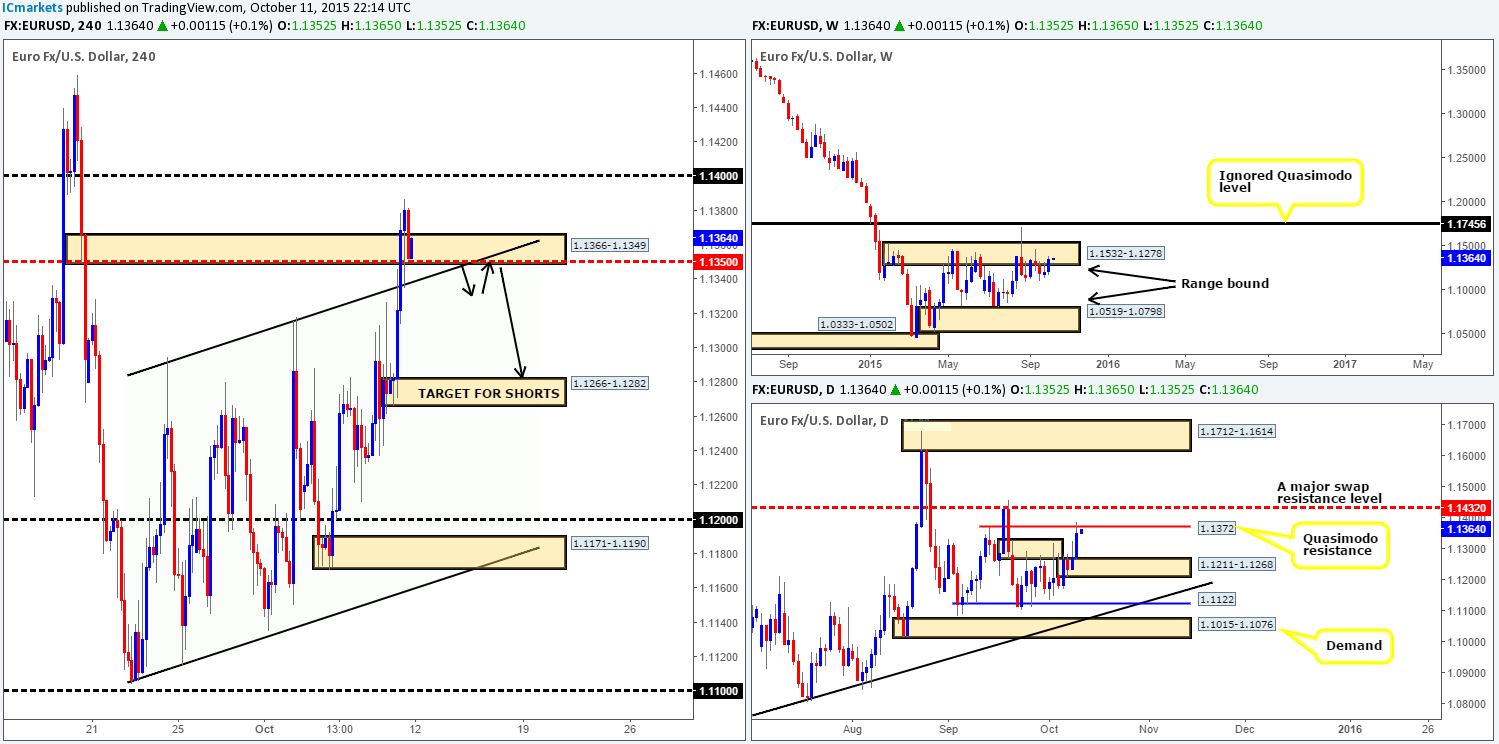
Weekly view:In the overall scheme of things last week’s 150-pip gain meant very little to us, as for the past six weeks now, the EUR pair has and continues to consolidate around the base of supply drawn from 1.1532-1.1278. Should price break above this zone in the coming week, the next objective to reach can be seen at 1.1745 – an ignored Quasimodo level. On the flip side, a continuation move lower would possibly see prices drive deeper into the weekly range down as far as demand coming in at 1.0519-1.0798.
Weekly levels to watch this week fall in at: 1.1532-1.1278/1.1745.
Daily view:As shown on the daily chart, candle action remained below supply at 1.1329-1.1269 for the best part of last week. It was only as we moved into Friday’s session did price catapult itself above the aforementioned supply and connect with a Quasimodo resistance barrier at 1.1372. This level – coupled with the major swap resistance line just above it at 1.1432 forms a relatively tight sell zone to keep an eye on this week.
Daily levels to watch this week fall in at: 1.1372/1.1432/1.1211-1.1268.
4hr view:(Stopped out on our short 1.13465)
Going into Friday’s London session, we can see that the EUR currency came to life. Price rallied over 100 pips taking out both channel resistance (1.1294) and 4hr supply coming in at 1.1366-1.1349, before reaching highs of 1.1387 on the day.
With no change seen at this morning’s open 1.1352, price remains trading within the recently broken supply (now demand) at 1.1366-1.1349. At the time of writing, there appears to be active bids residing within this zone, and this could possibly push this pair up to Friday’s high today or even psychological resistance 1.1400 given enough time. Be that as it may, entering long from here is not something that interests our team. Sure, price may rally, but it will only likely be for a small bounce at best. Our reasoning lies within the higher timeframe structures. Both the weekly and daily timeframes are currently trading around resistances (see above), which, in our opinion, may be enough to pressure this pair southbound this week.
Therefore, our prime focus today, and maybe even tomorrow as well, will be on watching for price to break back into the upward trending channel (1.1294/1.1104). Ultimately though, before any shorts are considered, we’d want to see a confirmed retest of the mid-level number 1.1350 as per the black arrows.
Levels to watch/live orders:
- Buys: Flat (Stop loss: N/A).
- Sells:Watch for bids at 1.1350/1.1330 to be consumed and look to enter on any retest seen at this area (confirmation required).
GBP/USD:
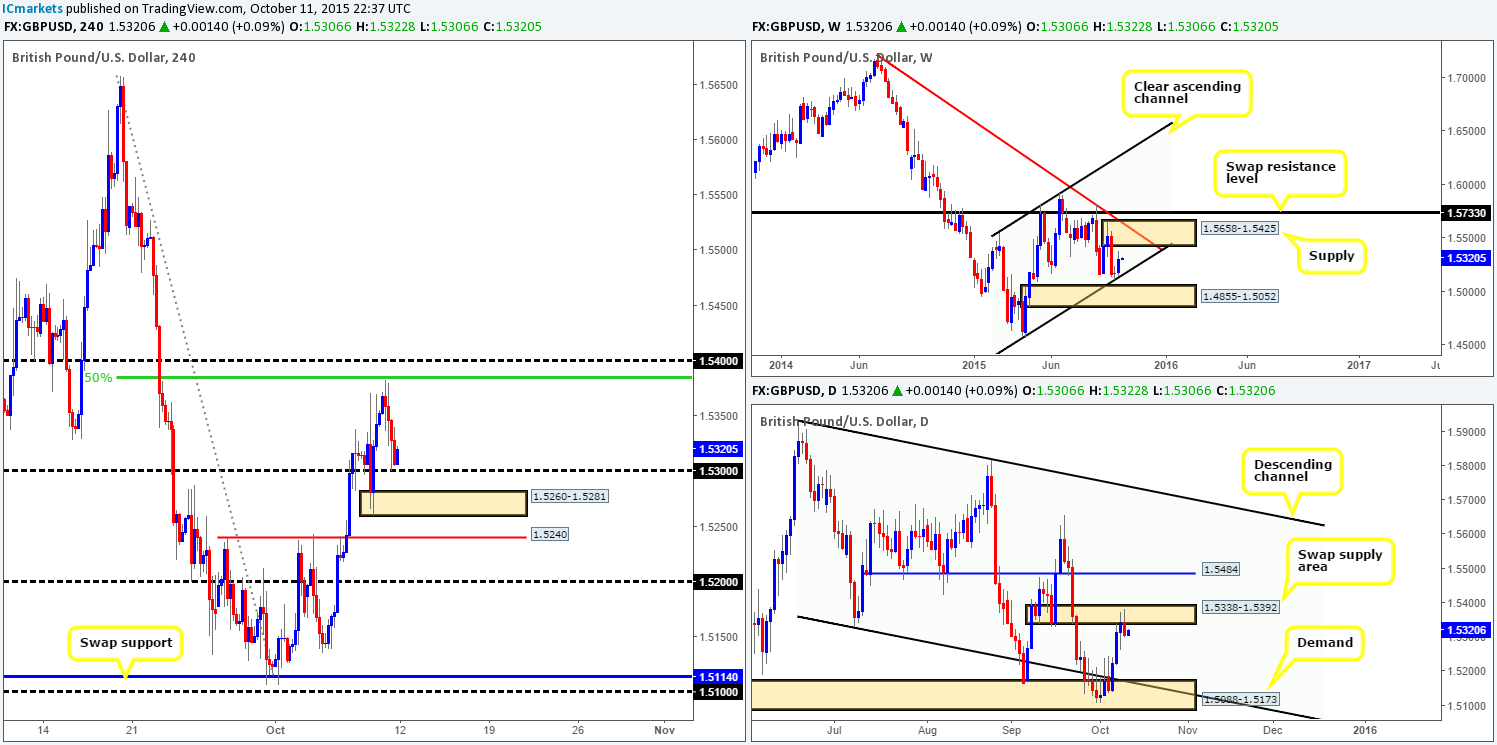
Weekly view:Following the small indecision candle printed off the back of channel support (1.4564); Cable advanced a little over 130 pips during trade last week, forcing price to close at 1.5306. Should the buyers remain strong this week, there is, as far as we see, potential for price to continue rallying up to supply coming in at 1.5658-1.5425, followed closely by a swap resistance level at 1.5733.
Weekly levels to watch this week fall in at: Channel support (1.4564)/1.5658-1.5425/1.5733.
Daily view:From the daily scale, however, we can see that candle action met with a swap supply area going into Thursday’s trade at 1.5338-1.5392, which also remained strong during Friday’s session. Supposing that this zone remains well-offered this week, there is very little in the way of support below current price stopping this market from falling this week back down to demand at 1.5088-1.5173. It will be interesting to see what the 4hr timeframe has to offer…
Daily levels to watch this week fall in at: 1.5338-1.5392/1.5088-1.5173.
4hr view:Unlike the EUR/USD, the GBP/USD 4hr action took a turn for the worst during Friday’s sessions. Price sold off from just below the 50.0% Fibonacci level at 1.5384 down to the 1.5300 handle by the weeks end.
The open 1.5306, however, has so far seen the buyers defend 1.5300, which could very well continue today/tomorrow since there is room to move north on the weekly timeframe (see above in bold). However, before we all go hitting the buy button, let’s not forget that although there’s room to move higher on the weekly scale, daily action shows price lingering below supply right now (see above in bold).
Given the clear difference of opinion on the higher timeframe structures at the moment, this is a difficult and potentially risky pair for us to trade unfortunately. As such, our team has decided to remain flat during today’s sessions.
Levels to watch/ live orders:
- Buys: Flat (Stop loss: N/A).
- Sells: Flat (Stop loss: N/A).
AUD/USD:
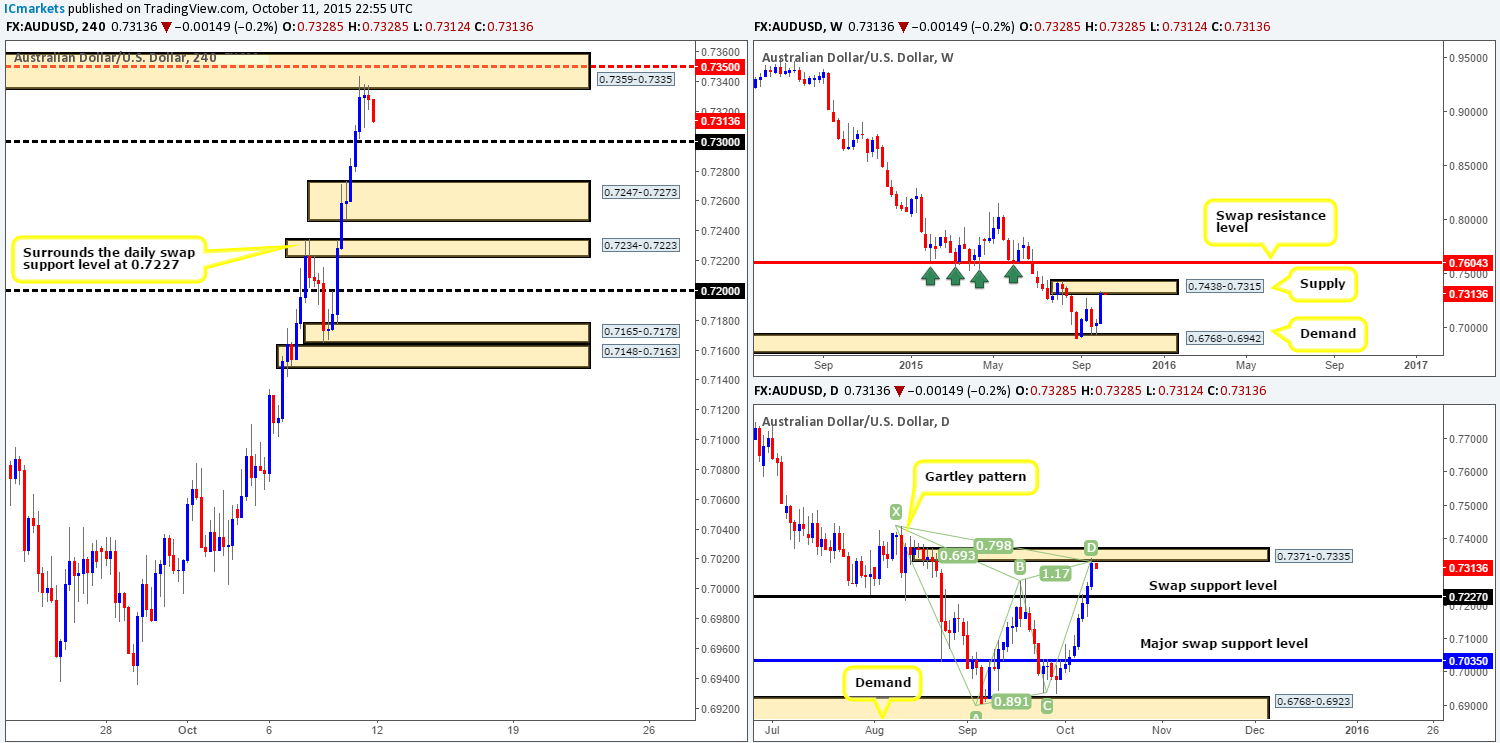
Weekly view: The AUD/USD had a spectacular week, gaining around 280 pips into the close 0.7328. Consequent to this, price ended the week kissing the underside of supply given at 0.7438-0.7315, which could potentially put a halt on this recent surge in buying this week. Conversely, should the buyers continue to maintain position here, the next area to keep a tab on comes in at 0.7604 – a swap resistance level.
Weekly levels to watch this week fall in at:0.7438-0.7315/0.7604.
Daily view:Moving down to the daily timeframe, one can see just how impressive the Aussie has been over the past two weeks! Friday’s action saw the buyers print an eighth consecutive bull candle, resulting in price connecting with a small supply zone drawn from 0.7371-0.7335. In addition to this, the underside of this supply marks the completion point of a Harmonic Gartley pattern. In the event that a rebound is seen from here this week, traders will likely be watching the swap support level below at 0.7227 for their first take-profit target.
Daily levels to watch this week fall in at:0.7371-0.7335/0.7227.
4hr view: From the word go, both Thursday and Friday’s sessions were nothing but blue candles! Friday’s session rallied a respectable 84 pips, consuming offers at psychological resistance 0.7300 and connecting with a nice-looking supply drawn from 0.7359-0.7335 at the week’s close.
Supporting this 4hr supply zone, there is, as noted above in bold, supporting higher timeframe structure. This – coupled with a stable open (0.7328), was enough to convince us to take a short at market getting filled at 0.73259 with our stop placed above supply at 0.73620. Granted, it is a relatively big stop, but we are, at least from a technical standpoint, expecting a rather large sell-off from here this week.
Levels to watch/ live orders:
- Buys:Flat (Stop loss: N/A).
- Sells: 0.73259 [LIVE] (Stop loss: 0.73620).
USD/JPY:
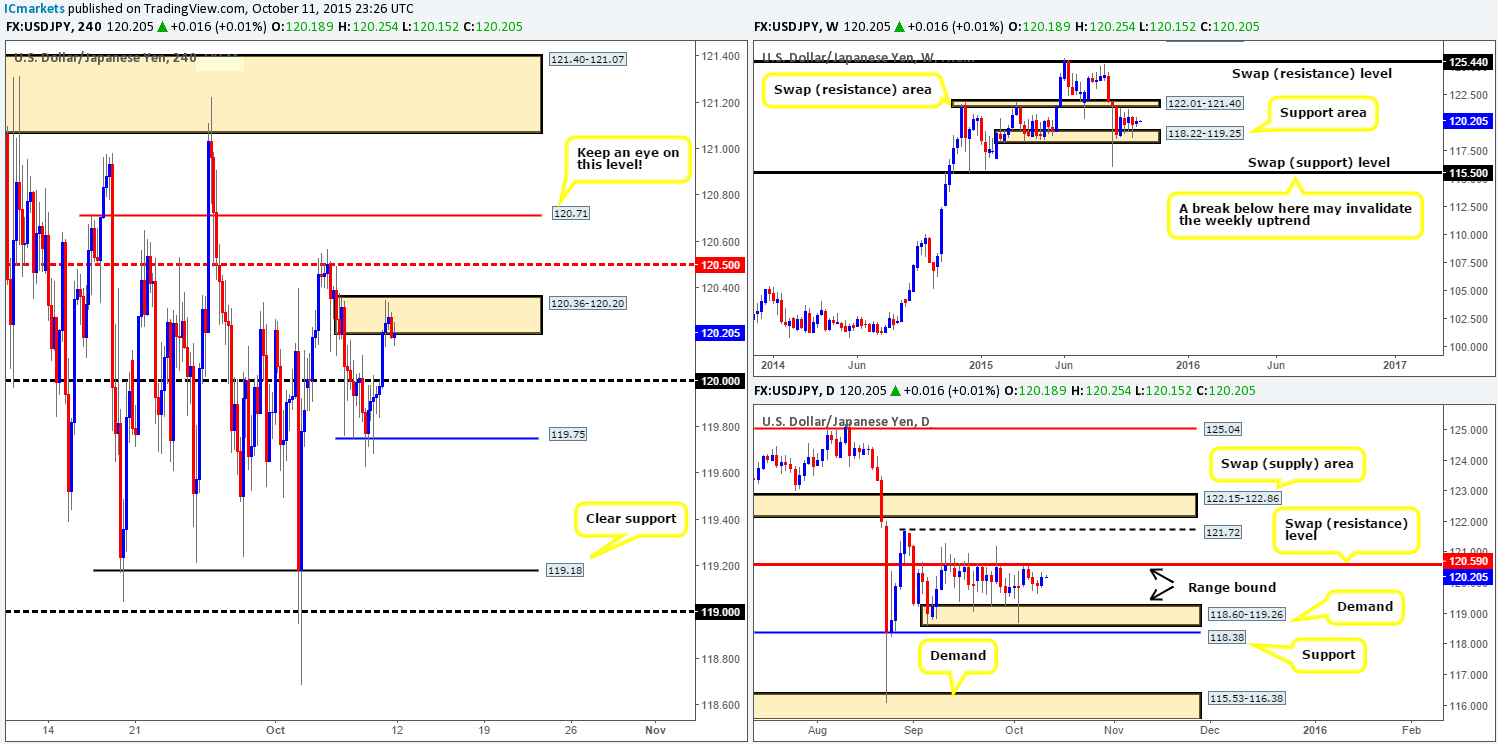
Weekly view: Watching the weekly chart of the USD/JPY has become quite a monotonous task! There is, once again, very little to report on last week’s action, as the market continues totrade in between a swap resistance zone at 122.01-121.40 and a support area drawn from 118.22-119.25.
Weekly levels to watch this week fall in at:122.01-121.40/118.22-119.25.
Daily view:With little change being seen on the weekly timeframe last week, we can see that price also remained confined on this timeframe between demand at 118.60-119.26 and a swap resistance level at 120.59. A breakout above here this week would likely see this market head towards at least swing resistance at 121.72, followed closely by a swap supply zone at 122.15-122.86. On the other hand, a push lower would immediately see price shake hands with support coming in at 118.38.
Daily levels to watch this week fall in at:118.60-119.26/118.38/120.59/121.72/122.15-122.86.
4hr view:Friday’s action began with the bulls pressing forward, which, as you can see, took out offers at psychological resistance 120.00. It was only once price connected with supply at 120.36-120.20 mid-way through London trade, did we see things begin to stabilize into the week’s close 120.18.
In view of the current situation on the higher timeframes (both consolidating – see above), our team has come to a general consensus that no trade will be permitted on this pair this week UNLESS it converges with the higher timeframe extremes, as price has been far too choppy for our liking recently.
With that, battle lines from this week’s open 120.18 are as follows:
Buys:
- 119.00/119.18. A clear support that coincides beautifully with both the above said weekly and daily demands (see above).
Sells:
- Mid-level resistance 120.50. This beauty not only lines up nicely with the aforementioned daily upper range limit, but also has already proved its worth back on the 06/10/15 at 120.56.
- 120.71. This level is practically a hidden left shoulder. Since these levels usually see a bounce and considering the fact that it sits just above the daily 120.59 level, we think it deserves its place on this list.
Levels to watch/ live orders:
- Buys:119.00/119.18 [Tentative – confirmation required] (Stop loss: dependent on where one confirms this level).
- Sells:120.50 [Tentative – confirmation required] (Stop loss: dependent on where one confirms this level) 120.71 [Tentative – confirmation required] (Stop loss: dependent on where one confirms this level).
USD/CAD:
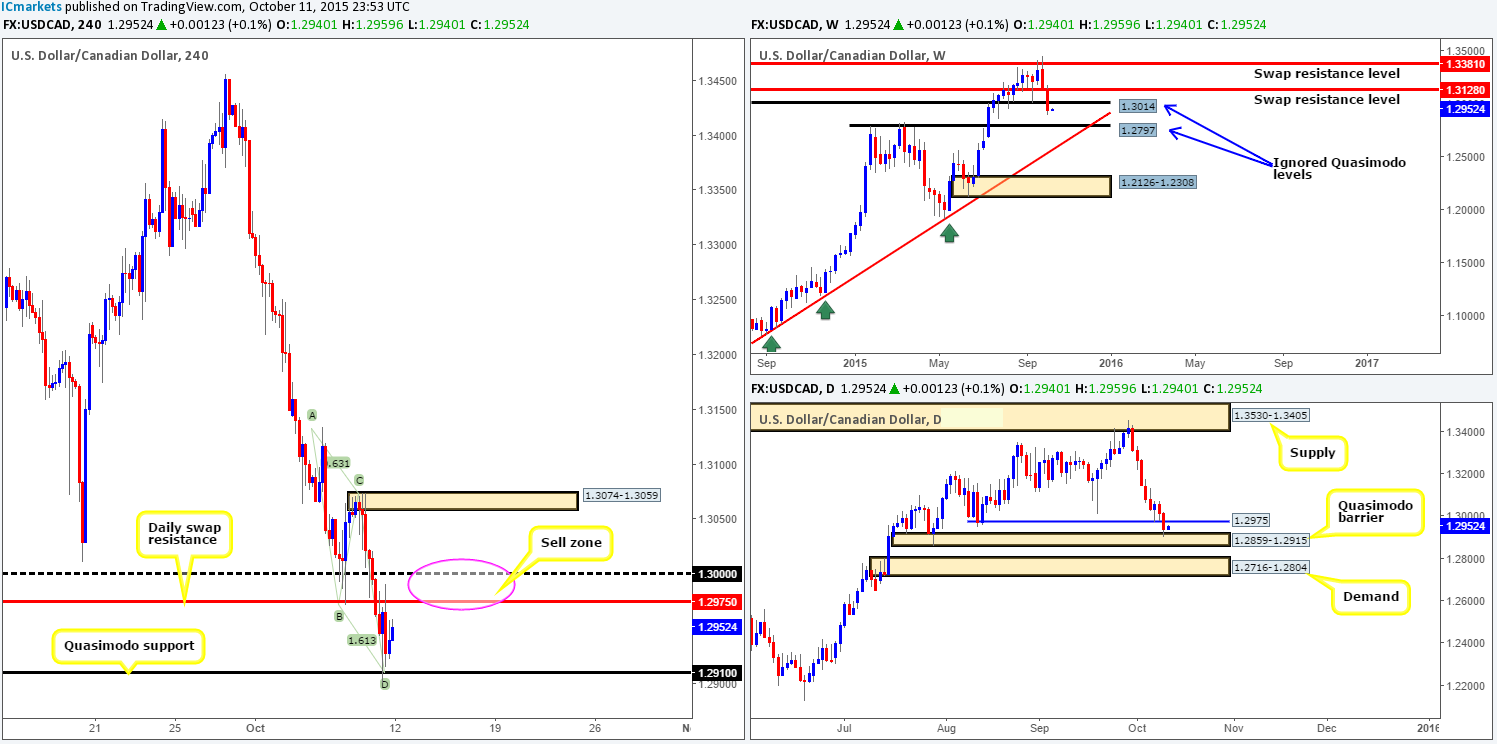
Weekly view: Last week’s sharp run to the downside pushed the USD/CAD into further losses, stripping a little over 200 pips off its value at the close 1.2940. As a result, both the swap support level at 1.3128 and the ignored Quasimodo support at 1.3014 were taken out, thus potentially opening the gates to further downside this week towards another ignored Quasimodo hurdle sitting at 1.2797.
Weekly levels to watch this week fall in at: 1.3014/1.3128/1.2797.
Daily view:From this viewpoint, it’s clear to see that daily buyers attempted to counter-attack on Wednesday from support at 1.2975, but failed miserably as price stormed below this leveland hit a Quasimodo base area at 1.2859-1.2915 by the weeks end. On the assumption that this Quasimodo area holds this week, traders need to be careful entering long from here since problematic offers may reside at 1.2975. On the flip side, should the sellers continue to batter this pair lower, all eyes will be on demand coming in at 1.2716-1.2804.
Daily levels to watch this week fall in at:1.2859-1.2915/1.2975/1.2716-1.2804.
4hr view:As can be seen from the 4hr chart, price collided with active bids around Quasimodo support at 1.2910 (converged nicely with an AB=CD bull pattern) going into the American session on Friday, which is currently holding this market higher.
Breaking into a new week, the USD/CAD opened with no change at 1.2940. Despite this, active bids have already been seen coming into the market. In the event that this continues, we believe price will connect with the daily swap resistance level at 1.2975, or possibly even the large psychological number 1.3000 given enough time.
This is where it gets interesting… Assuming price does indeed continue to appreciate and trades to within 1.2975/1.3000, this, in our opinion, may be the time to begin considering shorts in this market. Reason being is at that point,we see resistance from the following structures:
- The ignored weekly Quasimodo level at 1.3014.
- The aforementioned daily swap resistance barrier.
- Large psychological resistance 1.3000.
However, there is a snag. Price has just recently shook hands with a daily Quasimodo barrier at 1.2859-1.2915 which could be problematic. Therefore, the best, and in our opinion, only way to deal with this, is to wait for a lower timeframe confirming setup to form in between the 1.2975/1.3000 region before committing capital.
Levels to watch/ live orders:
- Buys: Flat (Stop loss: N/A).
- Sells: 1.2975/1.3000 [Tentative – confirmation required] (Stop loss: dependent on where one confirms this area).
USD/CHF:
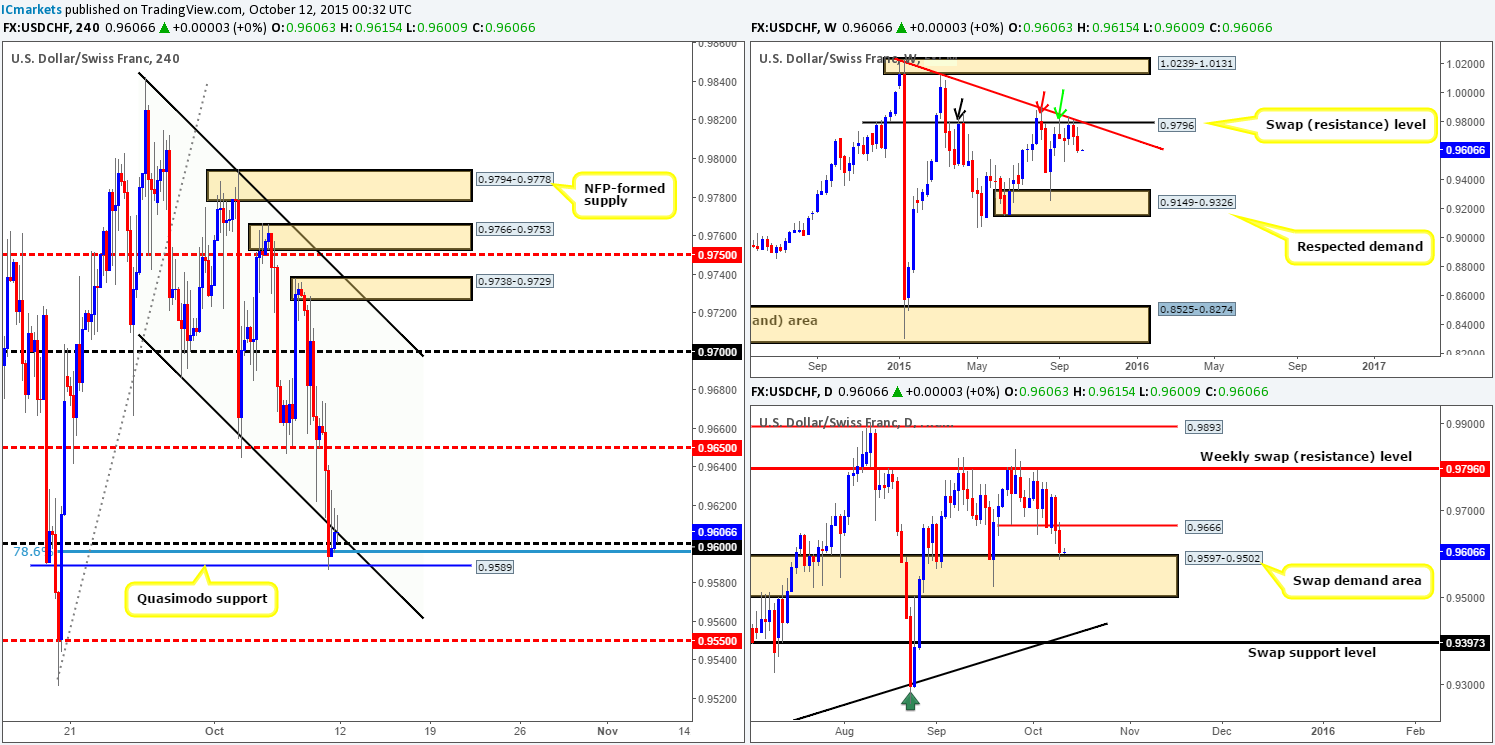
Weekly view:The rebound from the swap resistance level at 0.9796 saw the market extend lower last week, erasing 100 pips of value into the close 0.9606. In spite of this, the validity of this level still remains in question for us. Here’s why: The initial rebound from this resistance seen way back on the 13/04/15 (black arrow) at 0.9861 was strong. The second (red arrows) at 0.9902, even though still considered a strong move lower by our standards did, however, not break lower than the previous drive. The third (green arrow) at 0.9822 was relatively week, reaching lows of only 0.9526, thus potentially indicating bullish strength.
Weekly levels to watch this week fall in at: 0.9796/0.9526.
Daily view:Turning our attention to the daily timeframe, however, we can see that in order for the weekly sellers to push lower, the swap demand area at 0.9597-0.9502 will need to be taken out. In the case that this zone does indeed see a break, the next level in the firing range sits at 0.9397 – a swap support. On the flip side, should supportive pressure be seen here, offers will likely be sitting at the minor swap resistance 0.9666.
Daily levels to watch this week fall in at:0.9597-0.9502/0.9397/0.9666.
4hr view: Throughout London trade on Friday the USD/CHF aggressively sold off, consequently faking below channel support (0.9686) into Quasimodo support drawn from 0.9589. The rebound from this level was not what we would consider a legit bounce to be honest. In fact, this could have merely been traders squaring positions off into the weekend.
Going forward, the open 0.9606 saw no change going into this week’s trade. Given what we have logged above, higher timeframe technical elements certainly appear mixed at the moment. In consequence, the 0.9600 region will play a key role in our decision-making process today and quite possibly into tomorrow as well…
Should price remain bid above 0.9600 today anda lower timeframe buy setup is spotted, we may consider a long from here, targeting the mid-level resistance 0.9650 (16 pips below the aforementioned daily swap resistance level). In the event that 0.9600 is taken out, however, there may be a potential shorting opportunity on the retest of 0.9600 down to mid-level support 0.9550.
Levels to watch/ live orders:
- Buys: 0.9600 [Tentative – confirmation required] (Stop loss: dependent on where one confirms this level).
- Sells: Watch for bids at 0.9600 to be consumed and look to enter on any retest seen at this level (confirmation required).
DOW 30:
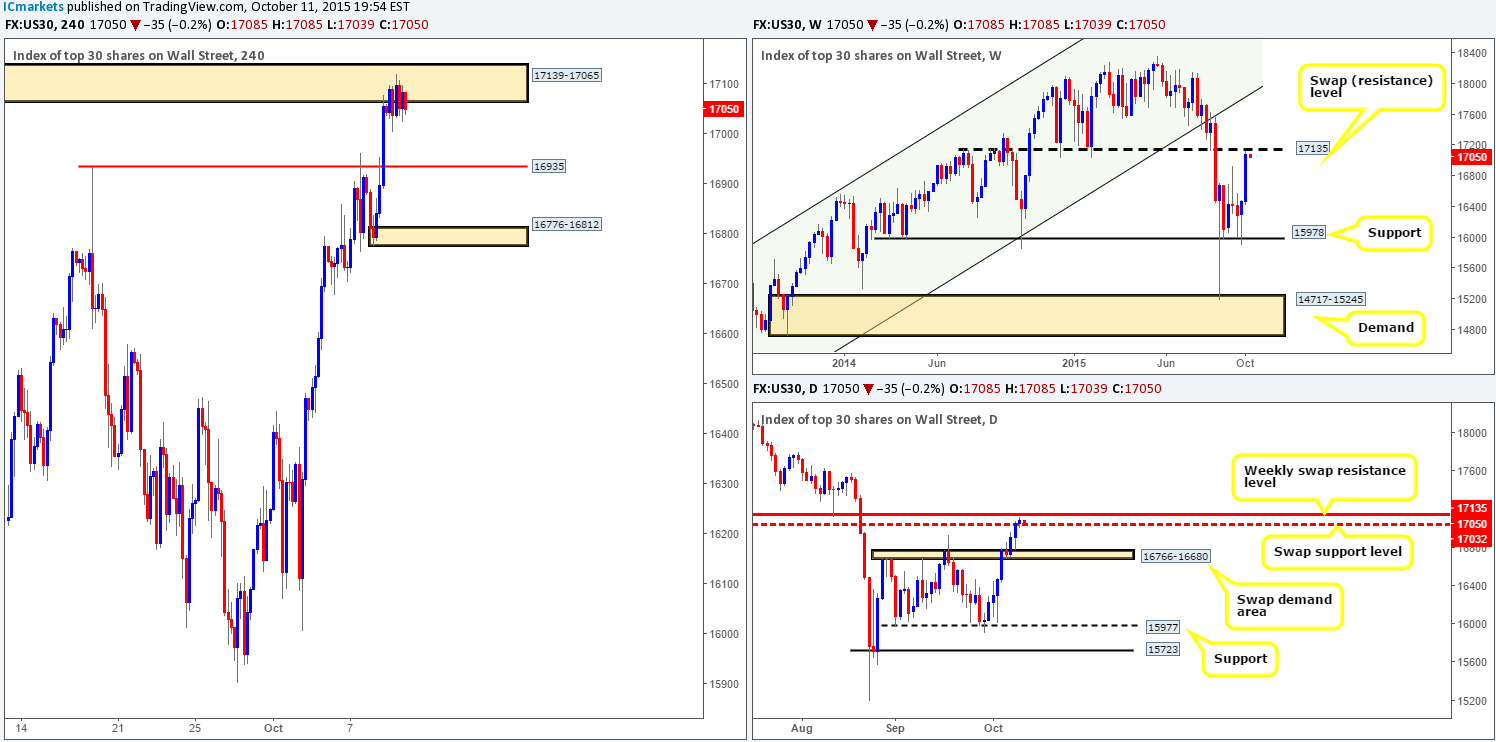
Weekly view: Following the pin rebound off support at 15978 the DOW screamed north last week, gaining a little over 600 points by the close 17085. However, we see trouble ahead. Traders who believe this rally will continue this week may want to check out the clear swap resistance level drawn from 17135, as this could potentially put a halt on any further buying right now.
Weekly levels to watch this week fall in at: 15978/17135.
Daily view:Down on the daily timeframe, nonetheless, we can see that price recently closed above and retested a swap resistance level at 17032, consequently forming an indecision candle. With this relatively weak retest, and the fact that the aforementioned weekly swap (resistance) level is looming just above, traders considering longs on the basis of this retest should tread very, very carefully here!
In the event that the recent break above 17032 was indeed just a fakeout, price will likely drive lower to connect with the swap demand zone at 16766-16680. Let’s see what the 4hr timeframe has to say on the matter…
Daily levels to watch this week fall in at:17032/17135/16766-16680.
4hr view:The DOW, as you can see, fell into a phase of stagnation during Friday’s sessions within supply given at 17139-17065. While the open 17085 saw no change, this market is, at least from a technical standpoint, considerably overbought in our opinion (see above in bold).
To that end, our objective for today and possibly into tomorrow is simple. Watch for lower timeframe selling confirmation within the current 4hr supply zone, targeting 16935 first and foremost. The reason for requiring confirmation at this area simply comes down to the daily timeframe recently closing above a resistance level at 17032. We do not expect this daily level to cause too much of a problem, but one can never be too careful!
Levels to watch/ live orders:
- Buys: Flat (Stop loss: N/A).
- Sells:17139-17065 [Tentative – confirmation required] (Stop loss: dependent on where one confirms this area).
XAU/USD: (Gold)
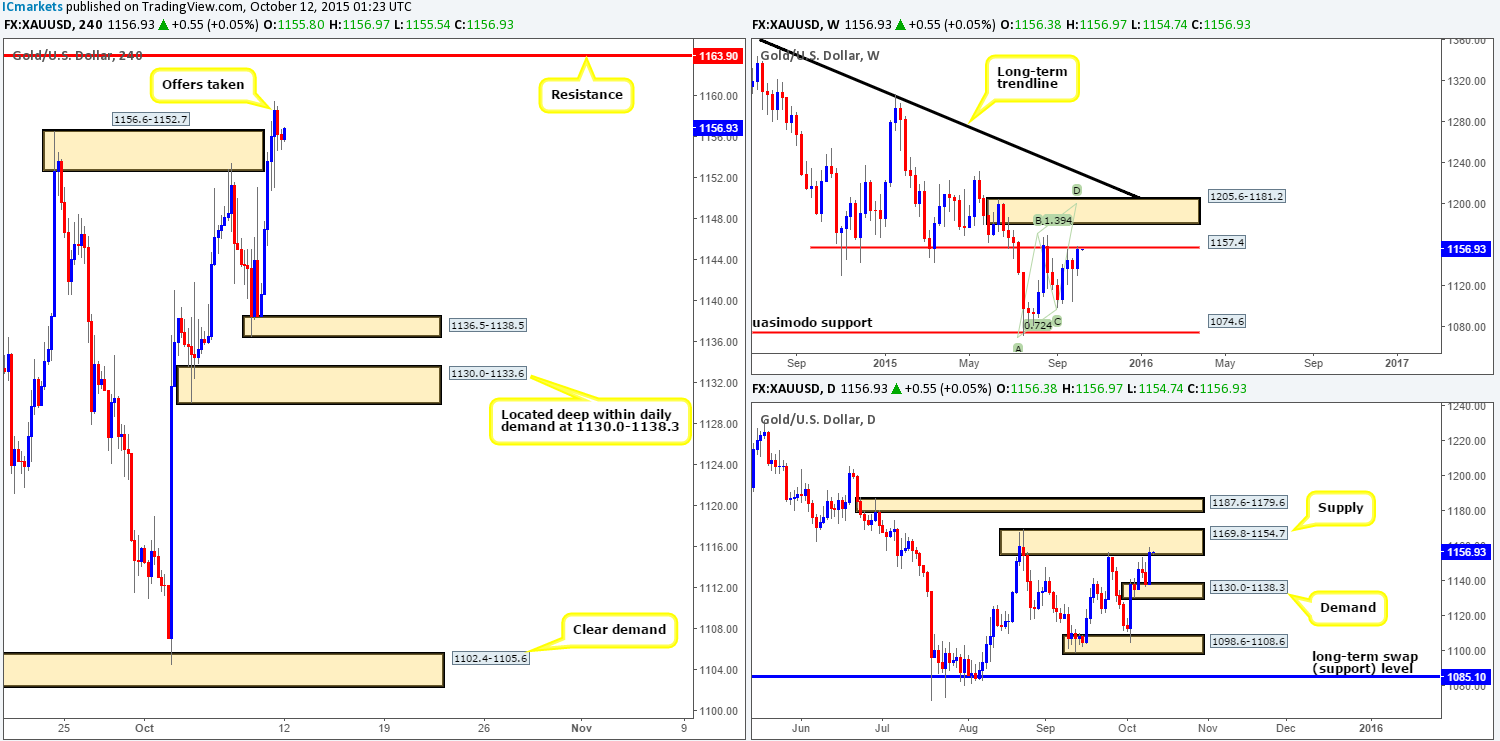
Weekly view:Last week’s action saw Gold increase its value by $18 into the close 1156.3, which, as you can see, brought price back up into the jaws of a swap resistance level at 1157.4. Given the somewhat lackluster response seen from here, 1157.4 could give way this week andsee this market head in the direction of supply taken from 1205.6-1181.2. This area, in our book, is a perfect zone to look for shorts. It not only converges with a bearish Harmonic AB=CD pattern (1199.4), but also with the underside of a long-term trendline extended from the high 1488.0.
Weekly levels to watch this week fall in at: 1157.4/1205.6-1181.2.
Daily view:Recent daily action shows that price rebounded wonderfully on Friday from a small demand zone at 1130.0-1138.3, ending the week with price driving north to connect with supply at 1169.8-1154.7. Evidently, for the weekly buyers to continue pushing this market north, offers at this supply would have to be cleared. This, in turn, would possibly clear the path north up to daily supply taken from 1187.6-1179.6, which, incidentally, sits within the lower limits of the aforementioned weekly supply zone.
Daily levels to watch this week fall in at:1130.0-1138.3/1169.8-1154.7/1187.6-1179.6.
4hr view:From this angle, Friday’s candle action saw the price of Gold rally considerably during the early hours of trade. This, as shown on the chart, continued throughout most of the day, and ended with price taking out offers sitting around supply at 1156.6-1152.7.
This morning’s open 1156.3 made little to no difference to the overall structure of the 4hr timeframe. As such, where do we see this market heading today and possibly into the week? Well, for us, the break above the current 4hr supply has given clear direction that Gold likely wants to cross swords with 4hr resistance coming in at 1163.9. However, as we already know from our analysis above, the higher timeframes are trading around considerable resistance right now (see above). This, as you can imagine, certainly casts a cloud over any longs for the time being!
Given all of the points made above, our team has decided that instead of looking to buy this market up to, we’re going to focus our energy on selling it if, or indeed when, price hits 1163.9. Since, at that point, Gold will be trading around clear resistance points from the weekly down to the 4hr scale.
Levels to watch/ live orders:
- Buys: Flat (Stop loss: N/A).
- Sells:1163.9[Tentative – confirmation required] (Stop loss: dependent on where one confirms this level).


