EUR/USD:
Weekly gain/loss: -0.07%
Weekly closing price: 1.2303
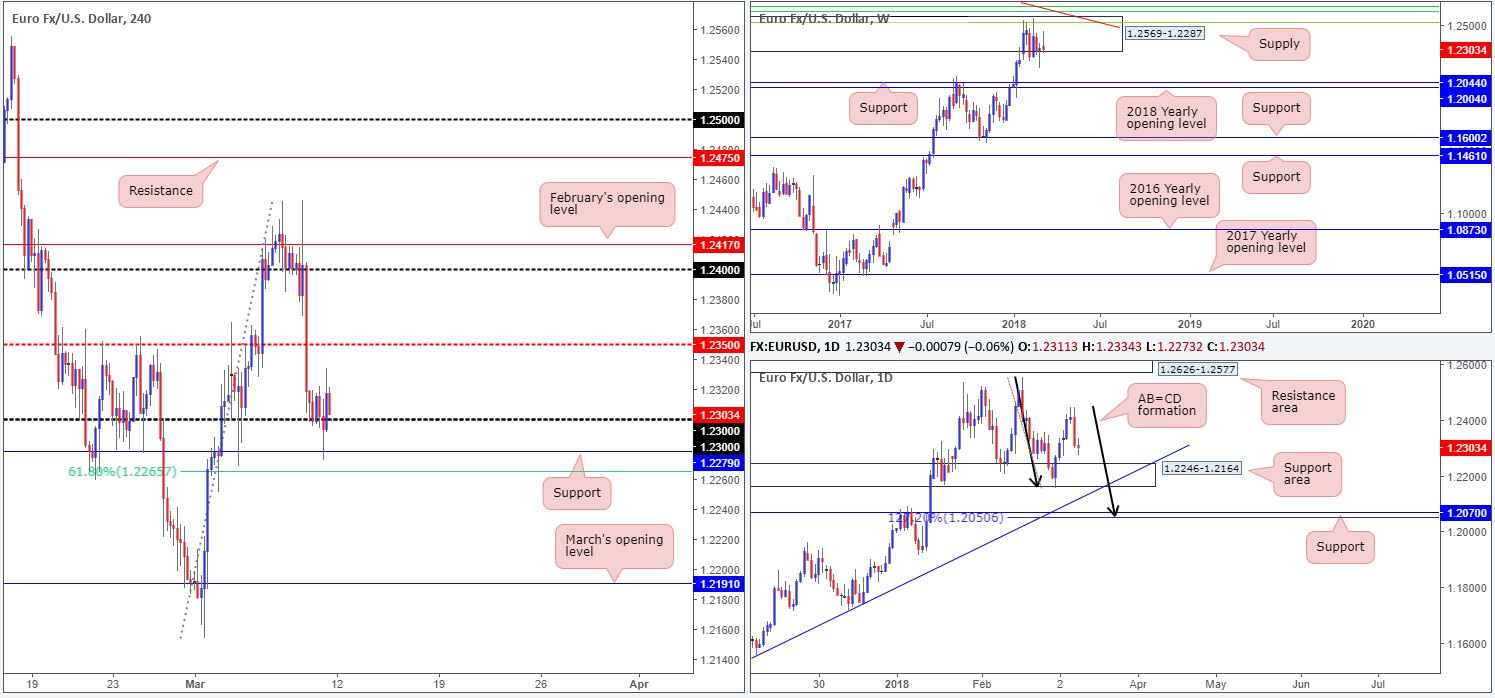
The EUR/USD concluded the week effectively unchanged, despite ranging over 170 pips. Since late January, upside has been capped by a major-league weekly supply zone coming in at 1.2569-1.2287. What’s also notable from a technical perspective here is the weekly Fibonacci resistance cluster (see below for the values) and long-term weekly trendline resistance (extended from the high 1.6038) positioned around the top limit of the said weekly supply. Should sellers crank it up a gear this week, downside targets fall in around the weekly support band at 1.2044, shadowed closely by the 2018 yearly opening level at 1.2004.
- 61.8% Fib resistance at 1.2604 taken from the high 1.3993.
- 50.0% Fib resistance at 1.2644 taken from the high 1.4940.
- 38.2% Fib resistance at 1.2519 taken from the high 1.6038.
The story on the daily timeframe, nevertheless, reveals that the major has been interacting with a daily support zone seen at 1.2246-1.2164. Also seen nearby is a daily trendline support etched from the low 1.0569 and daily support at 1.2070 – note that this level fuses nicely with a daily AB=CD (black arrows) 127.2% Fib ext. point at 1.2050. Traders are advised to keep close tabs on these areas as we move into the new week.
Friday’s US headline payrolls created 313k jobs in the month of February, vastly surpassing expectations. However, the pace of wage growth eased. The overall market impact was, therefore, subdued. H4 movement challenged nearby H4 support at 1.2279 and formed a H1 indecision candle. The day concluded a few pips north off 1.23 after modestly grinding lower from session highs of 1.2334.
Potential trading zones:
According to our analysis, the sellers, despite trading within a major weekly supply right now, have plenty of work to do should they intend on pressing lower this week. The top edge of the daily support area at 1.2246, coupled with a 61.8% H4 Fib support at 1.2265, a H4 support at 1.2279 and the round number 1.23, offers substantial downside support within a 50-pip range. As you can see, trading this market medium/long-term is challenging.
In view of this, neither a long nor short seems attractive at this time. This is where the most important trading skill comes into play: PATIENCE.
Data points to consider: No high-impacting news on the economic calendar.
Areas worthy of attention:
Supports: 1.23 handle; 1.2246-1.2164; daily trendline support; 1.2050/1.2070; 1.2004/1.2044.
Resistances: 1.2350; 1.2569-1.2287; weekly trendline resistance; weekly Fib resistances.
GBP/USD:
Weekly gain/loss: +0.35%
Weekly closing price: 1.3849
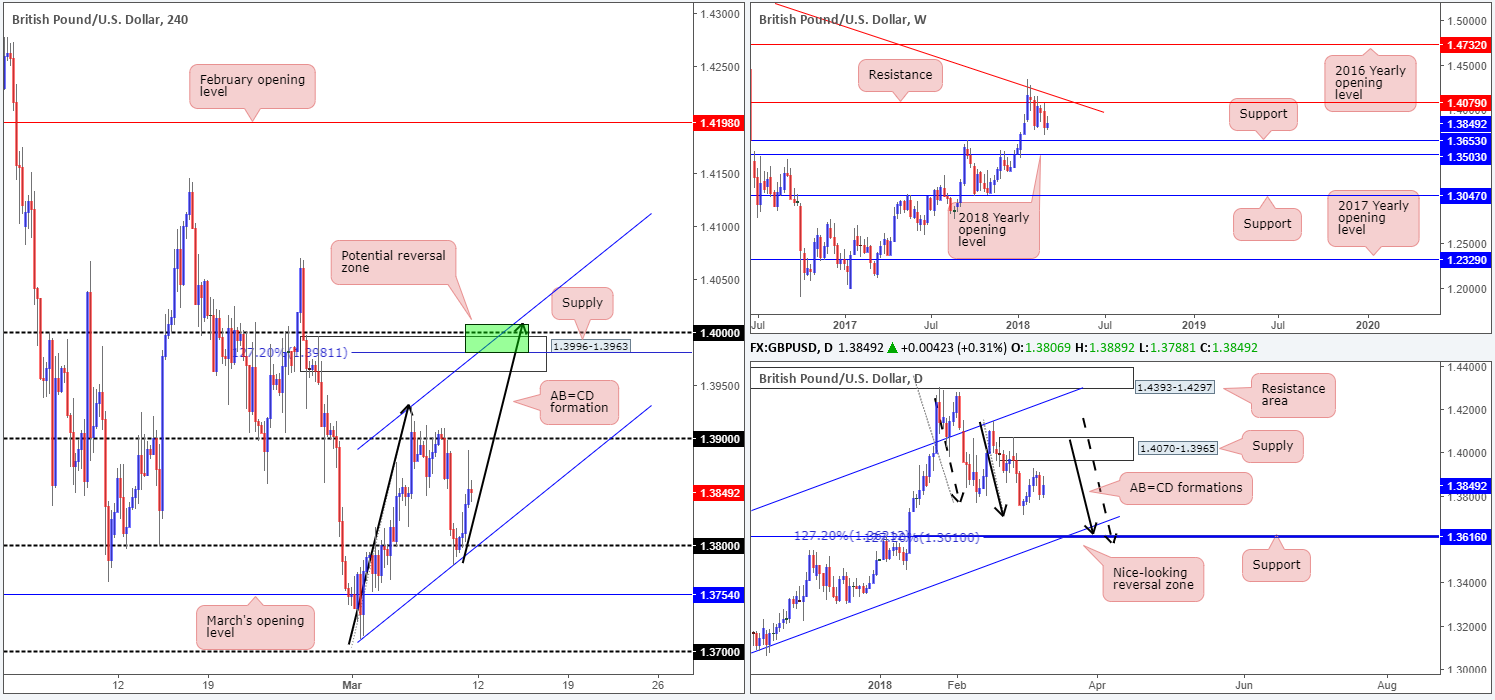
After a substantial downside push the week prior, GBP/USD bulls made an attempt to recover last week but failed to gain much ground. As is evident from the weekly timeframe, the pair remains trading within striking distance of a weekly support level at 1.3653 and the nearby 2018 yearly opening level at 1.3503. Therefore, make sure to keep an eyeball on these levels going forward.
Looking at things a little lower on the curve we can also see some interesting support materializing. Daily support at 1.3616 boasts a solid collection of confluence: a merging daily channel support taken from the low 1.2108 and two daily AB=CD (see black arrows) 127.2% Fib ext. points! This area is even more appealing given that it is located less than 40 pips beneath the weekly support level mentioned above at 1.3653.
Since late Thursday, the unit was reasonably well-bid from 1.38 on the H4 timeframe. Friday’s US payrolls did little to alter its path. H4 flow mildly pared gains going into the weeks close, leaving 1.39 unchallenged and chalking up a rather dominant selling wick.
Potential trading zones:
On the daily timeframe, the support mentioned above at 1.3616 is of interest this week for potential longs.
On the H4 timeframe, however, the large psychological band 1.40 is also of interest for possible shorts – the 1.4008/1.3981 area to be more specific (green zone). Besides this level being a widely watched number, seen nearby is also a fresh H4 supply area at 1.3996-1.3963, a H4 channel resistance taken from the high 1.3929 and a H4 AB=CD (black arrows) 127.2% Fib ext. point at 1.3981.
As price is trading a fair distance from the aforementioned zones, identifying take-profit levels is tricky at this time.
Intraday traders may also be interested in longs above 1.39, targeting the H4 sell zone. As always, though, it’s best to allow price to retest these numbers before pulling the trigger. Being caught in a fakeout is never fun!
Data points to consider: No high-impacting news on the economic calendar.
Areas worthy of attention:
Supports: 1.38 handle; 1.3616; daily channel support; 1.3653/1.3503.
Resistances: 1.39 handle; 1.4008/1.3981.
AUD/USD:
Weekly gain/loss: +1.08%
Weekly closing price: 0.7846
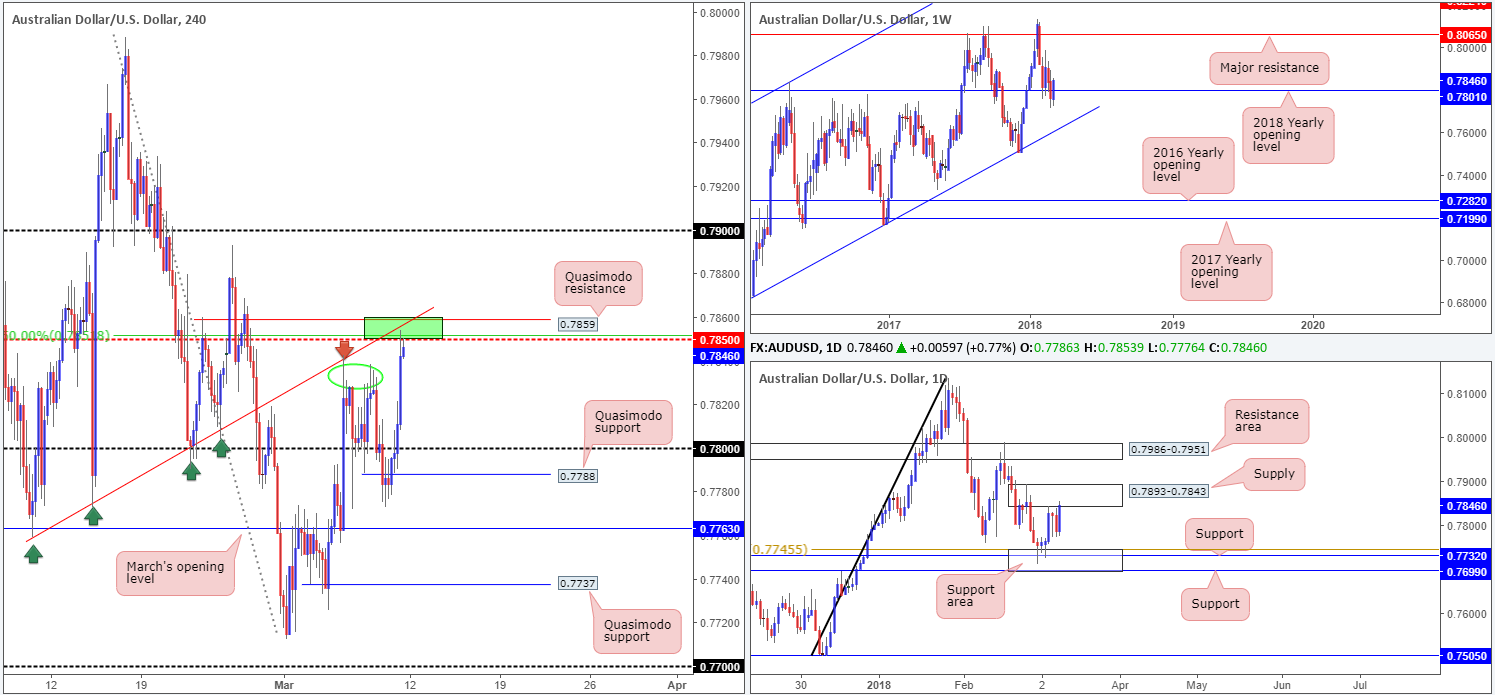
The AUD/USD posted a strong week of gains in recent trade, recouping all of the prior week’s losses and reclaiming the 2018 yearly opening level on the weekly timeframe at 0.7801. Continued buying from this point could eventually see the commodity currency cross swords with a major weekly resistance level seen at 0.8065. This level commands respect as it has provided significant support/resistance since mid- 2010! Before weekly buyers can press higher, nonetheless, the daily supply zone at 0.7893-0.7843 will need to be taken care of!
A quick recap of Friday’s action on the H4 timeframe saw the Australian dollar rally against its US counterpart, following an upbeat non-farm payrolls number. US wage growth came in less than stellar, weighing on the greenback. H4 price sliced through 0.78, attacked H4 tops seen around the 0.7840ish range (green circle) and concluded the day closing just shy of the H4 mid-level resistance at 0.7850.
Potential trading zones:
The H4 mid-level resistance at 0.7850 has been noted as a particularly interesting base, due to its surrounding confluence. The number boasts the following structures:
- H4 trendline resistance taken from the low 0.7758.
- H4 Quasimodo resistance at 0.7859.
- H4 50.0% resistance value at 0.7852.
- Seen within the lower limits of the current daily supply zone at 0.7893-0.7843.
Despite weekly price now trading above the 2018 yearly opening mark, a short from the 0.7850 region, we believe, is high probability. The first take-profit level in mind comes in at 0.78, followed closely by a nearby H4 Quasimodo support level at 0.7788.
Data points to consider: No high-impacting news on the economic calendar.
Areas worthy of attention:
Supports: 0.7788; 0.78 handle; 0.7801.
Resistances: 0.7859/0.7850; 0.7893-0.7843; 0.8065.
USD/JPY:
Weekly gain/loss: +1.00%
Weekly closing price: 106.81
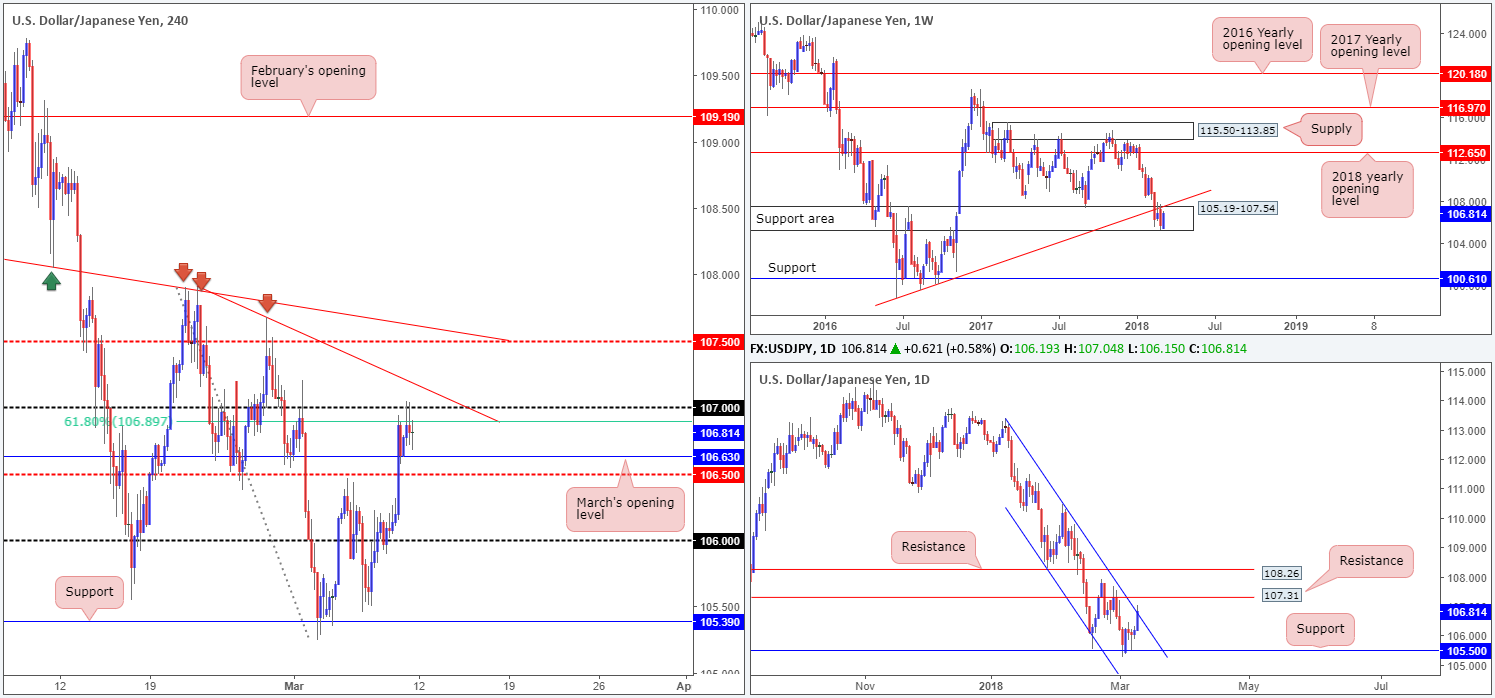
In recent events, we’ve seen weekly price print a rather healthy recovery candle within the walls of a weekly support area at 105.19-107.54. The only problem now, of course, is the nearby weekly trendline support-turned resistance etched from the low 98.78.
Daily price, on the other hand, ended the week marginally closing beyond a daily channel resistance line taken from the high 113.38, which has been in motion since the beginning of the year. Before we all go and slam that buy button, though, traders may also want to note the daily resistance level seen close by at 107.31, followed closely by another daily resistance level at 108.26.
The USD/JPY was little changed on Friday, despite the US non-farm payrolls release. H4 price, as you can see, remained tightly confined between the 107 handle and March’s opening band at 106.63. To the upside, there’s a nearby H4 trendline resistance taken from the high 107.90, whereas beneath 106.63 we see a H4 mid-level support at 106.50.
Potential trading zones:
This is a rather tricky market to trade at the moment.
On the weekly timeframe, buying and selling pressure appears equally weighted as far as structure goes. Daily flow is unfortunately in the same boat: although we’ve seen a marginal close above channel resistance, upside is capped by resistance. This leaves us with H4 structure, which, as we already know, is incredibly restricted at this time!
On account of the above, the team has labeled this market as flat going into today’s segment.
Data points to consider: No high-impacting news on the economic calendar.
Areas worthy of attention:
Supports: 106.50; 106.63; 105.19-107.54.
Resistances: 107 handle; H4 trendline resistance; 106.89; 107.31; 108.26; weekly trendline resistance.
USD/CAD:
Weekly gain/loss: -0.54%
Weekly closing price: 1.2809
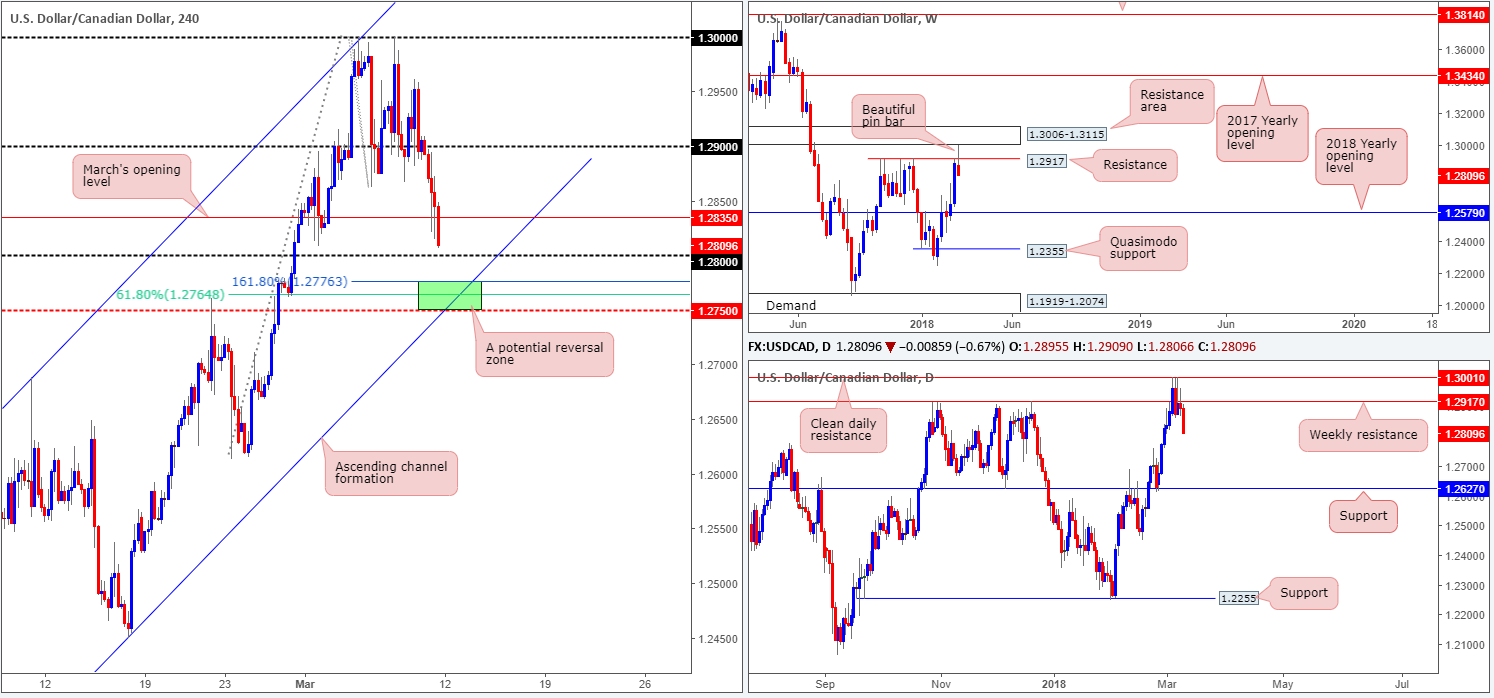
After piercing through weekly resistance at 1.2917 and coming within a few pips of connecting with a weekly resistance area at 1.3006-1.3115, weekly price printed a nice-looking bearish pin-bar formation. This has likely caught the attention of candlestick enthusiasts, as downside appears free from this point until we shake hands with the 2018 yearly opening level at 1.2579.
Turning our attention to the daily timeframe, we can clearly see that the unit ended the week in negative territory, in the shape of a near-full-bodied daily bearish candle. Further selling from this angle has the daily support level etched from 1.2627 to target. This level has proved its worth since August 2017, so overlooking this line for the 2018 yearly opening level seen on the weekly timeframe may not be such a good idea!
Friday’s session witnessed mixed job’s numbers from both the US and Canada, which saw the USD/CAD probe lower and challenge March’s opening line at 1.2835. Although an earnest attempt to keep things above this base was seen, the day ended just north of the 1.28 handle, formed in the shape of a near-full-bodied H4 bearish candle.
Potential trading zones:
Located a few pips beyond the 1.28 handle is a particularly nice-looking area of H4 support. Comprised of a H4 mid-level support band at 1.2750, a H4 61.8% Fib support at 1.2764, a H4 channel support line extended from the low 1.2255 and a 161.8% Fib ext. point at 1.2776, this area stands a healthy chance of holding today/early this week.
The downside to trading long from the above noted base, however, is that there’s absolutely no support seen from the higher timeframes! In fact, both weekly and daily charts suggest further selling could be on the cards. Therefore, trade the H4 zone with caution, traders.
Data points to consider: No high-impacting news on the economic calendar.
Areas worthy of attention:
Supports: 1.2750/1.2776; 1.28 handle; 1.2579; 1.2627.
Resistances: 1.2835; 1.3006-1.3115; 1.2917.
USD/CHF:
Weekly gain/loss: +1.44%
Weekly closing price: 0.9513
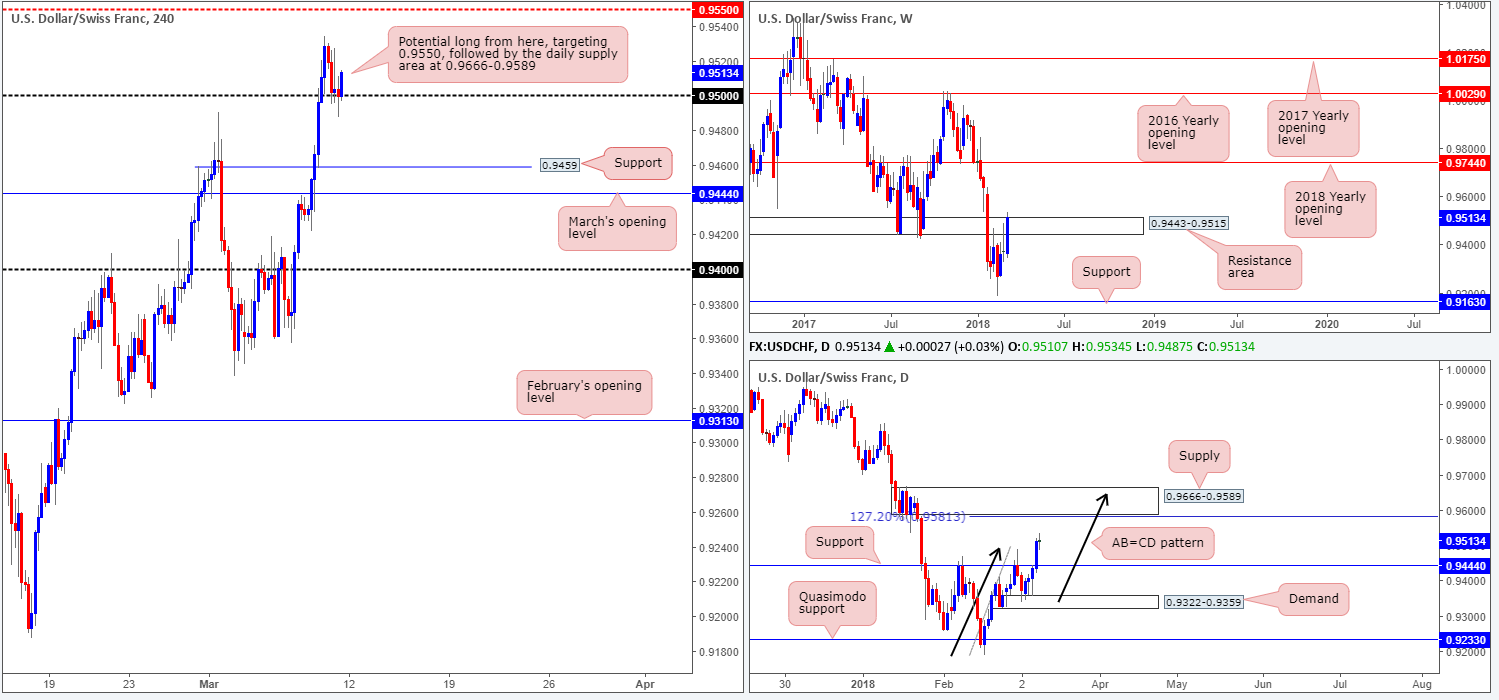
The USD/CHF edged higher in strong form last week, closing around the top edge of a weekly resistance area at 0.9443-0.9515. Given the near-full-bodied weekly close, further buying could be in store this week. Traders, therefore, may want to pencil in the 2018 yearly opening line at 0.9744 as the next upside target.
Turning over a page to the daily timeframe, daily demand at 0.9322-0.9359 held ground in the early stages of last week, eventually propelling the candles beyond daily resistance at 0.9444 (now acting support). What this move also accomplished was opening up the path north to a solid daily supply zone pegged at 0.9666-0.9589, potentially in the shape of a daily AB=CD (black arrows) bearish pattern terminating 0.9650/0.9581 (around the current daily supply).
From a technical standpoint, there was not much trade initiated from the latest round of US job’s figures. The H4 candles dipped from a high of 0.9534 and retested the 0.95 handle going into the closing bell. For those who follow our analysis on a regular basis this was a noted setup in Friday’s morning report.
Potential trading zones:
What really stands out at the moment is the 0.95 handle and the closing H4 candle. A long based off this formation has the H4 mid-level resistance at 0.9550 to target, followed then by the underside of the daily supply mentioned above at 0.9666-0.9589.
Data points to consider: No high-impacting news on the economic calendar.
Areas worthy of attention:
Supports: 0.95 handle; 0.9444.
Resistances: 0.9443-0.9515; 0.9666-0.9589; 0.9550.
DOW 30:
Weekly gain/loss: +3.25%
Weekly closing price: 25335
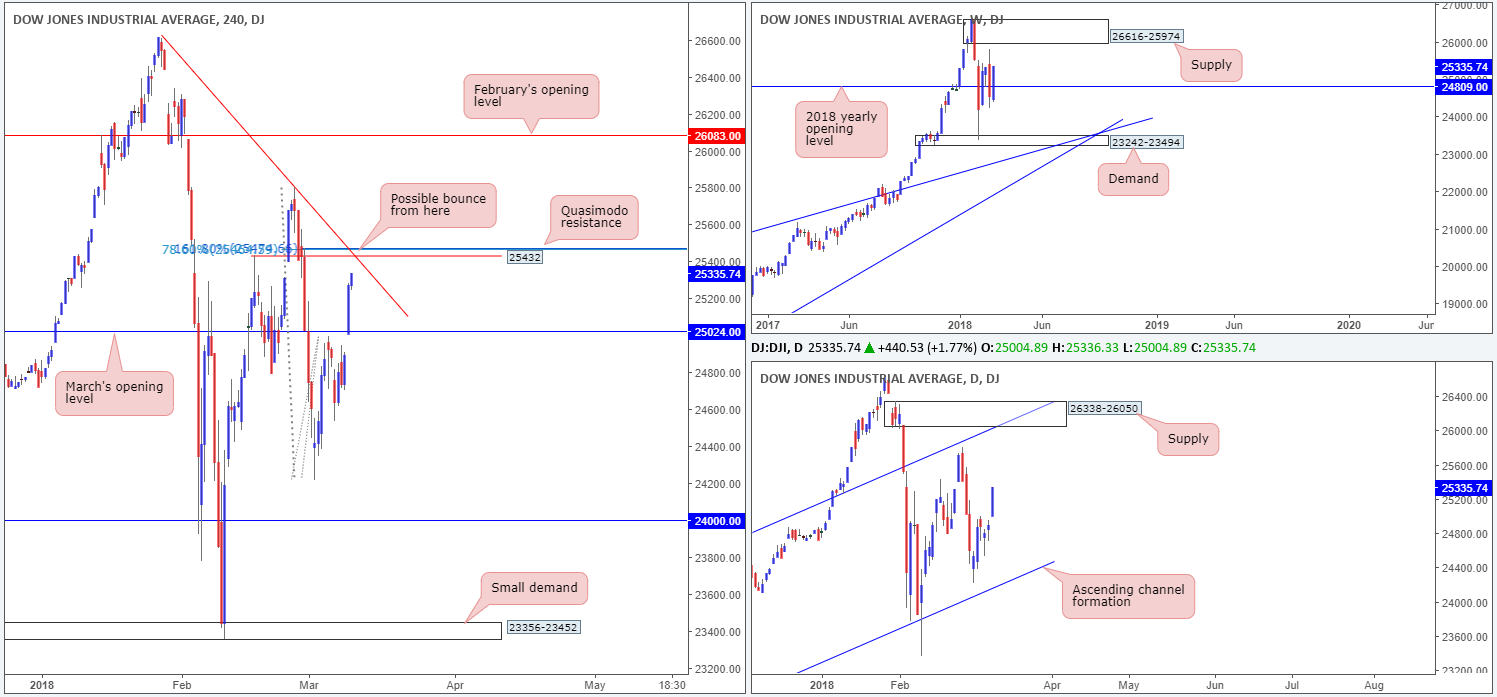
US equities reclaimed more than 90% of the prior week’s losses last week, and also managed to climb back above the 2018 yearly opening level at 24809. Sustained buying beyond this area could eventually lead to a test of weekly supply plotted at 26616-25974.
Daily price, as you can see, remains confined within a daily ascending channel formation fixed from 17883/21169. Technically speaking, this market could very well continue to punch higher this week until we reach the channel resistance, which, as you can probably see, converges beautifully with a fresh daily supply base coming in at 26338-26050 (positioned within the walls of the noted weekly supply zone).
Major equity indices rallied following February’s NFP on Friday. The headline payroll growth was solid, though easing average hourly wages hint that inflation pressures may not be so aggressive. H4 price crossed above March’s opening level at 25024 and closed the session ahead of a nice-looking H4 Quasimodo resistance level at 25432.
Potential trading zones:
While both weekly and daily price action indicates further upside could be on the horizon, the aforementioned H4 Quasimodo resistance level is of interest for a possible short. This is due to its surrounding H4 confluence:
- 78.6% H4 Fib resistance level at 25472.
- 161.8% H4 Fib ext. point at 25472.
- H4 trendline resistance extended from the high 26616.
Given this, the team expect sellers to make an appearance from this angle. In view of the bigger picture, however, we do not imagine the selloff to be anything to shout about. The most we expect is a retest of March’s opening base.
Data points to consider: No high-impacting news on the economic calendar.
Areas worthy of attention:
Supports: 25024; daily channel support; 24809.
Resistances: 25432; 26338-26050; daily channel resistance; 26616-25974.
GOLD:
Weekly gain/loss: +0.08%
Weekly closing price: 1323.0
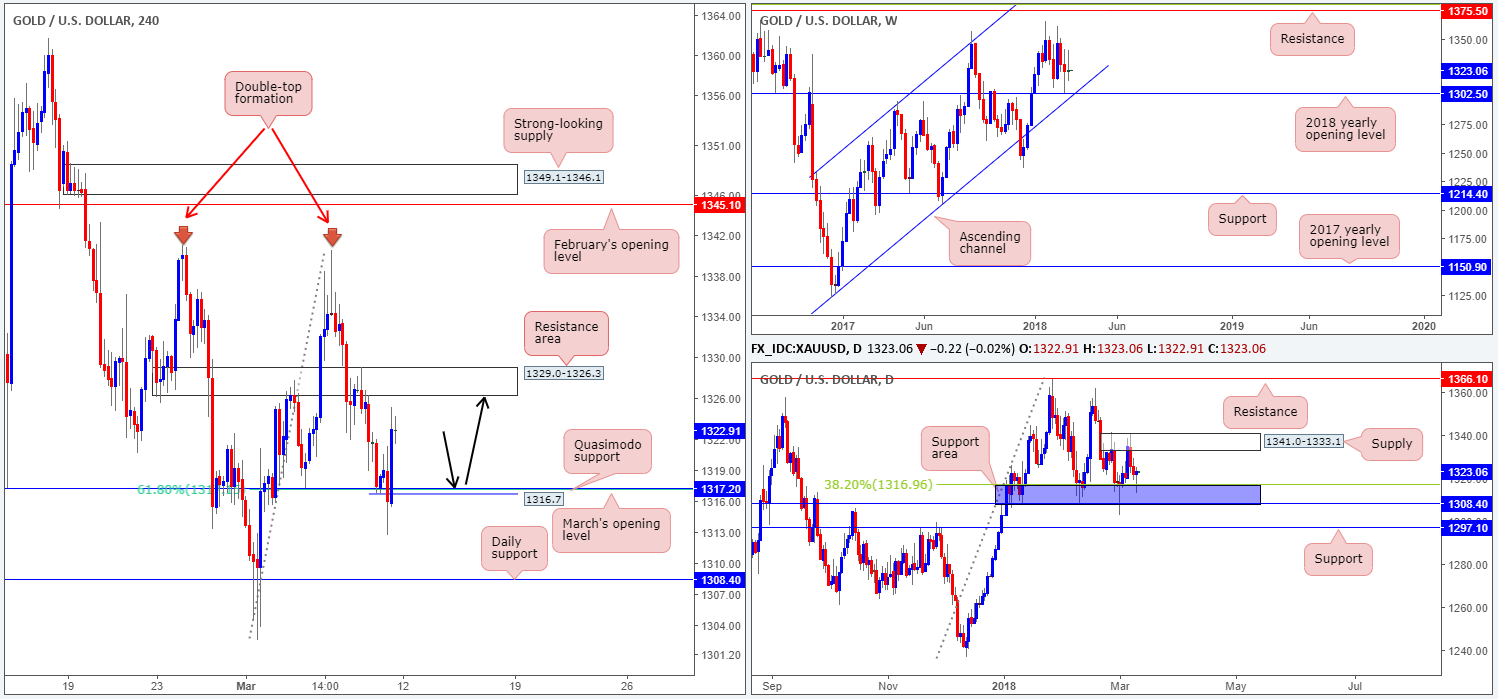
Gold wrapped up the week with marginal gains in spite of ranging more than $27. Weekly action, as should be evident from the weekly timeframe, remains hovering just north of the 2018 yearly opening level at 1302.5, which happens to combine nicely with a year-long weekly channel support extended from the low 1122.8.
On the other side of the coin, daily price is seen fluctuating between a daily supply area at 1341.0-1333.1 and a daily support area marked in blue at 1308.4/1316.9. A break beyond here would place daily support at 1297.1 on the hit list, whereas a move to the upside has daily resistance at 1366.1 to target.
Although H4 price initially held at March’s opening level drawn from 1317.2 (and 61.8% H4 fib support), the daily support area seen directly below at 1308.4/1316.9, as anticipated in Friday’s morning report, acted as a magnet and pulled the unit lower, before rallying higher on US non-farm payrolls data. The day ended on a positive note, closing just short of a H4 resistance area at 1329.0-1326.3 that’s been in play since the end of February.
Potential trading zones:
Apart from the current H4 resistance area, we do not see much else standing in the way of a move higher. As for tradable support zones, the only base that really stands out at the moment is March’s opening level for a retest play (black arrows). This time, however, we also have a H4 Quasimodo support at 1316.7 bolstering the line. A long from here, targeting the aforesaid H4 resistance area, followed by the underside of the noted daily supply at 1333.1, is certainly something to watch for today/early this week.
Areas worthy of attention:
Supports: 1317.2/1316.7; 1308.4/1316.9; 1302.5; weekly channel support.
Resistances: 1341.0-1333.1; 1329.0-1326.3.
This site has been designed for informational and educational purposes only and does not constitute an offer to sell nor a solicitation of an offer to buy any products which may be referenced upon the site. The services and information provided through this site are for personal, non-commercial, educational use and display. IC Markets does not provide personal trading advice through this site and does not represent that the products or services discussed are suitable for any trader. Traders are advised not to rely on any information contained in the site in the process of making a fully informed decision.
This site may include market analysis. All ideas, opinions, and/or forecasts, expressed or implied herein, information, charts or examples contained in the lessons, are for informational and educational purposes only and should not be construed as a recommendation to invest, trade, and/or speculate in the markets. Any trades, and/or speculations made in light of the ideas, opinions, and/or forecasts, expressed or implied herein, are committed at your own risk, financial or otherwise.
The use of the site is agreement that the site is for informational and educational purposes only and does not constitute advice in any form in the furtherance of any trade or trading decisions.
The accuracy, completeness and timeliness of the information contained on this site cannot be guaranteed. IC Markets does not warranty, guarantee or make any representations, or assume any liability with regard to financial results based on the use of the information in the site.
News, views, opinions, recommendations and other information obtained from sources outside of www.icmarkets.com.au, used in this site are believed to be reliable, but we cannot guarantee their accuracy or completeness. All such information is subject to change at any time without notice. IC Markets assumes no responsibility for the content of any linked site. The fact that such links may exist does not indicate approval or endorsement of any material contained on any linked site.
IC Markets is not liable for any harm caused by the transmission, through accessing the services or information on this site, of a computer virus, or other computer code or programming device that might be used to access, delete, damage, disable, disrupt or otherwise impede in any manner, the operation of the site or of any user’s software, hardware, data or property.


