EUR/USD:
Weekly Gain/Loss: +0.93%
Weekly Closing price: 1.1766
Following six consecutive weeks of losses, the euro came in strong last week and confronted nearby weekly resistance area seen at 1.1717-1.1862. Continued buying from this point would likely place the 2018 yearly opening level at 1.2004 in the spotlight, whereas a move to the downside has weekly support at 1.1600 to target.
In conjunction with weekly structure, daily resistance at 1.1824 was brought into the fray on Thursday. It’s important to note that this level is seen entrenched within the walls of the current weekly resistance area, and is also sited just south of a 38.2% daily Fib resistance value at 1.1855. To date, the aforementioned daily resistance level remains in play and may eventually inspire sellers to retest the nearby daily trend line support (etched from the 1.0340). At the same time, though, traders may also want to pencil in daily supply seen at 1.2031-1.1950 as a viable target to the upside should buyers come into the market this week. It is also worth pointing out that this area houses the 2018 yearly opening level mentioned above on the weekly scale.
Across on the H4 timeframe, we can see that the pair met selling pressure at highs of 1.1839 on Thursday. This was likely due to a H4 ABCD completion point at 1.1831 and nearby daily resistance mentioned above at 1.1824. Further selling, as you can see, came about on Friday, consequently erasing bids around the 1.18 handle and forcing a test of H4 mid-level support at 1.1750 into the close.
Areas of consideration:
The H4 ABCD formation has two downside targets (yellow markers):
- The 38.2% H4 Fib support at 1.1715, which is located just north of June’s opening level at 1.1705 and the 1.17 handle.
- The 61.8% H4 Fib support at 1.1636, seen hugging the top edge of a H4 support area at 1.1639-1.1607.
Given the overhead resistance seen on both weekly and daily structure right now, there’s a good chance we’ll at least witness a test of the 1.1700 region this week. This will, according to traditional interpretation, allow those short off the current H4 ABCD formation to move stop-loss orders to a breakeven point (1.1715 to be precise [38.2% Fib]). The 61.8% barrier is generally thought of as a take-profit level.
On account of the above, the team has also noted to keep eyes on 1.18 today for possible shorting opportunities. A decisive retest of this number in the shape of a full or near-full-bodied H4/H1 bear candle has an initial support target placed at 1.1750, followed then by the 1.1700 neighborhood.
Today’s data points: Limited.

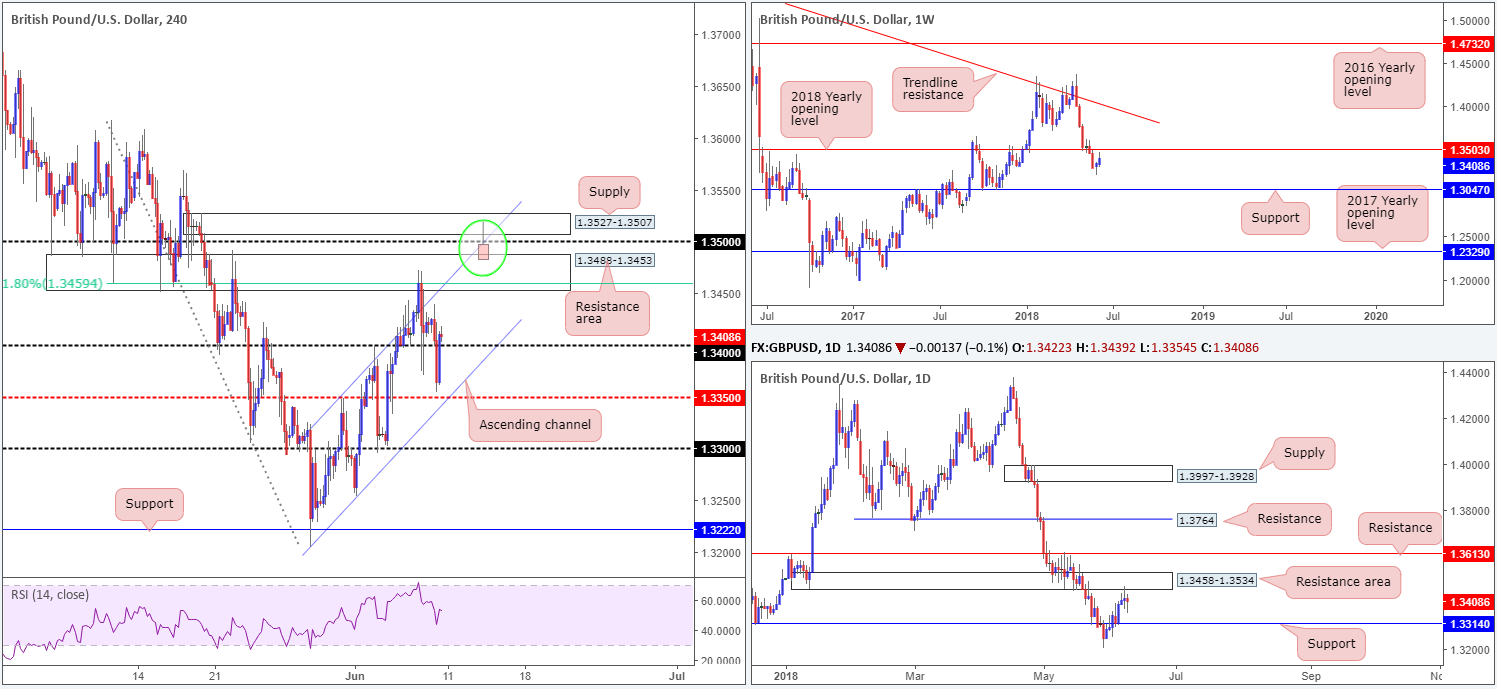
GBP/USD:
Weekly Gain/Loss: +0.44%
Weekly Closing price: 1.3408
After firmly nudging to fresh 2018 lows of 1.3204 two weeks ago in the shape of a weekly bullish pin-bar formation, sterling extended higher over the course of recent trade and concluded the week closing within striking distance of the 2018 yearly opening level seen on the weekly timeframe at 1.3503.
A closer look at price action on the daily timeframe reveals that the buyers and sellers are currently battling for position around the underside of a daily resistance area coming in at 1.3458-1.3534 (encapsulates the noted 2018 yearly opening level within). As of yet the sellers have been unable to print anything noteworthy from here. In fact, Friday’s session closed forming a bullish pin-bar pattern. Apart from the current daily resistance area, additional areas of interest on this scale fall in at daily resistance drawn from 1.3613 and daily support priced in at 1.3314.
A quick recap of Friday’s price action on the H4 timeframe reveals that cable pushed below the 1.34 handle amid late London morning trade, though the pair did manage to reclaim 1.34 during US hours. Also of particular interest on this scale are the following areas:
- The current H4 ascending channel formation (1.3204/1.3347).
- H4 resistance area printed at 1.3488-1.3453 (holds a 61.8% H4 resistance value at 1.3459 and is glued to the underside of the noted daily resistance area).
- H4 supply zone seen above 1.35 at 1.3527-1.3507 (sited a few pips above the 2018 yearly opening level on the weekly timeframe and located within the current daily resistance area).
Areas of consideration:
Although the market is attempting to recover at the moment, there’s a considerable amount of resistance overhead on all three timeframes we follow.
With that being the case, potential shorting opportunities may arise from either the H4 supply zone drawn from 1.3527-1.3507 or the H4 resistance area at 1.3488-1.3453.
The H4 supply is of particular interest. Positioned strategically above 1.35, the zone has ‘fakeout 1.35 to me’ written all over it. An ideal sell signal from here, therefore, would be a H4 bearish pin-bar formation that pierces through 1.35 and connects with the aforementioned H4 supply (see chart for a visual representation [green circle]).
Today’s data points: UK manufacturing production m/m and UK goods trade balance.
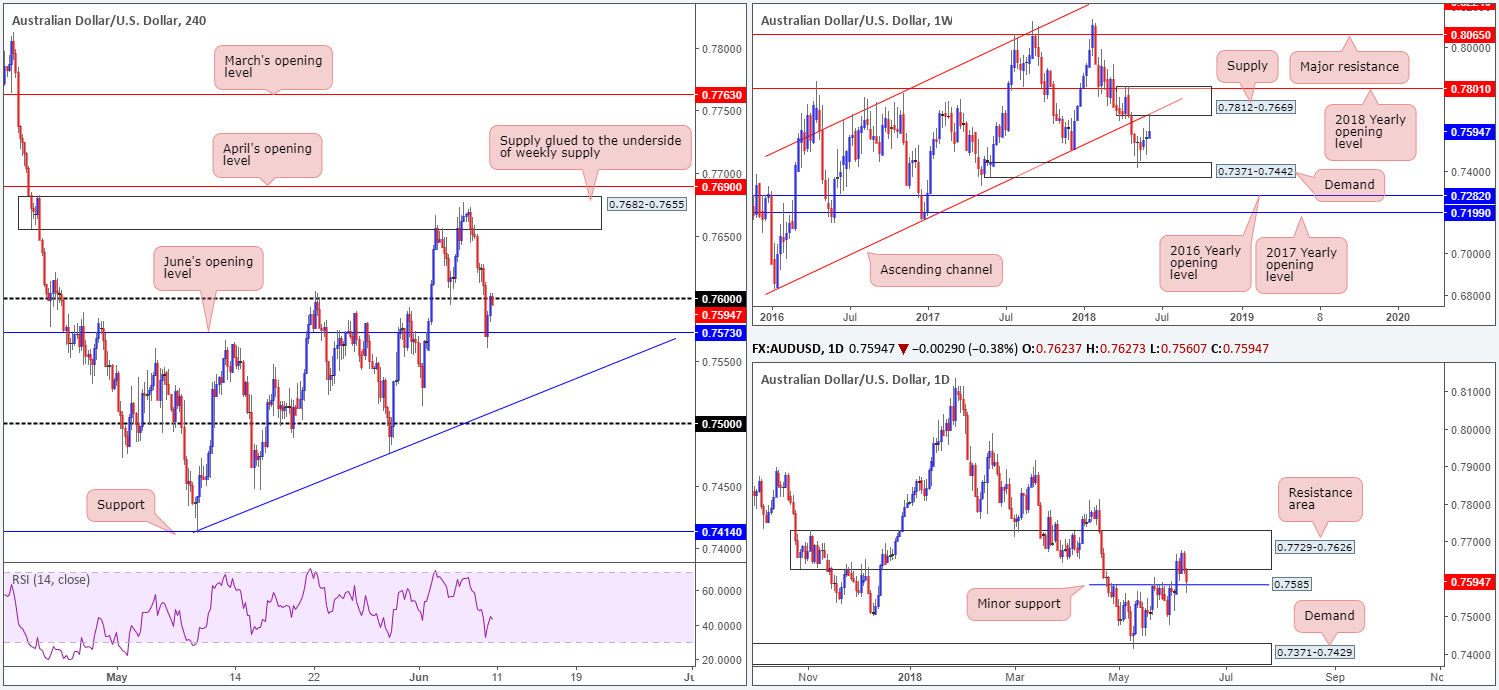
AUD/USD:
Weekly Gain/Loss: +0.42%
Weekly Closing price: 0.7594
Although the AUD/USD recognized a moderate gain last week, weekly action produced a somewhat prominent bearish pin-bar formation off the lower edge of a weekly supply at 0.7812-0.7669 and its intersecting weekly channel support-turned resistance (extended from the low 0.6827). Technically speaking, this will likely attract candlestick enthusiasts into the market this week, likely looking to target nearby weekly demand priced in at 0.7371-0.7442.
The daily resistance area at 0.7729-0.7626, as you can see, captivated the attention of sellers in the later stages of last week. Seen glued to the underside of the noted weekly supply, movement out of this zone brought the candles down to a minor daily support at 0.7585. A break of this level likely places daily demand at 0.7371-0.7429 in the firing range (sited within the lower limit of the said weekly demand).
Over on the H4 timeframe, we can clearly see that the pair held on to its weaker tone throughout London’s morning session on Friday. Price broke through orders at 0.76 and freed downside to June’s opening level at 0.7573, which, as is evident from the chart, provided a platform of support for the buyers to come in and retest the underside of 0.76. China’s less-than-stellar trade surplus data was seen as one of the key factors weighing on the commodity-driven currency.
Areas of consideration:
In a nutshell, the nuts and bolts of this market can be summed up as follows:
- H4 price seen testing resistance in the shape of a round number at 0.76 after bouncing from June’s opening level at 0.7573.
- Daily price is seen challenging minor support at 0.7585 following a selloff from a major resistance area at 0.7729-0.7626.
- The recently closed weekly candle suggests that further downside may be in store.
Initially we were supportive of shorts off 0.76, but after H4 price finding support off of June’s opening level at 0.7573 and the noted daily support, we had a change of heart.
Instead, focus is now on a H4 close forming beneath the aforesaid structures. This – coupled with a retest to the underside of these levels as resistance – would, in our humble view, be enough evidence to suggest shorting this market. The first area of concern from this point would have to be the H4 trend line support taken from the low 0.7424, followed by the 0.75 handle. Ultimately, though, the final take-profit target can be set around the top edge of weekly demand highlighted above at 0.7442.
Today’s data points: Limited.
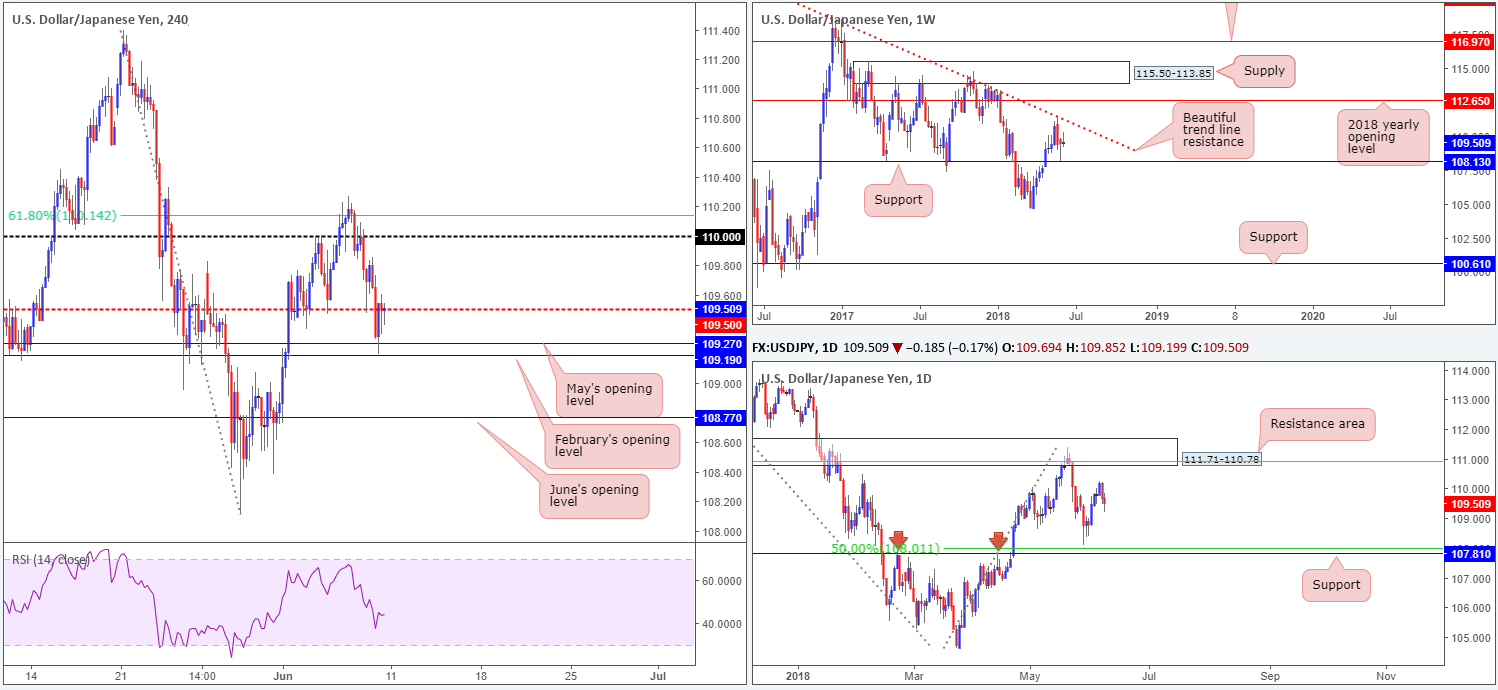
USD/JPY:
Weekly Gain/Loss: -0.01%
Weekly Closing price: 109.50
A couple of weeks ago, we witnessed weekly price cross swords with neighbouring weekly support at 108.13 in the shape of a weekly bullish pin-bar formation. Aside from a modest bout of buying to highs of 110.26, there’s been very little in terms of bullish intent seen going forward. In fact, last week’s session ended with price forming a weekly bearish pin-bar pattern. Despite this, traders may want to pencil in the weekly trend line resistance taken from the high 123.67 in the event the buyers eventually regain some form of consciousness.
The story on the daily timeframe reveals that the candles are seen hovering between a daily resistance zone pictured at 111.71-110.78 that converges with a 61.8% daily Fib resistance value at 110.91 (green line), and a daily support line seen at 107.81, which also happens to unite closely with a 50.0% support value at 108.01.
Friday’s movement on the H4 timeframe saw price drive beyond the H4 mid-level support at 109.50 and shake hands with both February and May’s opening levels at 109.19/109.27. From here, as you can see, the candles mildly pared losses into the close and reconnected with 109.50.
Areas of consideration:
Longer term, this market is a challenge. On the one hand, weekly buyers could eventually make an appearance on the weekly scale and work towards a test of the aforementioned weekly trend line resistance. On the other hand, there’s room for daily sellers to push price as far south as 107.80ish!
Shorter term (H4), we have the following levels noted as possible intraday reaction points:
- The mid-level support at 109.50.
- The 110 handle.
- 61.8% Fib resistance value at 110.14.
- February’s opening level at 109.19.
- May’s opening level at 109.27.
- June’s opening level at 108.77.
Today’s data points: Limited.
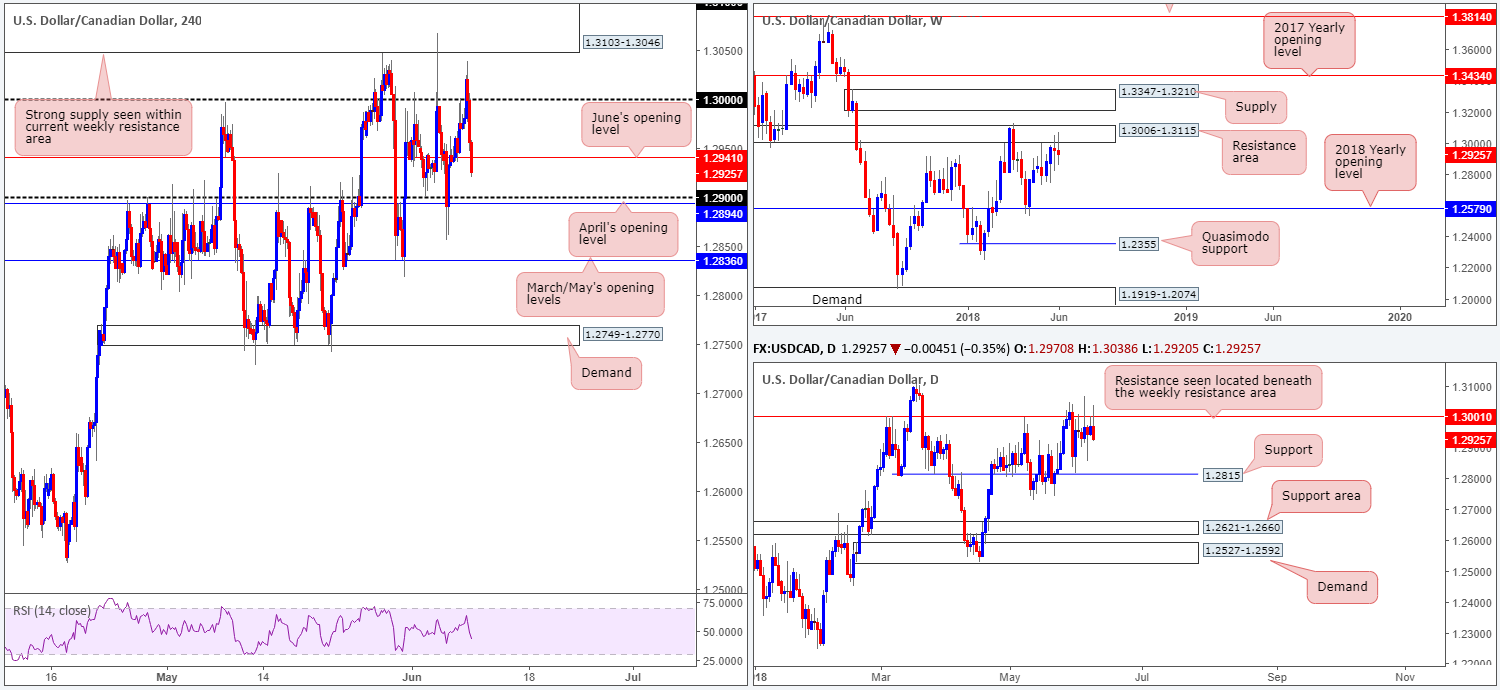
USD/CAD:
Weekly Gain/Loss: -0.18%
Weekly Closing price: 1.2925
Formed in the shape of two back-to-back weekly indecision candles, weekly price continues to flirt with the underside of a resistance area seen at 1.3006-1.3115. Should imbalance favor the bulls here this week, and a break of the current weekly resistance zone is seen, this will almost immediately bring weekly supply at 1.3347-1.3210 into the fray. On the other side of the spectrum, a selloff could see price action stretch as far south as the 2018 yearly opening level at 1.2579.
In conjunction with weekly structure, the daily candles are seen interacting with resistance coming in at 1.3001. Providing a strong ceiling of resistance since March of this year, on top of Friday’s action pencilling in a reasonably nice-looking selling wick off the level, a selloff from this number could be in store. The next downside support target on the radar falls in at 1.2815, followed then by a daily support area at 1.2621-1.2660.
Friday’s job’s data out of Canada showed a drop in employment by 7.5K, while the unemployment rate remained steady at 5.8%. The report initially drove USD/CAD prices skyward, breaching the key figure 1.30. Despite this, the move was a short-lived one! Topping at highs of 1.3038, a few pips beneath H4 supply at 1.3103-1.3046, the pair reclaimed earlier gains and concluded the day closing a few pips off its lows, marginally beyond June’s opening level at 1.2941.
Areas of consideration:
Having noted that both weekly and daily price show potential to selloff, further downside could be on the cards this week. Ultimately, though, the team will only be confident airing potential shorts on a H4 close below 1.29 (preferably along with a retest to the underside of this number as resistance). Beyond here we see little stopping the sellers from testing March/May’s opening levels at 1.2836, followed by the daily support level mentioned above at 1.2815.
Today’s data points: Limited.
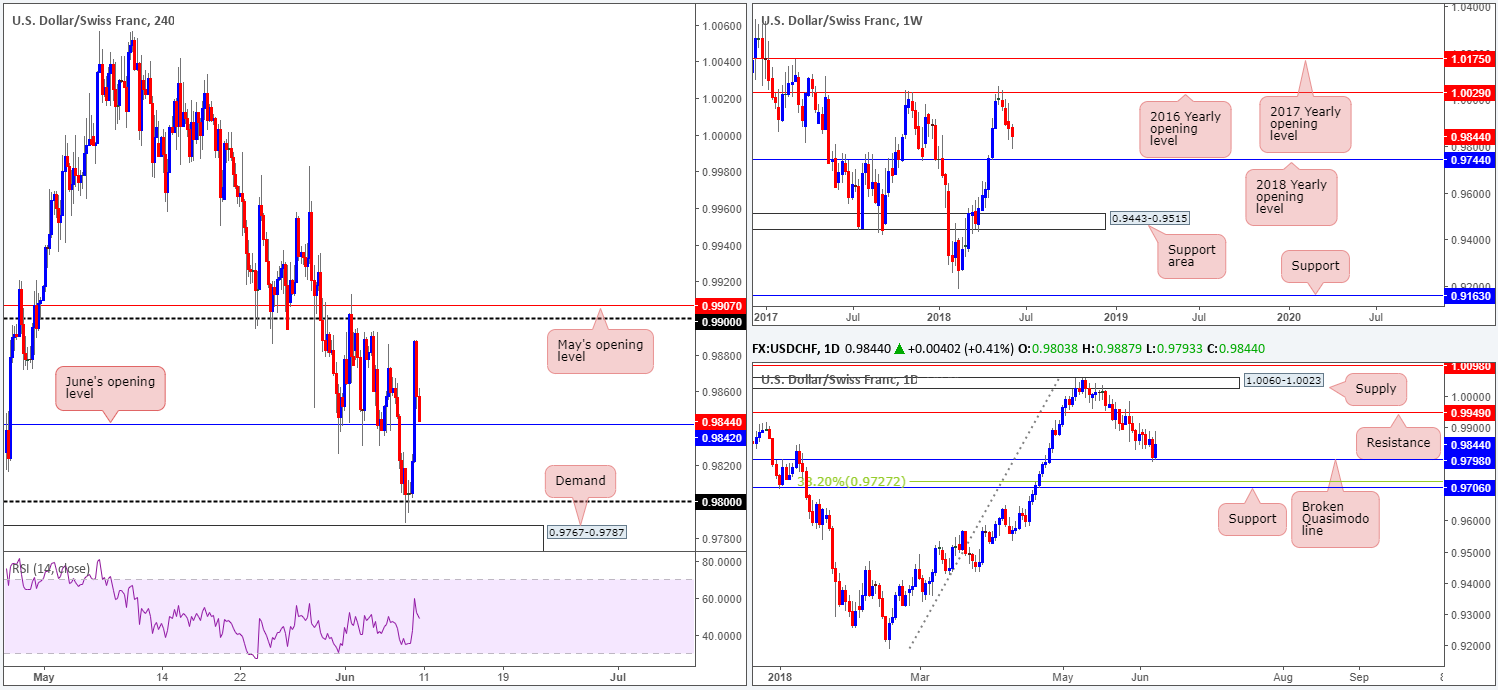
USD/CHF:
Weekly Gain/Loss: -0.28%
Weekly Closing price: 0.9844
The USD/CHF sustained further losses during last week’s trade, consequently marking the pair’s fourth consecutive weekly loss off the 2016 yearly opening level seen on the weekly timeframe at 1.0029. In terms of weekly structure, the team has noted to keep eyeballs on the 2018 yearly opening level marked at 0.9744 as the next support target on this scale.
While weekly price continues to emphasize a bearish environment, traders may want to note that daily action recently checked in with a daily Quasimodo support at 0.9798. These tend to be high-probability reaction zones, which could see the market work towards a retest to the underside of daily resistance at 0.9949 sometime this week. Beyond 0.9798, however, traders likely have their crosshairs fixed on daily support at 0.9706, seen accompanied by a nearby 38.2% daily Fib support at 0.9727.
A brief look at recent dealings on the H4 timeframe shows Friday’s Asian trade experienced difficulty establishing direction off the 0.98 handle. The pair, however, moved into a higher gear going into Europe on the back of a stronger greenback, driving price above June’s opening level at 0.9842 to highs of 0.9887.
Areas of consideration:
Having seen H4 price pare gains during US hours, the market closed just north of June’s opening level. Entering long off of this monthly level is likely of interest to some traders, given price found support on the daily scale on Friday. Upside targets from this angle fall in at the 0.99 handle, followed closely by May’s opening level at 0.9907. Beyond here, the daily resistance mentioned above at 0.9949 is also likely eyed.
By entering long from 0.9842 you will, however, place yourself against weekly directional flow. Therefore, you may want to consider waiting and seeing if H4 price can chalk up a full or near-full-bodied bull candle before pulling the trigger. Of course, this will not guarantee a winning trade, but what it will do is show buyer intent and provide one a location for stops (beyond the rejection candle’s tail).
Today’s data points: Limited.
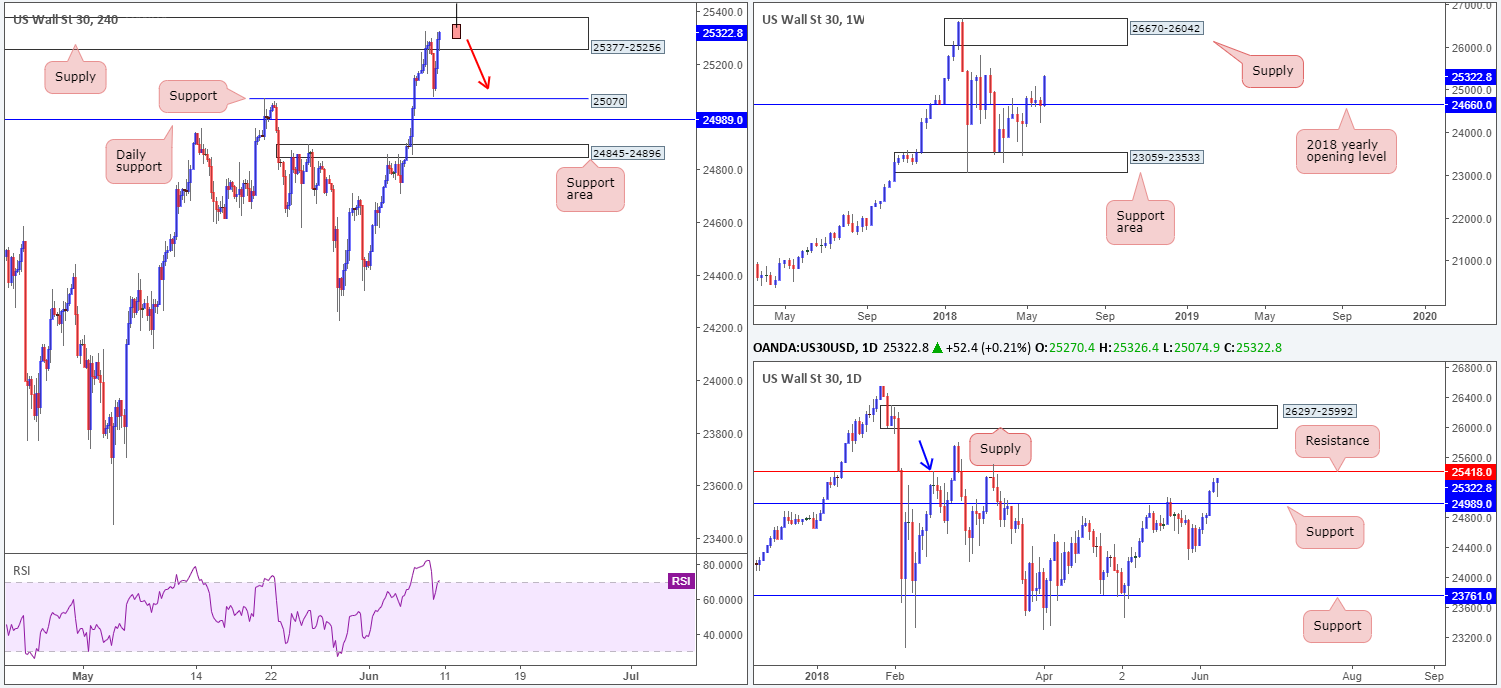
Dow Jones Industrial Average:
Weekly Gain/Loss: +2.76%
Weekly Closing price: 25322
After three weeks of mind-numbing consolidation on the weekly timeframe, US equities eventually gravitated north from its 2018 yearly opening level at 24660 last week. Closing the week out in the shape of a strong full-bodied weekly bull candle, the next upside target on this scale can be seen around the all-time highs: weekly supply drawn from 26670-26042.
What was also accomplished as a result of recent buying was a move above daily resistance at 24989 (now acting support) and the positioning of daily price ahead of a daily resistance plotted at 25418. Do note that this level also represents a Quasimodo resistance taken from the high 25415 (blue arrow).
H4 sellers, as you can see, found enough steam to pull price action lower from the H4 supply zone seen at 25377-25256 during the early hours of Friday’s trade, though the index quickly bottomed just ahead of H4 support at 25070 and swiftly pared recent losses.
Everything about the current H4 supply now echoes WEAKNESS.
Areas of consideration:
While we would agree that the buyers are in fine form at the moment, we’re expecting the sellers to make an appearance from the daily resistance level mentioned above at 25418.
Those who are currently short from the H4 supply are, we believe, at risk of a fakeout. The daily resistance is strategically plotted just north of this current H4 supply and is therefore a magnet for a fakeout play (one can only imagine the amount of stop-loss orders there are above the H4 zone).
Those considering a trade short from the daily level, we strongly recommend waiting and seeing if H4 price can pencil in a bearish pin-bar formation (or anything that closely represents this pattern) that pierces through the top edge of the said H4 supply and tags the daily resistance level (see chart for a visual representation) before pulling the trigger. This will likely help save one from an unnecessary loss should the buyers attempt to build on previous gains.
Today’s data points: Limited.
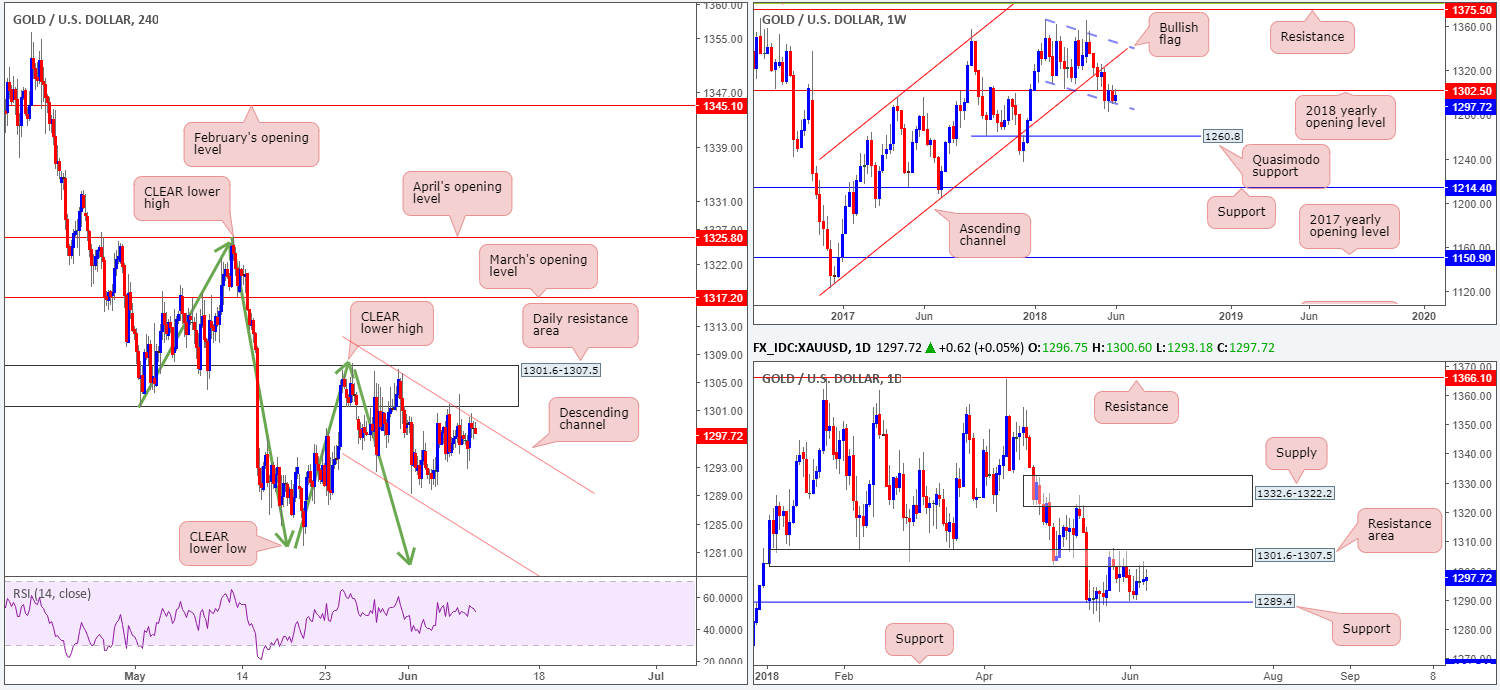
XAU/USD (Gold)
Weekly Gain/Loss: +0.44%
Weekly Closing price: 1297.7
Of late, the price of gold has been tightly confined between the 2018 yearly opening level on the weekly timeframe at 1302.5 and the lower edge of a weekly bullish flag formation taken from the low 1346.1. A break lower may set the stage for a test of 1260.8: a weekly Quasimodo support, whereas a move above 1302.5 may see weekly price head for the opposite end of the current weekly flag extended from the high 1366.0.
Moving down to the daily timeframe, we are able to see that price action remains sandwiched between a daily resistance area at 1301.6-1307.5 and a daily support level drawn in from 1289.4. Beyond this area, surrounding structures are seen at daily supply penciled in from 1332.6-1322.2, and daily support at 1267.5 (not seen on the screen).
H4 candle action continues to surf the H4 channel resistance extended from the high 1306.8, which closely intersects with the daily resistance area mentioned above at 1301.6-1307.5. From this point, the team remains supportive of a lower low taking place on the H4 scale (a break of the swing low 1285.8). As mentioned in several reports prior, this expectation will only be discounted on a H4 close above the clear lower high seen on the H4 timeframe at 1307.7.
Areas of consideration:
As the expectation is for a lower low to form on the H4 timeframe, we feel shorts at current price are still worthy of consideration, with stop-loss orders placed above the clear lower high on the H4 timeframe at 1307.7. Reducing risk to breakeven and taking partial profits off the table on a test of lows at 1281.8 is recommended.
The use of the site is agreement that the site is for informational and educational purposes only and does not constitute advice in any form in the furtherance of any trade or trading decisions.
The accuracy, completeness and timeliness of the information contained on this site cannot be guaranteed. IC Markets does not warranty, guarantee or make any representations, or assume any liability with regard to financial results based on the use of the information in the site.
News, views, opinions, recommendations and other information obtained from sources outside of www.icmarkets.com.au, used in this site are believed to be reliable, but we cannot guarantee their accuracy or completeness. All such information is subject to change at any time without notice. IC Markets assumes no responsibility for the content of any linked site. The fact that such links may exist does not indicate approval or endorsement of any material contained on any linked site.
IC Markets is not liable for any harm caused by the transmission, through accessing the services or information on this site, of a computer virus, or other computer code or programming device that might be used to access, delete, damage, disable, disrupt or otherwise impede in any manner, the operation of the site or of any user’s software, hardware, data or property.


