Candlestick charting originated around the 17th century among Japanese rice traders. Munehisa Homma developed this methodology to monitor daily changes in the prices of rice in order to help him make better decisions when it comes to buying or selling the commodity. These methods were eventually compiled and improved on by the more popularly known proponent of candlestick patterns, Steve Nison, who published his book entitled Japanese Candlestick Charting Techniques in the early 90s. As discussed in the previous section, one of the best features of using candlestick charts to watch forex price action is that it provides a snapshot of buying and selling pressure. A quick glance at a Japanese candlestick chart could easily show whether bulls or bears are in control, allowing one to determine whether a reversal or continuation of the trend is more likely to happen.
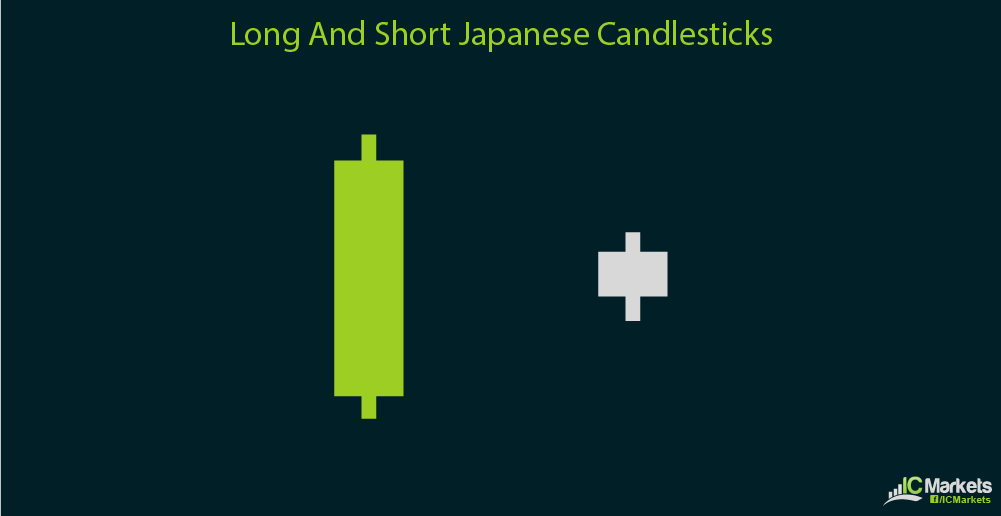
Aside from that, the open and close of price action for longer-term charts such as the daily and weekly time frames tend to act as support or resistance for intraday price action. These open and close levels are marked by Japanese candlestick patterns and the highs and lows could act as gauges for when breakouts are taking place. In addition, the length of the candlesticks is also indicative of market behavior. Long green candles mean that buyers are very aggressive in pushing the pair higher while long red candles suggest that sellers have found a catalyst to keep shorting the currency pair. Short candles reflect indecision or could be early signals for a market reversal.
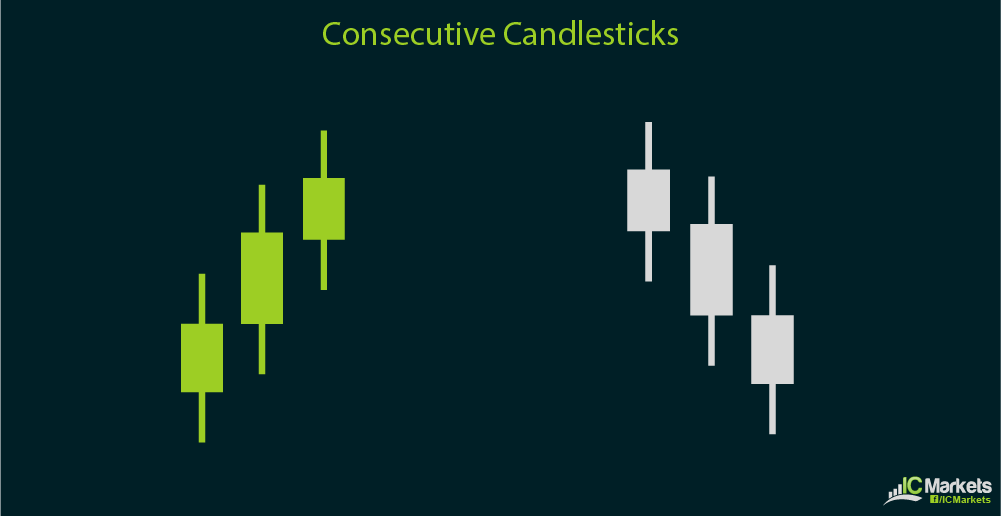
Shadows or candlestick wicks representing the highs and lows also provide helpful clues on future price behavior. A candlestick with a long upper wick and a short lower wick means that buyers bid prices higher but that sellers refused to back down. Conversely, a candlestick with a long lower wick and a short upper wick suggests that sellers tried to pile up their short positions but that buyers are similarly aggressive. Candlestick patterns come in various sizes and numbers. There are single candlestick patterns, useful in both long-term and intraday trading. A single candlestick pattern can be indicative of a continuation or a potential reversal, pending confirmation from the succeeding candlestick or from technical indicators. Double candlestick patterns are also classified as common signals of reversal or continuation, as the first candlestick is considered the signal bar while the second one is called the confirmation bar. Group candlestick patterns, which are typically comprised of three candlesticks, comprise more complex formations. This can be tedious to remember but are very helpful particularly for longer-term price movements. These are also more rare compared to their single counterparts but they are usually much more reliable signals. However, these can be frustrating to trade at times since patterns seem evident for the first two bars only to lack confirmation from the third or last candlestick. Of course trading based solely on candlestick patterns has its drawbacks, as this method mostly relies on technical signals and doesn’t incorporate economic analysis. Despite that, knowing how to read candlesticks is a useful tool when it comes to understanding market behavior and improving profitability in trading.


