Markets move in the path of least resistance
Two of the most widely discussed concepts in the field of technical analysis are support and resistance levels. Without understanding these critical components, trading is generally a frustrating endeavour.
At first glance, the concept behind support and resistance makes sense, some would even say simple. However, you’ll soon discover applying the idea to the foreign exchange (FX/forex) market is challenging. Confusing things further, you’ll also learn each trader appears to have a different spin on its definition and application.
The mission going forward, therefore, is to simplify things so even newer traders can locate high-probability support and resistance.
Breaking down support and resistance
On balance, support and resistance signifies the ‘floor’ and the ‘ceiling’ of a market.
Increased demand at a particular price point establishes a support level, typically referred to as a support point, swing low or trough. Increased supply, however, creates a resistance point, an individual peak or swing high (see figure 1.1).
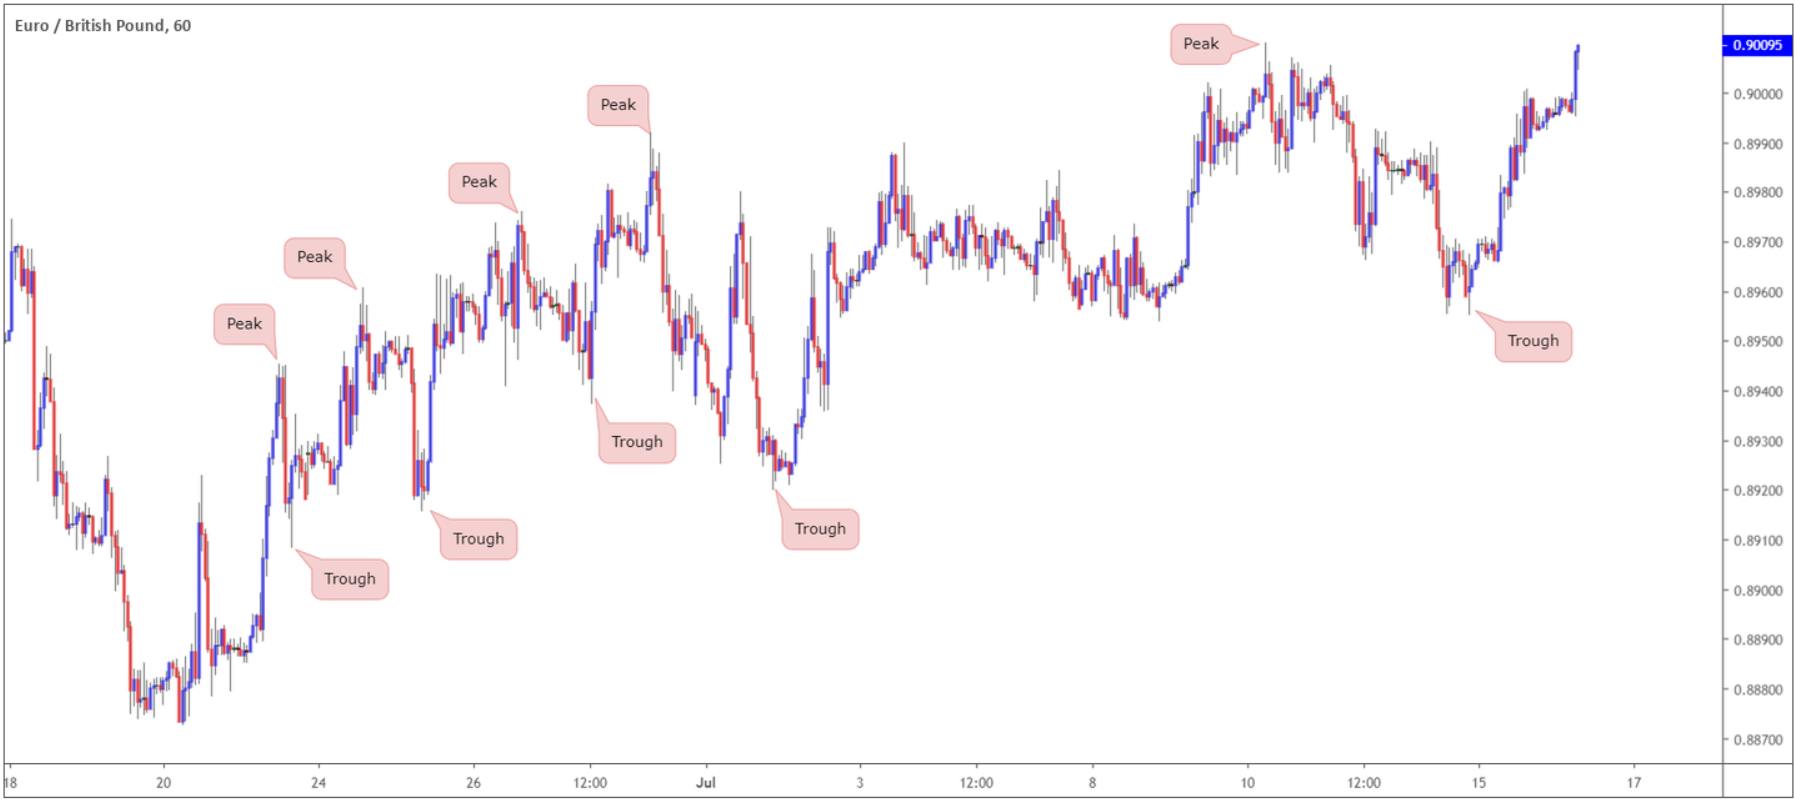
(Figure 1.1)
Although support and resistance points sometimes deliver tradeable action when retested, expecting price to react to-the-point off a level usually leads to frustration. The real ‘juice’ is found in support and resistance zones. Adopting the use of a zone in place of a definite level improves chances of pinning down tradeable turning points in the market.
Support and resistance zones build confluence. The more levels used to form an area, the stronger it is. Figure 1.2 displays a reasonably strong support zone using three support points.
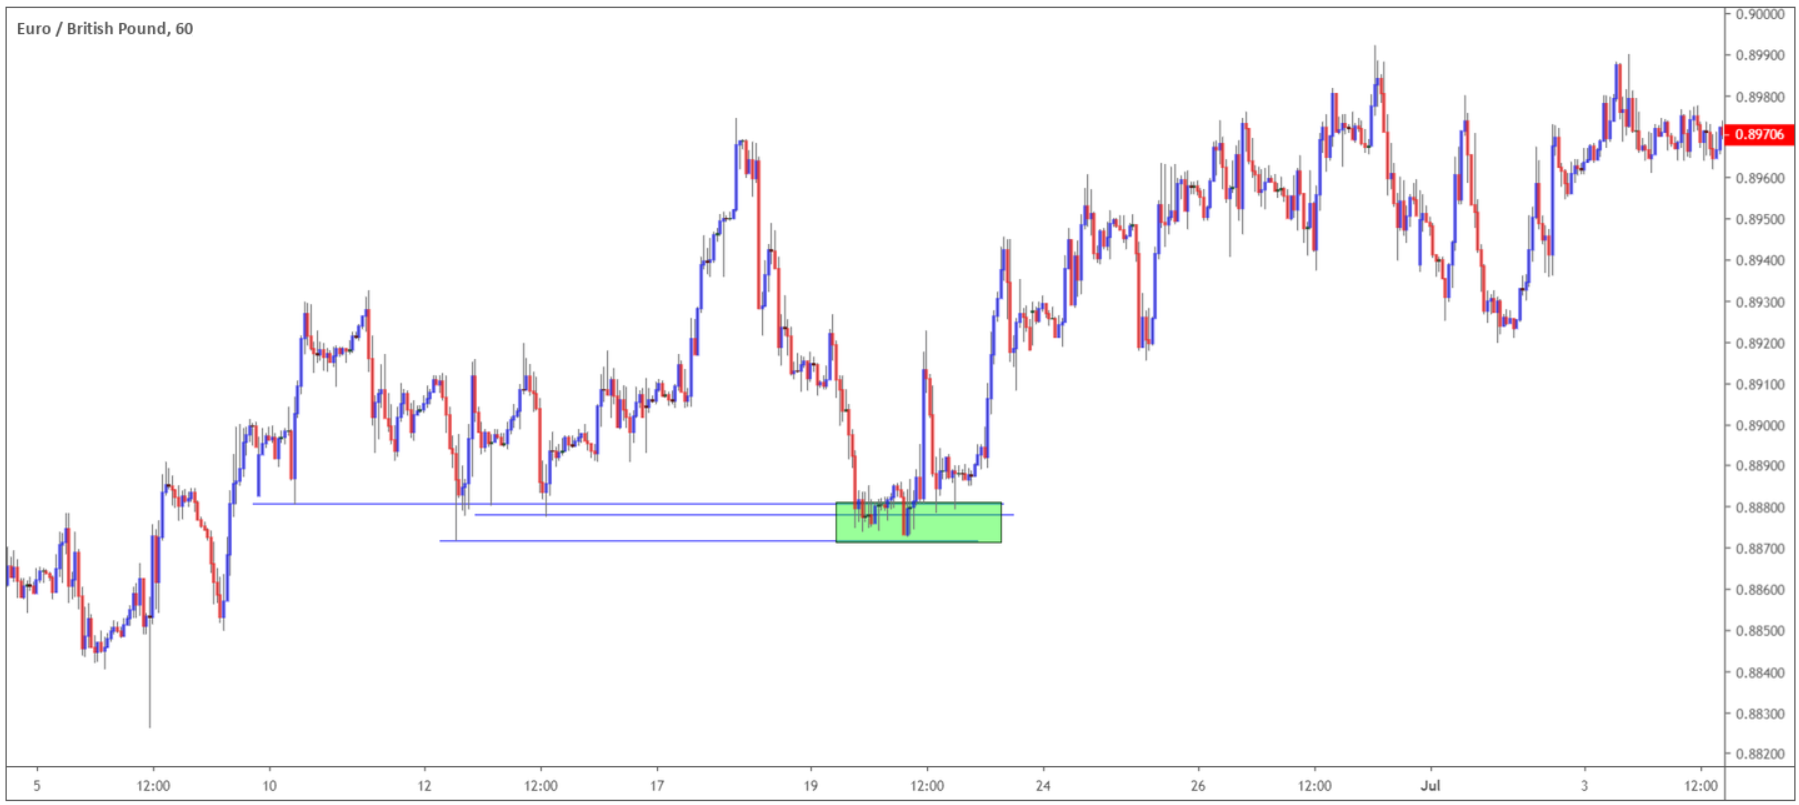
(Figure 1.2)
Figure 1.3 shows a resistance zone consisting of several support and resistance points for a high-probability sell (green). Traders may also want to note the resistance point furthest to the left is Quasimodo resistance (black arrow), which held as support when consumed and then returned to serve as resistance upon breaking south. This is important to note. Once a support point is engulfed it often serves well as resistance, and vice versa.
Not only was the green zone a high-probability sell zone, a short from here was in line with the predominant trend. Support and resistance areas are always best traded in line with the predominant trend, in this case the trade is visible within a downtrend.
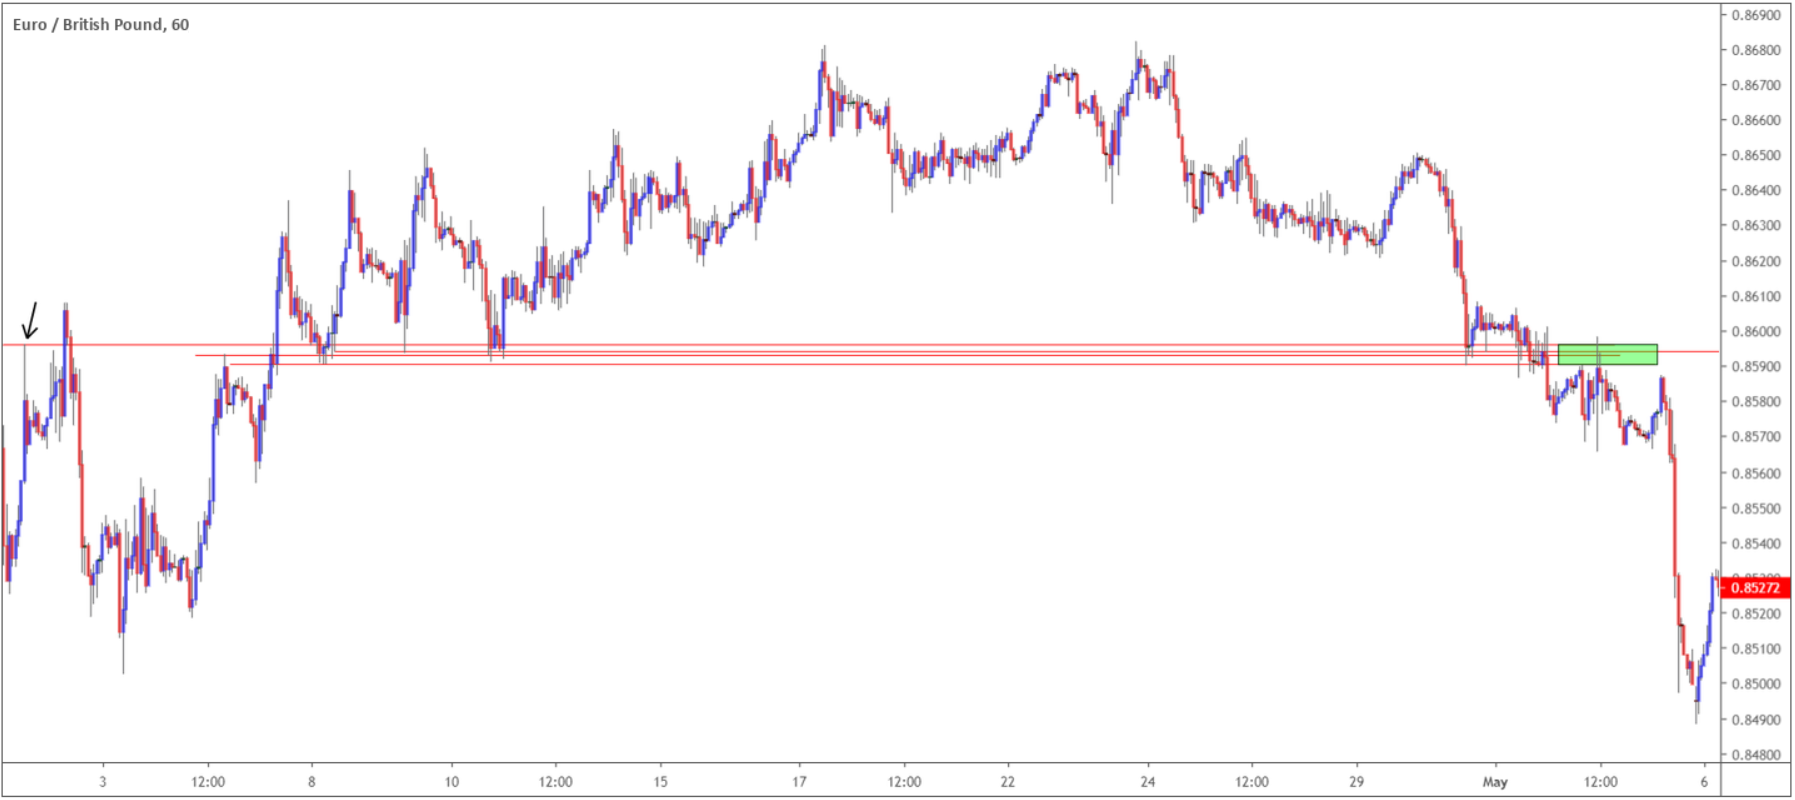
(Figure 1.3)
Although trader subjective, higher-timeframe support and resistance areas typically pack the heavier punch over its lower-timeframe counterparts. As an example, trading a support area may appear incredibly appealing on the H4 timeframe, though with a weekly resistance area in motion overhead it is unlikely to end favourably. This is why it pays to analyse multiple timeframes and know where you’re positioned in the bigger picture.
Can a breakout of an area be anticipated?
Often, volume is a clue a breakout is about to occur. However, the foreign exchange market is decentralised, as opposed to a centralised exchange, such as the New York Stock Exchange (NYSE), which has its orders routed to one central exchange with no other competing market. Over the counter FX markets (or commonly referred to as the spot FX market) uses the volume the broker provides, therefore making it difficult to use for the application of anticipating a breakout across the global forex market.
In its place, spot FX traders tend to use price action as a gauge to future market direction. One way of attempting to anticipate a breakout is analyse the reactions off an area. Bounces from a support area should form higher highs, for example. Should this not occur and price action fails to break previously set highs, this is a clue to weakening price action to the downside and a breakout beneath the support area may soon take shape.
As shown in figure 1.4, a clear resistance area formed over several days (red arrows) and was eventually consumed and retested as a support zone. Price action shows point two retesting the area as support after forming a high at one. Following this a fresh higher high at three formed – a sign of strength. Point four retests the lows and rallies to a high set at five, though struggles to penetrate the high at three. Point six bottoms and attempts another advance, but is unable to overthrow the high at five.
Do you see what’s happening here? Failing to achieve fresh highs off the support zone reveals buyer interest as potentially fragile and, therefore, can lead to a breakout lower, which is what occurred in this instance.
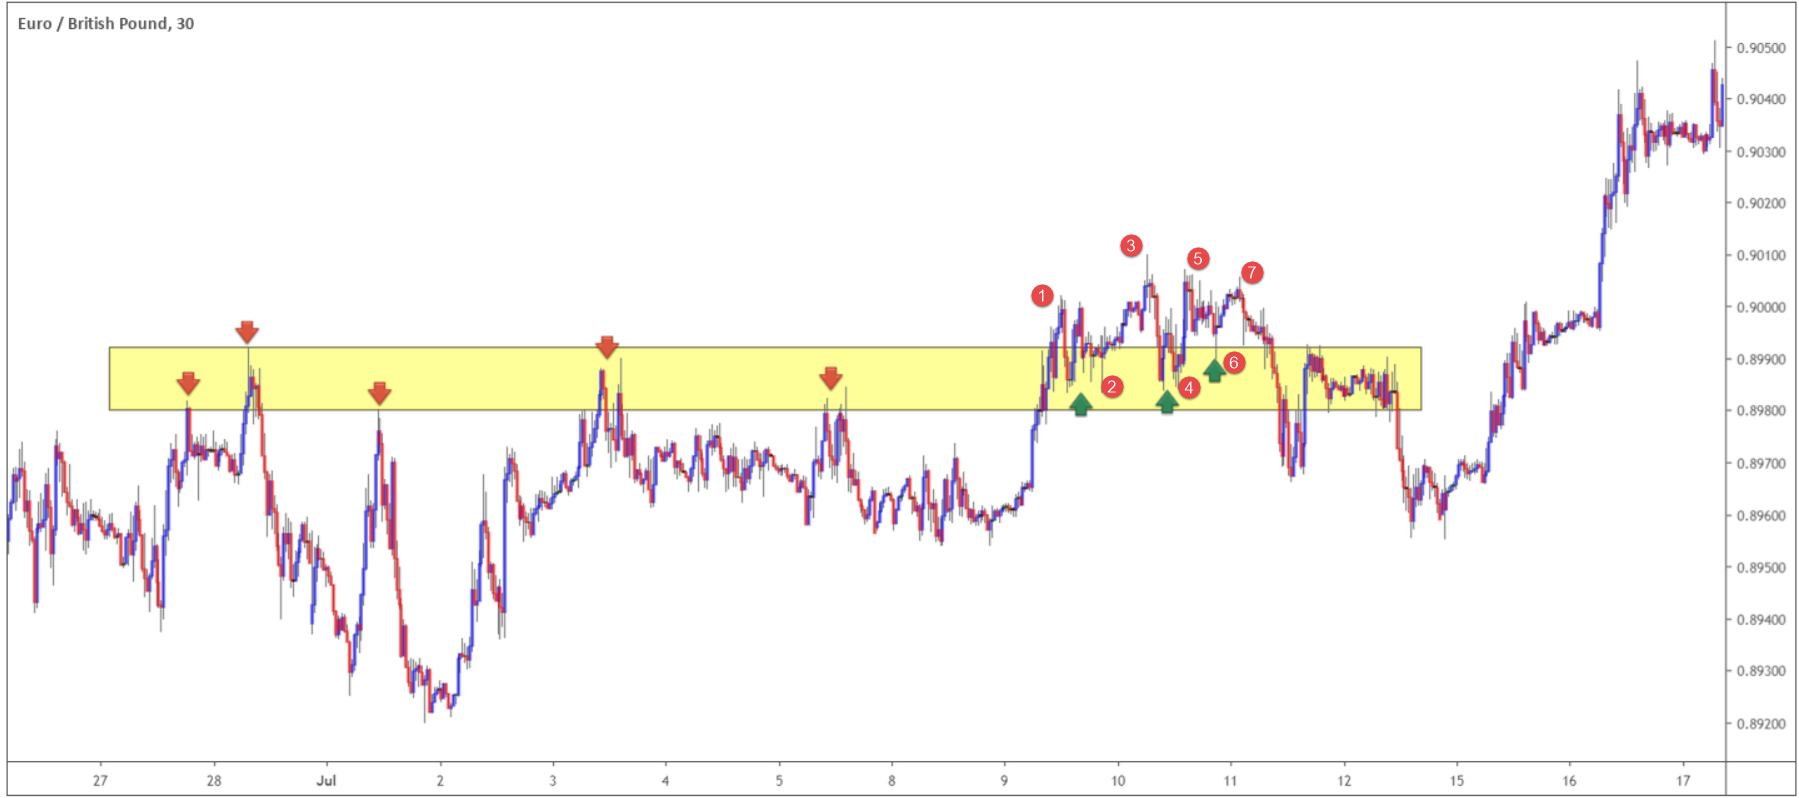
(Figure 1.4)
Breakout vs. fakeout
Being able to define between consumption and a fakeout is difficult.
To help, several filters exist to identify whether a support and resistance zone has been consumed or a fakeout might be in motion.
Some opt to use a pre-determined moving average. The rationale behind this approach is price action needs to close beyond the zone as well as the moving average in order to label an area as consumed. Sometimes, depending on the moving average settings, this is challenging.
Another option is employing pivot point levels. Only once price has crossed beyond a neighbouring pivot point barrier that lies outside the support and resistance zone of interest, would a consumption label be applied.
Other traders favour the Average True Range indicator, which measures the average of the difference between each candlestick high and low over a pre-determined period. An alternative to this is the use of time price action spent outside of the area in question.
A common method of confirming a breakout, which many traders feel is the more reliable approach, is a price close: waiting for a candle close to form beyond the selected zone. This helps eliminate exogenous occurrences causing premature fakeouts, often referred to as whipsaws.
A clean example of using the closing price as a filter to identify consumption over a fakeout is found in figure 1.5. Note the support area held price action higher on a number of occasions (red circles). It was only once a defined bearish close formed did price action display confirmation the zone was taken out. Before that, two fakeouts occurred (black arrows) which likely caught and trapped a number of breakout traders.
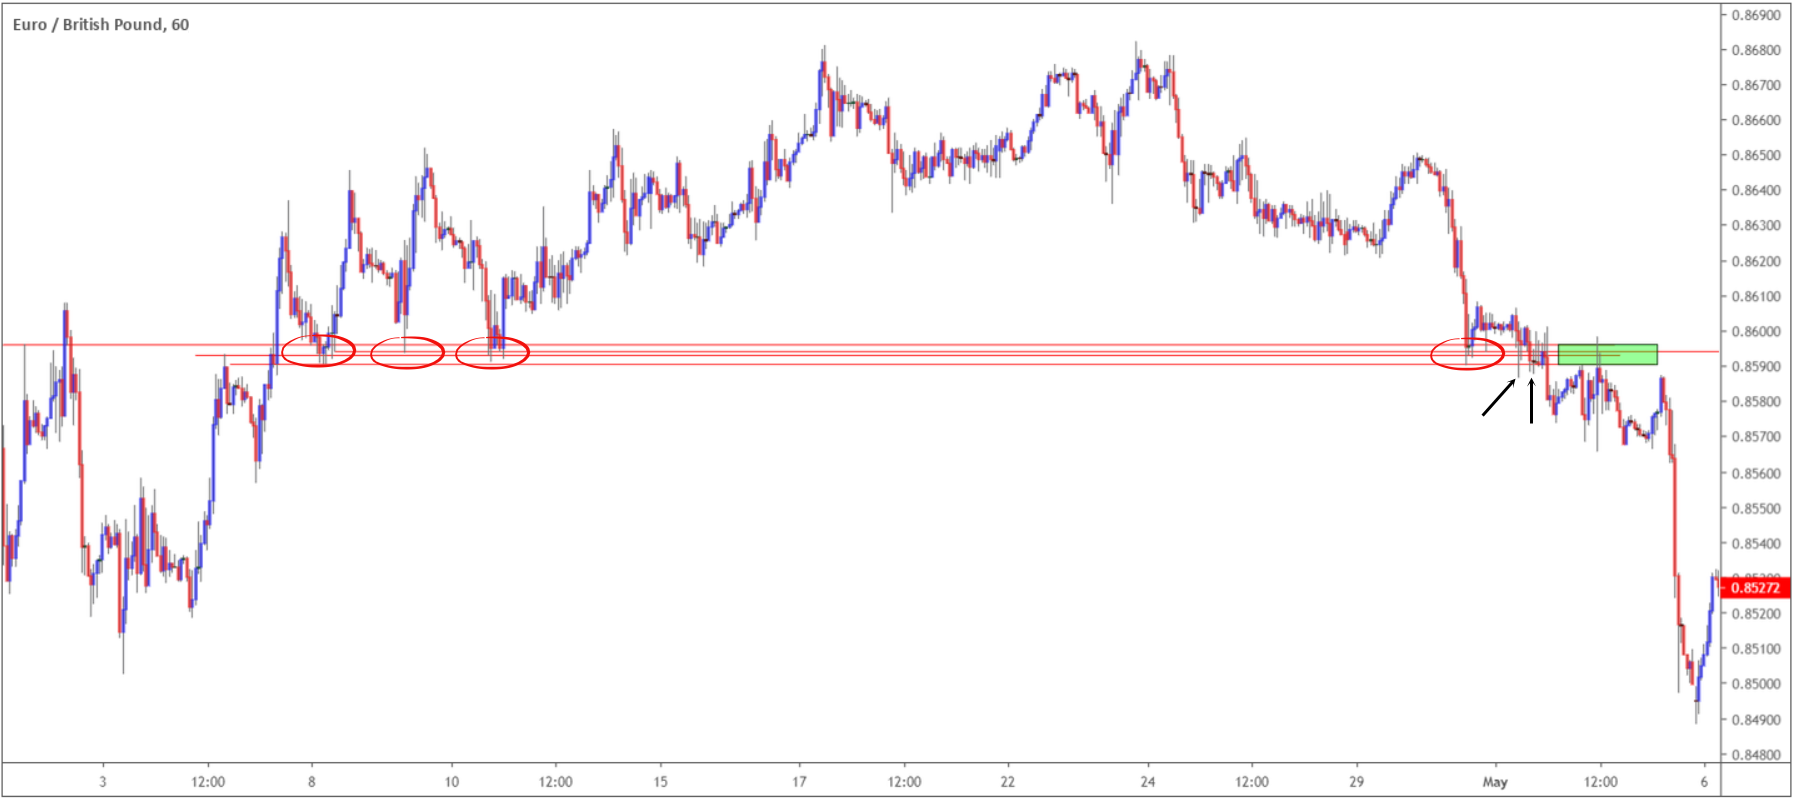
(Figure 1.5)
Chart time is ESSENTIAL
Knowing how to identify support and resistance is crucially important. Of course, traders can opt for objective support and resistance, such as pivot-point calculations, psychological numbers, Fibonacci retracements or even dynamic levels off of moving averages, but in doing so you’ll miss out on several high-probability trades.
Do yourself a HUGE favour and spend time examining the charts, noting subtle nuances that occur around support and resistance zones and look to see where improvement lies.
How many times does an area respond before breaking?
Do the areas usually offer support/resistance once consumed?
Do additional tools help identify notable areas? For example, does having indicator-based divergence or trend line convergence help confirm a zone?
Does waiting for Japanese candlestick confirmation improve the odds an area will hold?
These are just some of the questions that need answering before you begin formulating a trading strategy. Why not take advantage of our demo trading platform and start testing today?
It’s free to open, practice until you’re ready to go live and all account types, platforms and products supported: https://www.icmarkets.com/au/en/open-trading-account/demo


