A note on lower timeframe confirming price action…
Waiting for lower timeframe confirmation is our main tool to confirm strength within higher timeframe zones, andhas really been the key to our trading success. It takes a little time to understand the subtle nuances, however, as each trade is never the same, but once you master the rhythm so to speak, you will be saved from countless unnecessary losing trades. The following is a list of what we look for:
- A break/retest of supply or demand dependent on which way you’re trading.
- A trendline break/retest.
- Buying/selling tails – essentially we look for a cluster of very obvious spikes off of lower timeframe support and resistance levels within the higher timeframe zone.
- Candlestick patterns. We tend to only stick with pin bars and engulfing bars as these have proven to be the most effective.
EUR/USD:
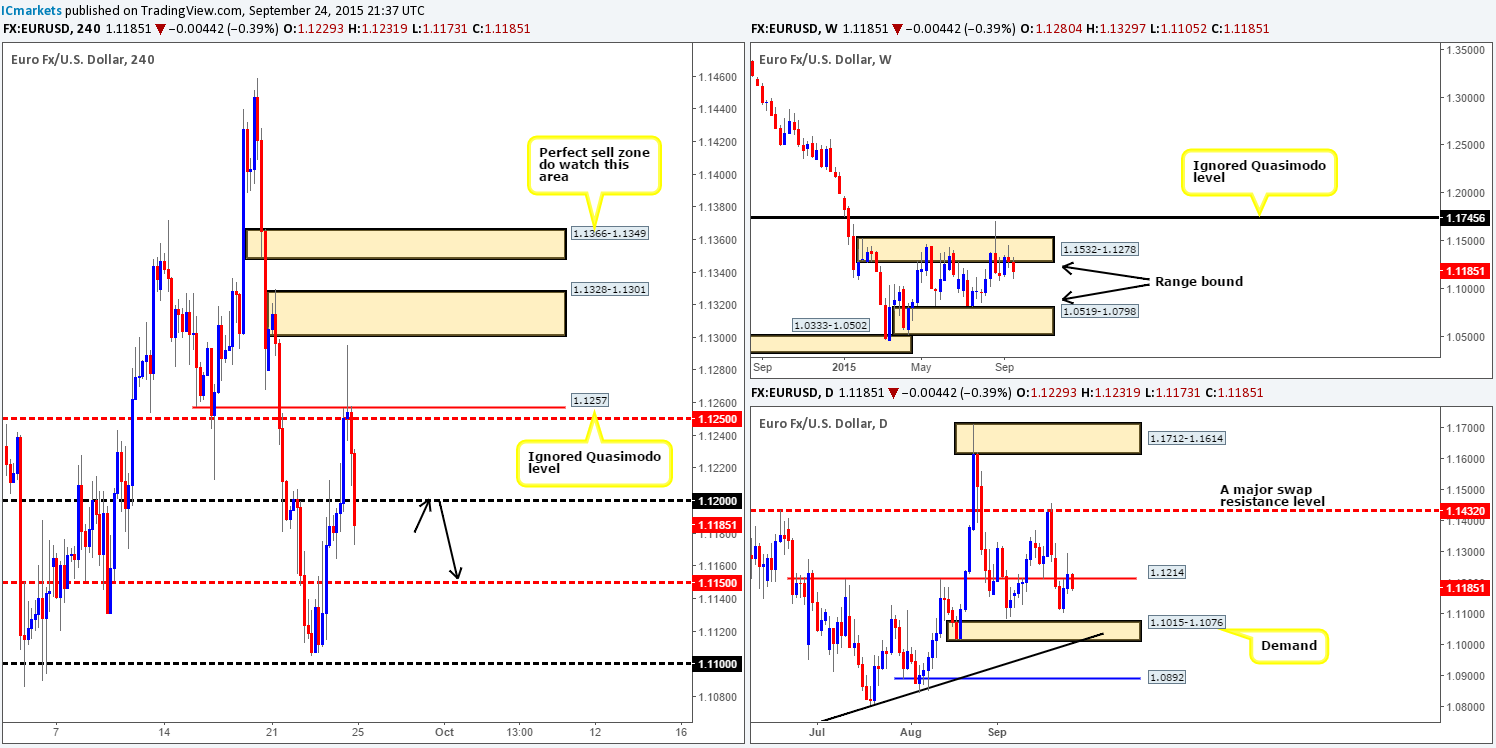
It was quite a wild day for the EUR/USD pair yesterday. The bulls initially spring boarded themselves north, reaching highs of 1.1295. However, things quickly turned sour as U.S. traders entered the arena. Price aggressively corrected itself, consequently printing a vicious selling wick and selling off into the close 1.1229.
As the market moves into Friday, we can see the EUR continues to plummet as price is now seen trading below psychological support 1.1200. Should this continue and price closes below 1.1200, this market will likely touch gloves with the mid-level barrier 1.1150 sometime soon. Should price retest 1.1200 before doing so, traders may want to keep an eye on how the lower timeframe price action responds heresince a (confirmed) sellis very possible.
Supporting a move to the downside, it appears bearish pressure looks to be coming in not only from the daily swap (resistance) level at 1.1214, but also off the back of weekly supply at 1.1532-1.1278. It will be interesting to see where the market ends this week.
Levels to watch/live orders:
- Buys:Flat (Stop loss: N/A).
- Sells:1.1200 [Tentative- confirmation required] (Stop loss: dependent on where one confirms this level).
GBP/USD:
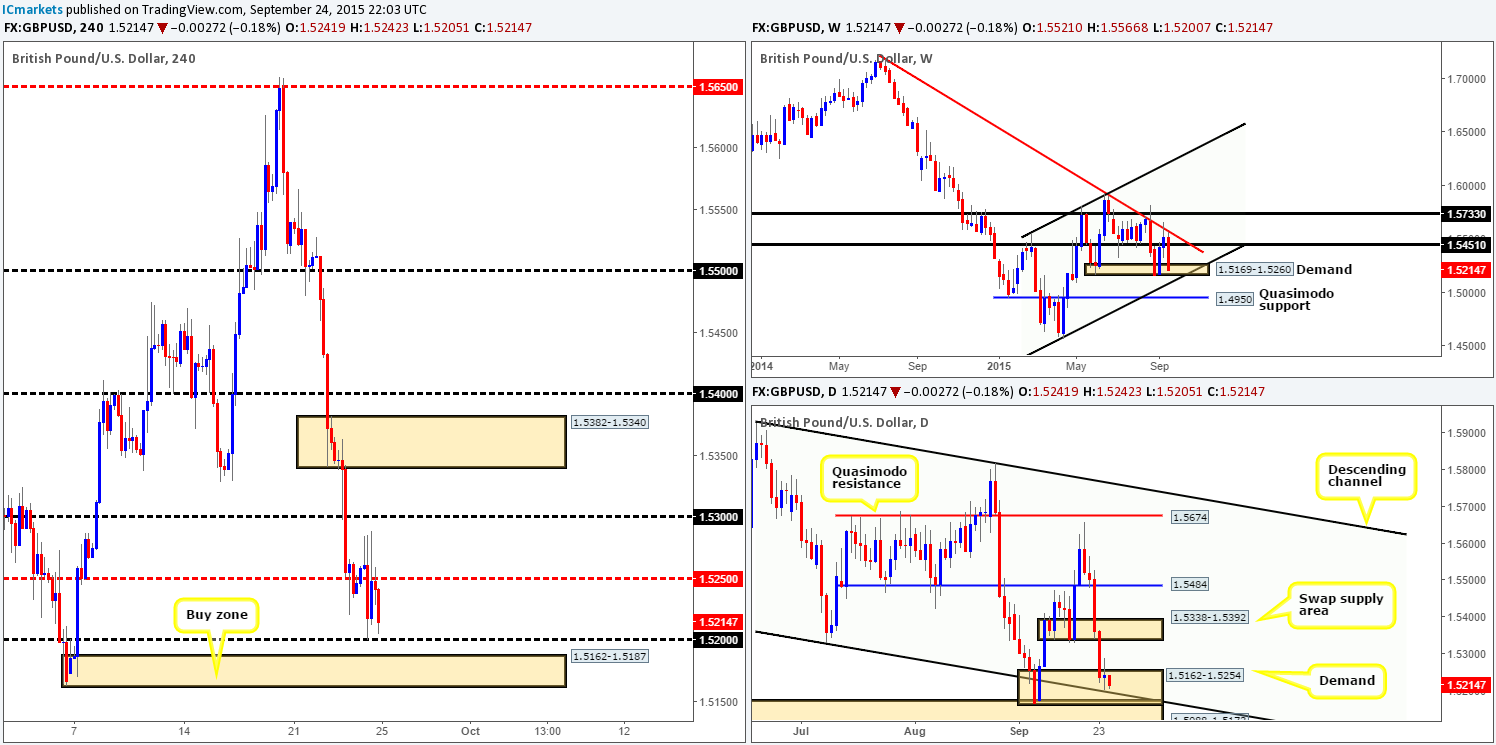
Amid yesterday’s trade, intraday resistance seen at 1.5260 managed to hold Cable lower, resulting in price printing a beautiful array of selling wicks. Psychological support at 1.5200 also saw some action as bids were filled at this level mid-way through London trade, which, thanks to resistance at the mid-level number 1.5250, price is close to retesting once more.
Going forward, we still remain confident in a reaction being seen from 4hr demand at 1.5162-1.5187, which is perfectly positioned just below 1.5200. Thus, we have left our pending buy order at 1.5188, and stop at 1.5157 in place for now.
Our rationale behind this buy trade is as follows:
- Price is lurking within weekly demand at 1.5169-1.5260.
- Daily action recently printed an indecision candle within demand at 1.5162-1.5254 off the back of descending channel support taken from the low 1.5329.
- The fact that 1.5200 responded as support is fantastic. Traders will be expecting this number to once again hold as support. We, however, believe bids have dried up here and the big boys are ready to take out stops below this number into our aforementioned 4hr demand zone.
Hopefully, once Europe opens for business, we’ll see our buy order filled. Ultimately, we’re eyeing 1.5250 as our immediate take-profit area. Beyond that, however, we’ll look to trail this market behind distinct lower timeframe supports until stopped out.
Levels to watch/ live orders:
- Buys: 1.5188 (Stop loss: 1.5157).
- Sells: Flat (Stop loss: N/A).
AUD/USD:
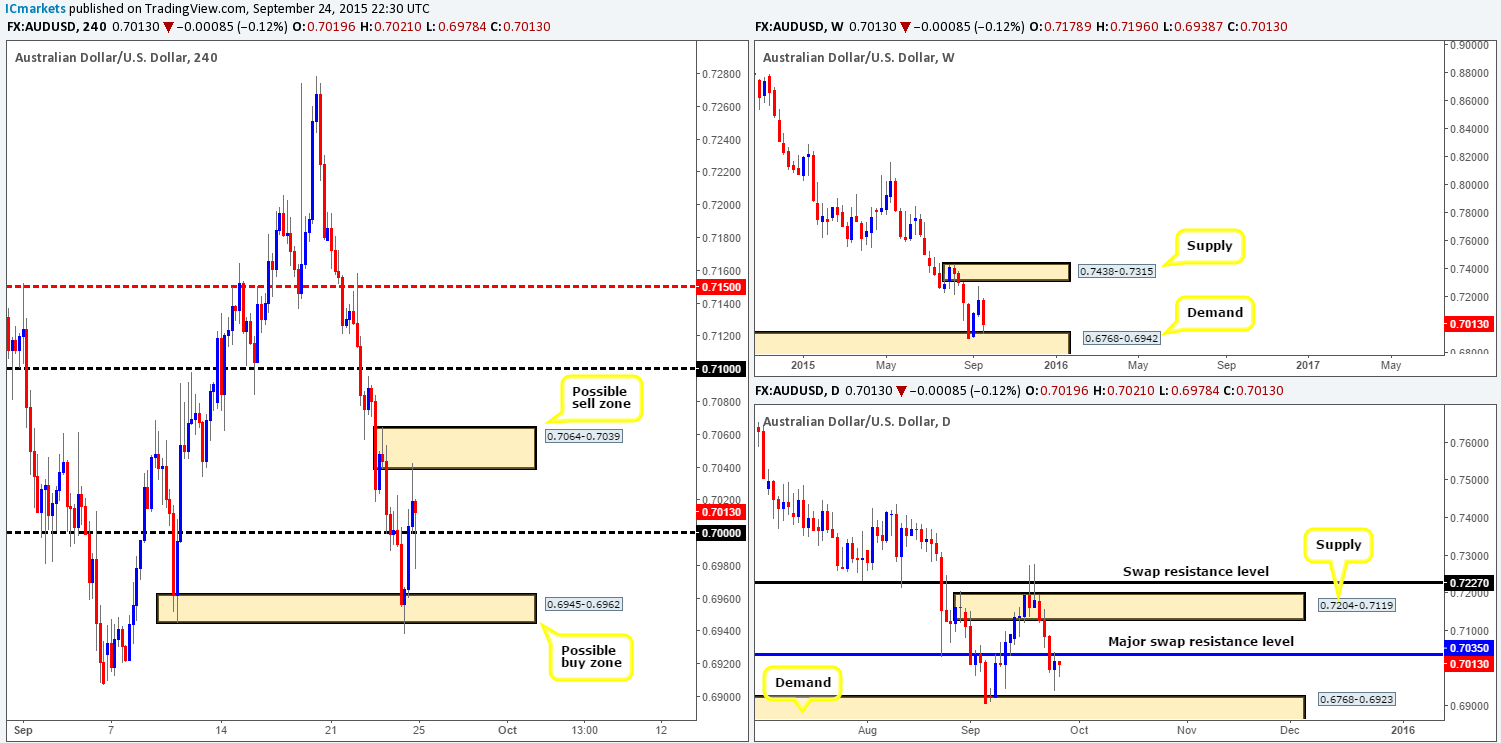
Looking at the Aussie’s 4hr chart this morning, we can see that the 0.7000 handle did eventually give way as expected. Shortly after this break, price hit and slightly faked below demand coming in at 0.6945-0.6962, which, as you can see, was clearly enough to support a counterattack back up above 0.7000 and into supply at 0.7064-0.7039.
With price now once again nibbling around the 0.7000 mark, where do we see this market heading today? Well, considering that the weekly demand at 0.6768-0.6942 was tagged into the action yesterday, and the daily swap (resistance) level at 0.7035 appears to be holding firm, there is somewhat of a tug-of-war taking place at the moment. Therefore, as 4hr supply at0.7064-0.7039 appears to be supported by the aforementioned daily swap (resistance) level, and the 4hr demand at 0.6945-0.6962 backed by the above said weekly demand, it is difficult to judge direction until either one of the above breaks.
As such, the most conservative path, in our opinion, is to watch both of the aforementioned 4hr areas for potential today. Should either produce lower timeframe price action to trade, we believe it’s likely worth at least a scalp to 0.7000. Let’s see what happens…
Levels to watch/ live orders:
- Buys: 0.6945-0.6962 [Tentative – confirmation required] (Stop loss: dependent on where one confirms this area).
- Sells:0.7064-0.7039 [Tentative – confirmation required] (Stop loss: dependent on where one confirms this area).
USD/JPY:
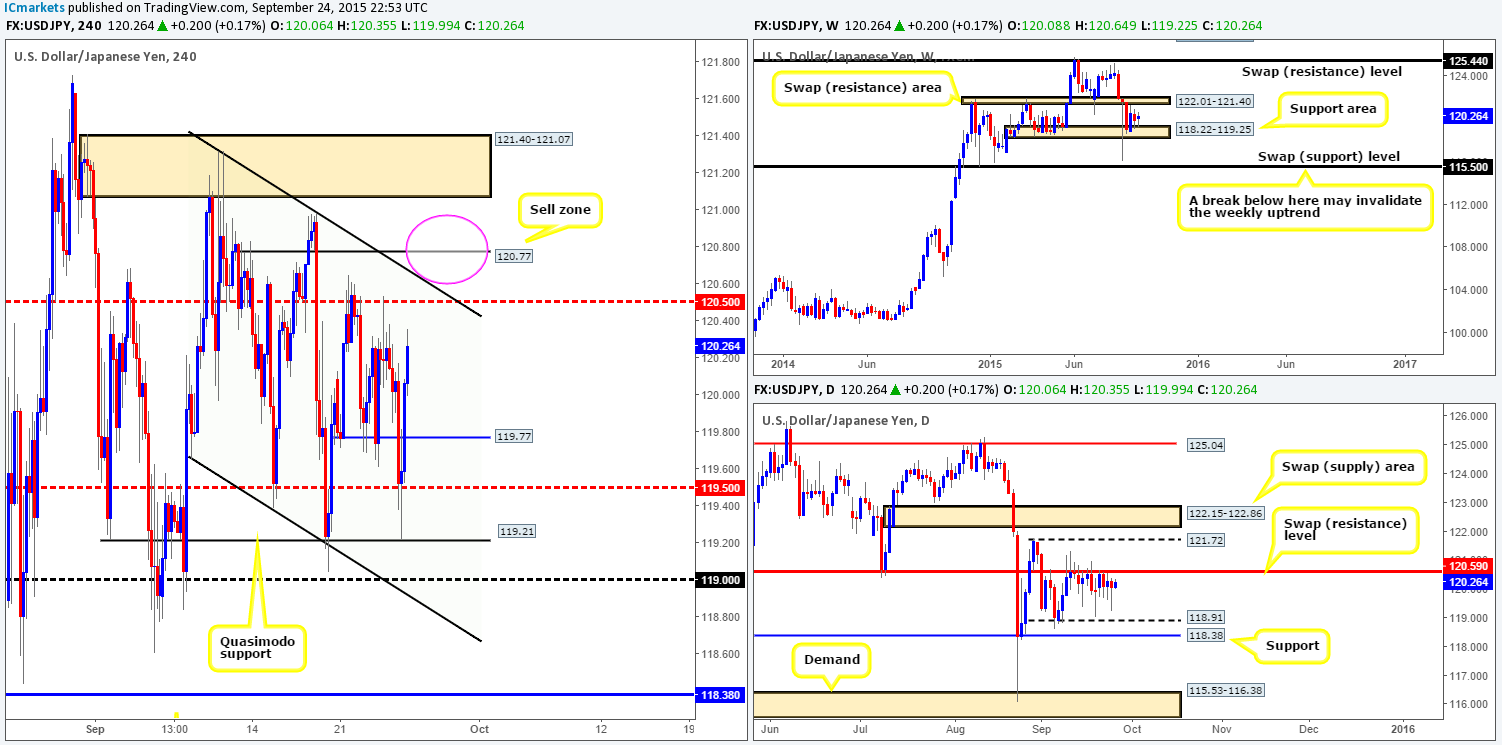
Recent action on the USD/JPY 4hr chart shows price tumbled during the London morning session yesterday, taking out both support at 119.97 and aggressively faking below the mid-level number 119.50 into Quasimodo support 119.21. The response from this barrier was, as you can see, just as aggressive as the approach. Price has so far rallied over 100 pips and is relatively close to crossing swords with mid-level resistance 120.50.
Should 120.50 see some action today, we feel this level will not hold and price will fake above to the 120.77 region – our pre-determined sell zone. We have been banging on about this level for the past couple of days now since we believe it to be a very high-probability turning point in this market. Not only does this hurdle coincide relatively nicely with 4hr channel resistance (121.31), but also sits just above the daily swap (resistance) level at 120.59.
However, in light of price recently crossing paths with a weekly support area at 118.22-119.25, shorting from 120.77 might be a risky trade without confirming price action from the lower timeframes beforehand. On that account, do trade cautiously here guys!
Levels to watch/ live orders:
- Buys: Flat (Stop loss: N/A).
- Sells:120.77 [Tentative – confirmation required] (Stop loss: dependent on where one confirms this level).
USD/CAD:
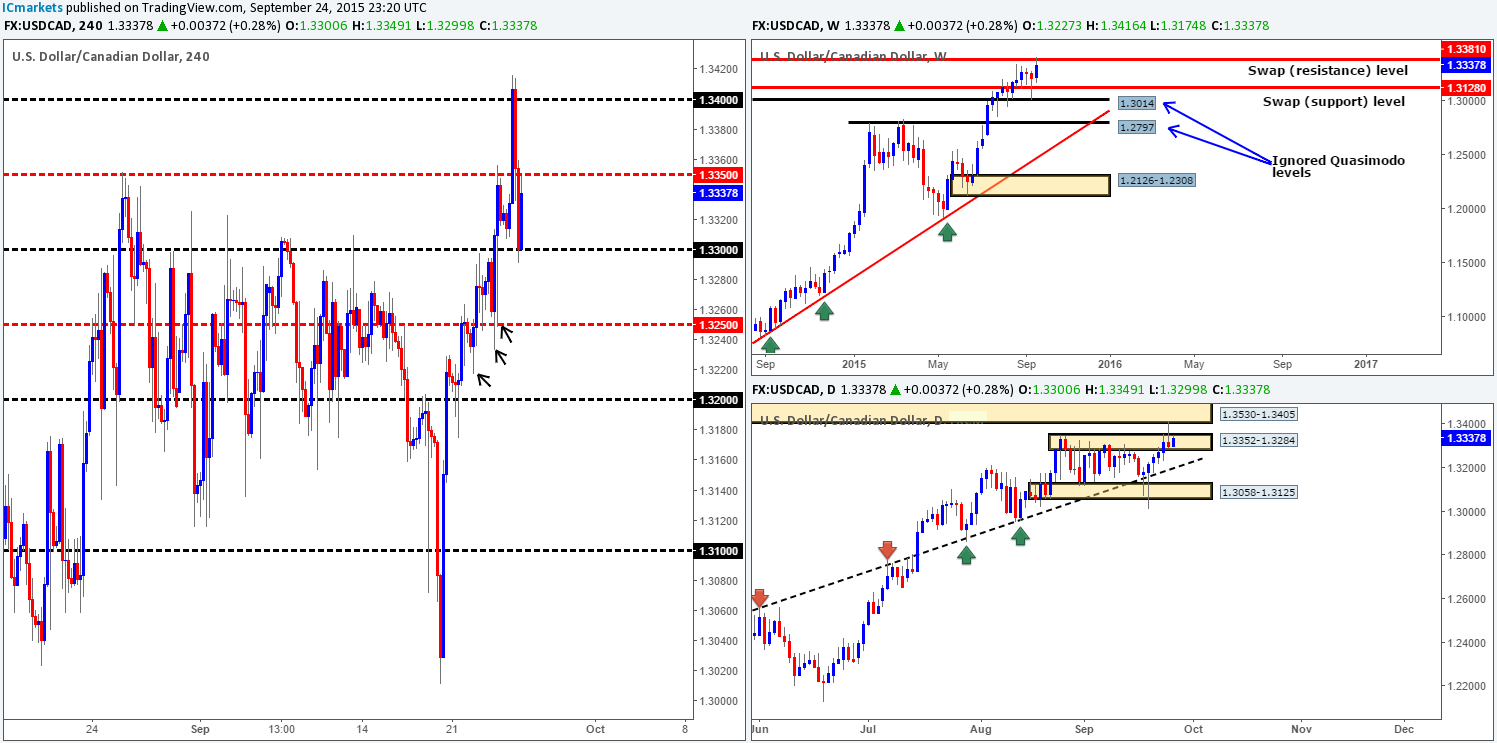
What a shame! We mentioned in our previous report (http://www.icmarkets.com/blog/thursday-24th-september-spotlight-is-on-the-eur-and-u-s-dollar-related-pairs-today-expect-volatility/) that if price connected with the 1.3300 handle yesterday, we’d begin looking for confirmed longs into this market up to 1.3379. As can be seen from the 4hr chart, price missed our buy level by a mere seven pips before rocketing north to our target! Very frustrating!
Once the market shook hands with the 1.3400 handle, it was essentially game over for longs at this point. Stops above this number were collected, and price dropped like a rock, taking out 1.3350 and eventually hitting and rebounding from 1.3300. This sell-off should not really come as much of a surprise, as price collided with not only a weekly swap (resistance) level at 1.3381, but daily action also saw a beautiful pin up to supply at 1.3530-1.3405.
In light of the above, we see price struggling to get above 1.3350 today with the possibility of a breakdown below 1.3300. Should 1.3300 give way, we’d need to see price retest this number as resistance together with lower timeframe selling confirmation to condone a short from here. Ultimately, if a sell setup is seen, we’ll be targeting 1.3200, but would consider liquidating some of our position around the mid-level number 1.3250 if it shows strength. Check out the very obvious demand consumption tails seen marked with black arrows at: 1.3249/1.3233/1.3217.
Levels to watch/ live orders:
- Buys:Flat (Stop loss: N/A).
- Sells: Watch for bids at 1.3300 to be consumed and then look to enter on any retest seen at this number (confirmation required).
USD/CHF:
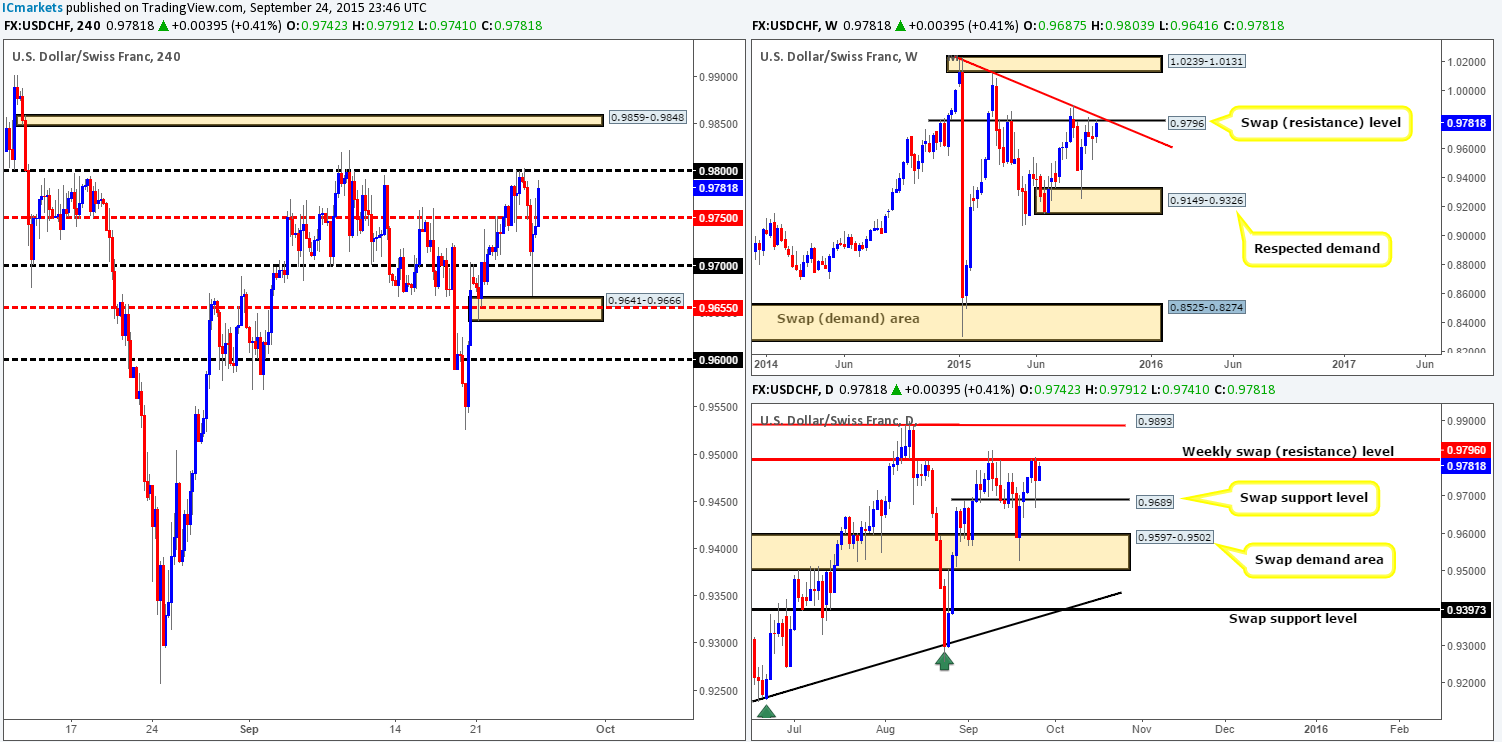
For those who follow our analysis on a regular basis, you may recall us mentioning to keep an eye on psychological resistance 0.9800 for potential shorts yesterday (http://www.icmarkets.com/blog/thursday-24th-september-spotlight-is-on-the-eur-and-u-s-dollar-related-pairs-today-expect-volatility/). Early trade saw price pin the underside of this number and plunge south. This sell-off saw this pair drop over 100 pips, taking out several 4hr technical levels in its way and only finding support once price stabbed into demand drawn from 0.9641-0.9666. Well done to any of our readers who managed to lock in some green pips from this move!
Looking at the daily chart, we can see price rebounded beautifully off the back of a swap support level at 0.9689. So, there should be no surprise why this 4hr demand saw such a volatile counter attack back up to the 0.9800 region. Does this mean 0.9800 has had its day? Not by a long shot! The reason we liked 0.9800 in the first place was because it was supported by a weekly swap resistance level at 0.9796, which converges beautifully with a weekly downtrend line from the high 1.0215. Therefore, there is a good chance that 0.9800 will hold again in our opinion. Do be prepared for a fakeout higher this time though since, like us, the market is likely expecting this number to hold, thus the big boys may edge price higher intostops sitting above to sell into.
However, in the event of a convincing close is seen above 0.9800, the next area to watch falls in at 0.9859-0.9848. Do take note of this area for a potential bounce trade as we know it may not appear significant, but these almost hidden zones usually produce enough of a bounce to profit from. On the flip side, do be careful if you’re considering buying the break above 0.9800 as you do not want to be on the wrong side of weekly flow. It will not likely do your account any favors!
Levels to watch/ live orders:
- Buys:Flat (Stop loss: N/A).
- Sells: 0.9800 [Tentative – confirmation required] (Stop loss: dependent on where one confirms this level) 0.9859-0.9848 [Tentative – confirmation required] (Stop loss: dependent on where one confirms this area).
DOW 30:
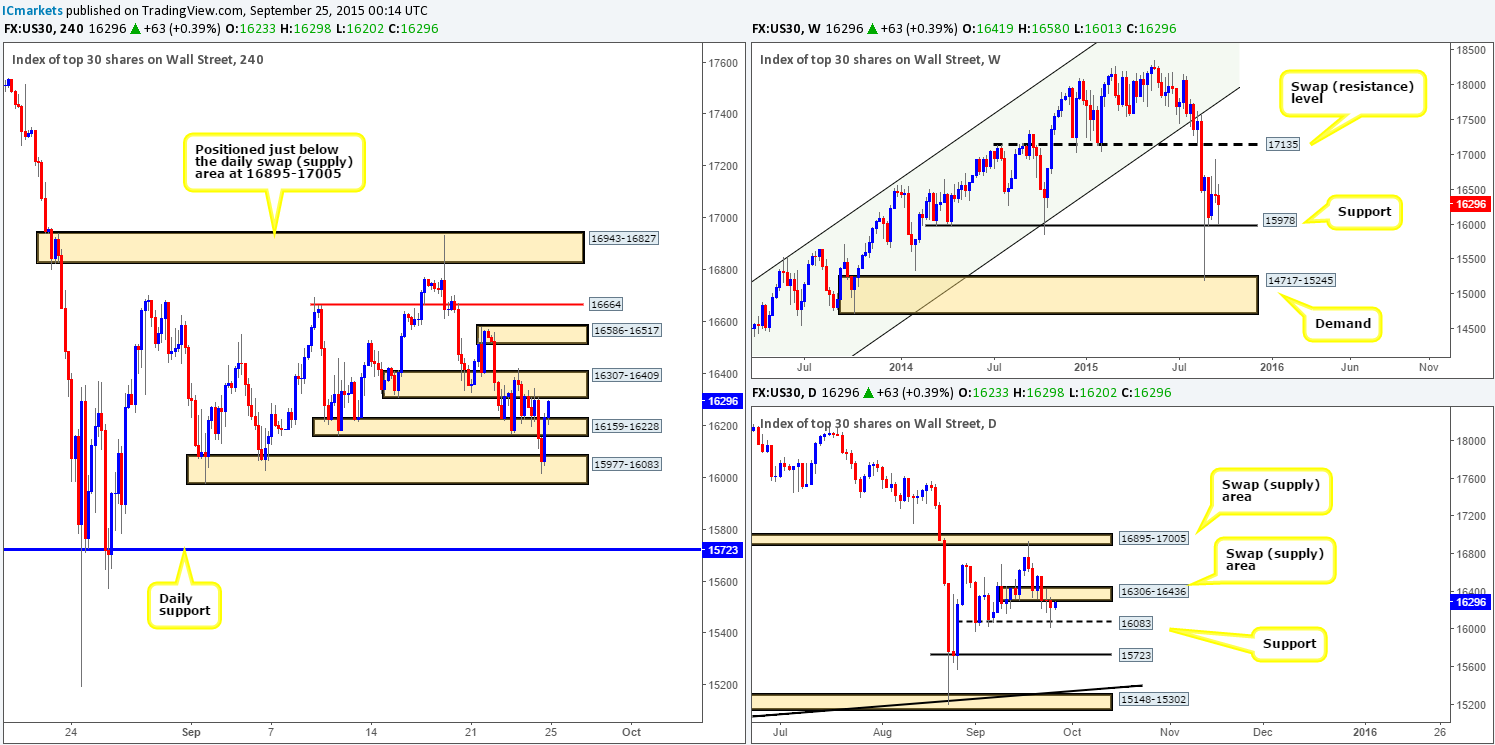
Just beautiful! Our team has been banging on about the 4hr demand area at 15977-16083 for quite some time now, and yesterday we saw this trade idea come to fruition. Our pending buy order was filled and price rallied north, just missing the underside of a daily swap (supply) area at 16306-16436. This wasclose enough for us to liquidate 70% of our position. We do hope some of our readers also got in on this move as it was very high-probability!
With our stop set to breakeven now and the remaining 30% of our position still active, we believe this index will eventually continue higher. The reason for this is simply because weekly support at 15978 is now in play. However, let’s not forget that price is, at the same time, hugging the underside of the aforementioned daily swap (supply) zone, so do be prepared for a pullback before any possible advance can take place. Considering that today is the last trading day of the week, our team has agreed that should price reach 4hr supply at 16586-16517, we’ll liquidate our full position. Should it not reach this high, nonetheless, and price does not take us out at breakeven, we don’t plan on leaving our position open over the weekend so we’ll just close up shop wherever price ends up on the week.
Levels to watch/ live orders:
- Buys: 16024 [LIVE] (Stop loss: breakeven).
- Sells:Flat (Stop loss: N/A).
XAU/USD: (Gold)
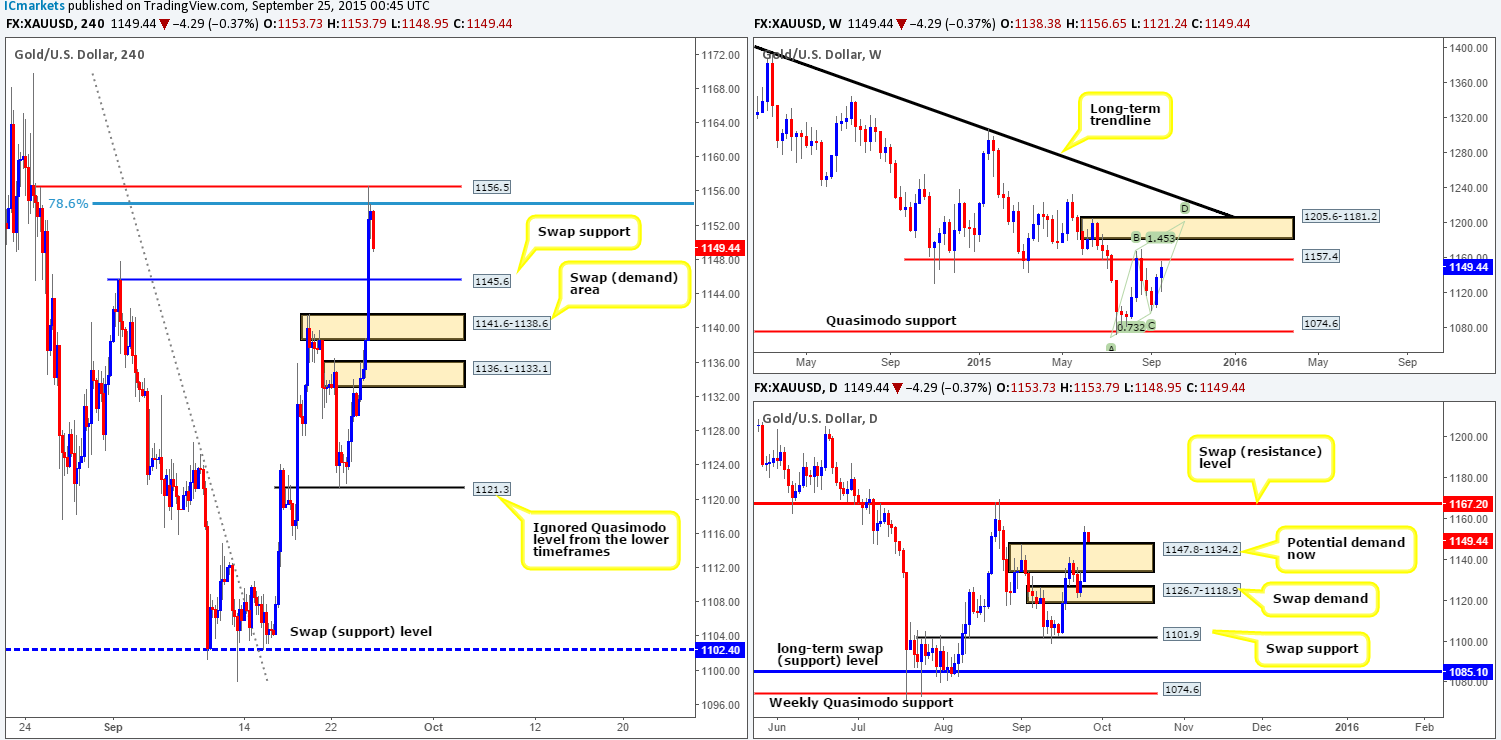
The Gold market saw a sharp increase in value during yesterday’s trade. We believe risk aversion inflamed this rally along with U.S. durable goods orders dropping 2% in the month of August. With this, we saw multiple 4hr areas consumed with prices reaching as high as a minor 4hr resistance at 1156.5. This level not only converged closely with a 78.6% Fib barrier, but also just missed connecting with theweekly swap (resistance) zone at 1157.4. Therefore, at least from a technical standpoint, there is no surprise Gold is pulling back right now.
In the event that the sellers continue to force this market lower from here today, it’s likely we’ll see price cross swords with a 4hr swap (support) level at 1145.6. This – followed closely by the swap demand area below at 1141.6-1138.6 are two areas we’ll be keeping a close eye on today for potential (confirmed) buys. The reason being is simply because these two zones are supported by a recently broken daily supply area (now demand) at 1147.8-1134.2. As such, even with weekly resistance in play now (see above), a bounce from either of the above said 4hr areas is highly likely in our book.
Levels to watch/ live orders:
- Buys: 1145.6 [Tentative – confirmation required] (Stop loss: dependent on where one confirms this level) 1141.6-1138.6 Tentative – confirmation required] (Stop loss: dependent on where one confirms this area).
- Sells:Flat (Stop loss: N/A).


