A note on lower timeframe confirming price action…
Waiting for lower timeframe confirmation is our main tool to confirm strength within higher timeframe zones, and has really been the key to our trading success. It takes a little time to understand the subtle nuances, however, as each trade is never the same, but once you master the rhythm so to speak, you will be saved from countless unnecessary losing trades. The following is a list of what we look for:
- A break/retest of supply or demand dependent on which way you’re trading.
- A trendline break/retest.
- Buying/selling tails/wicks – essentially we look for a cluster of very obvious spikes off of lower timeframe support and resistance levels within the higher timeframe zone.
- Candlestick patterns. We tend to only stick with pin bars and engulfing bars as these have proven to be the most effective.
We search for lower timeframe confirmation between the M15 and H1 timeframes, since most of our higher-timeframe areas begin with the H4. Stops are usually placed 5-10 pips beyond confirming structures.
EUR/USD:
During the course of yesterday’s sessions, the EUR currency received a boost after the ECB left monetary policy unchanged. However, as can be seen from the H4 chart, the buyers failed to sustain gains beyond this number, and consequently went on to print an aggressive two-candle (H4) whipsaw through the 1.13 handle.
While the pair is currently seen finding a foothold between a H4 support line at 1.1237 and a H4 mid-way support 1.1250, would we consider this a stable enough platform to buy from today? In short, we would not. Our reasoning lies within the higher-timeframe structures. Take a look over at the weekly chart. The shared currency is now crossing swords with the underside of a major resistance area seen at 1.1533-1.1278. Considering that this zone has managed to cap upside in this market since May 2015, buy trades are not really something our team would be comfortable with right now. Adding further to this, we can see that although price did in fact close higher yesterday, daily action printed a relatively aggressive bearish selling wick just above a support area coming in at 1.1224-1.1072.
Our suggestions: Ultimately, buying this market is off the menu for us today! We would, however, consider becoming sellers should the H4 candles close beyond (and retest) the current H4 support band, since there’s room for a run down to the 1.13 handle, followed by a H4 trendline extended from the low 1.1123 and then a H4 demand barrier seen at 1.1131-1.1143.
Should a sell come to fruition below 1.1237, you may want to keep in mind that you are effectively selling into a daily support area! Therefore, although you have weekly flow on your side so to speak (see above), we would advise keeping a close eye on the lower timeframe action (M30 and above) for any signs that the buyers may be gaining strength.
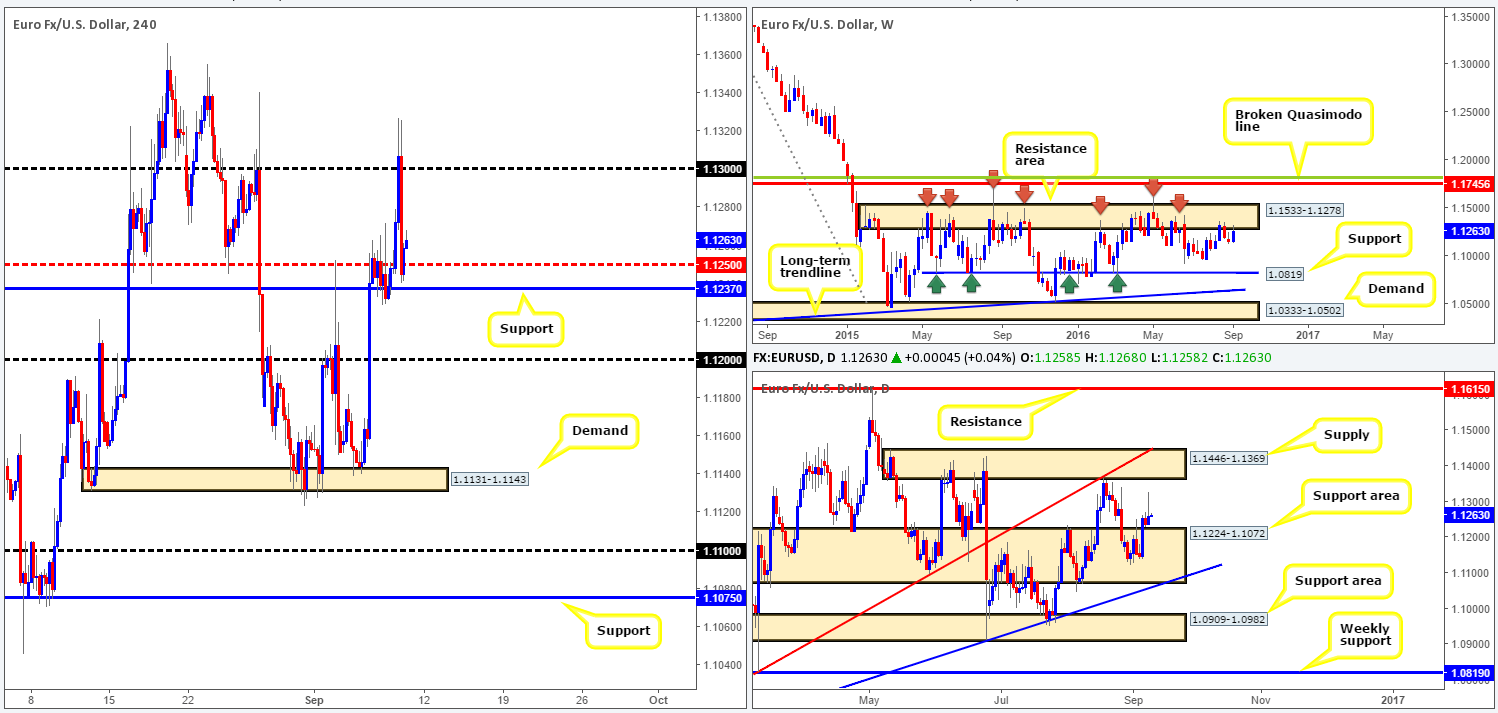
Levels to watch/live orders:
- Buys: Flat (Stop loss: n/a).
- Sells: Watch for price to close below the H4 support at 1.1237 and then look to trade any retest seen thereafter (lower timeframe confirmation required).
GBP/USD:
The GBP/USD suffered further losses yesterday, following a H4 rotation from the mid-way resistance 1.3350. Wednesday’s low 1.3318 was quickly taken out, allowing cable to breach and eventually close beyond the 1.33 handle by the day’s end.
Before we discuss possible setups in this market, let’s take a look at the overall picture. Looking up to the weekly chart, sellers are in the process of stamping in a clear bearish selling wick just ahead of a long-term resistance area at 1.3501-1.3804. Despite this, a quick scan on the daily chart shows that the buyers and sellers are currently battling for position within the lower limits of a demand zone chalked up at 1.3371-1.3279.
Our suggestions: Given the above notes, here is what we have logged going forward:
- Although price is currently finding support off the top edge of a H4 support area at 1.3290-1.3242, we would not consider this bullish since there is not only a far more attractive zone just below between the lower edge of the current H4 support area and a H4 support level drawn from 1.3261, but price also has to contend with the 1.33 band. Bolstered by a H4 AB=CD completion point at 1.3254, a H4 mid-way support 1.3250 and a H4 50.0% Fib support seen around the 1.3250 region, the above noted H4 buy area is likely to bounce prices. However, seeing as how the present H4 support area is positioned slightly below the current daily demand zone, and what with weekly action painting a rather bearish picture right now, we would only consider the above H4 buy zone as valid on the basis of a lower timeframe confirming buy signal. What we look for is either an engulf of supply followed by a retest, a trendline break/retest or simply a collection of well-defined buying tails around the higher-timeframe buy zone.
- Should the above said H4 support area be taken out, nevertheless, short trades on the retest of this boundary down to at least the 1.32 number, followed closely by H4 support at 1.3174 is also something we have our eye on today.
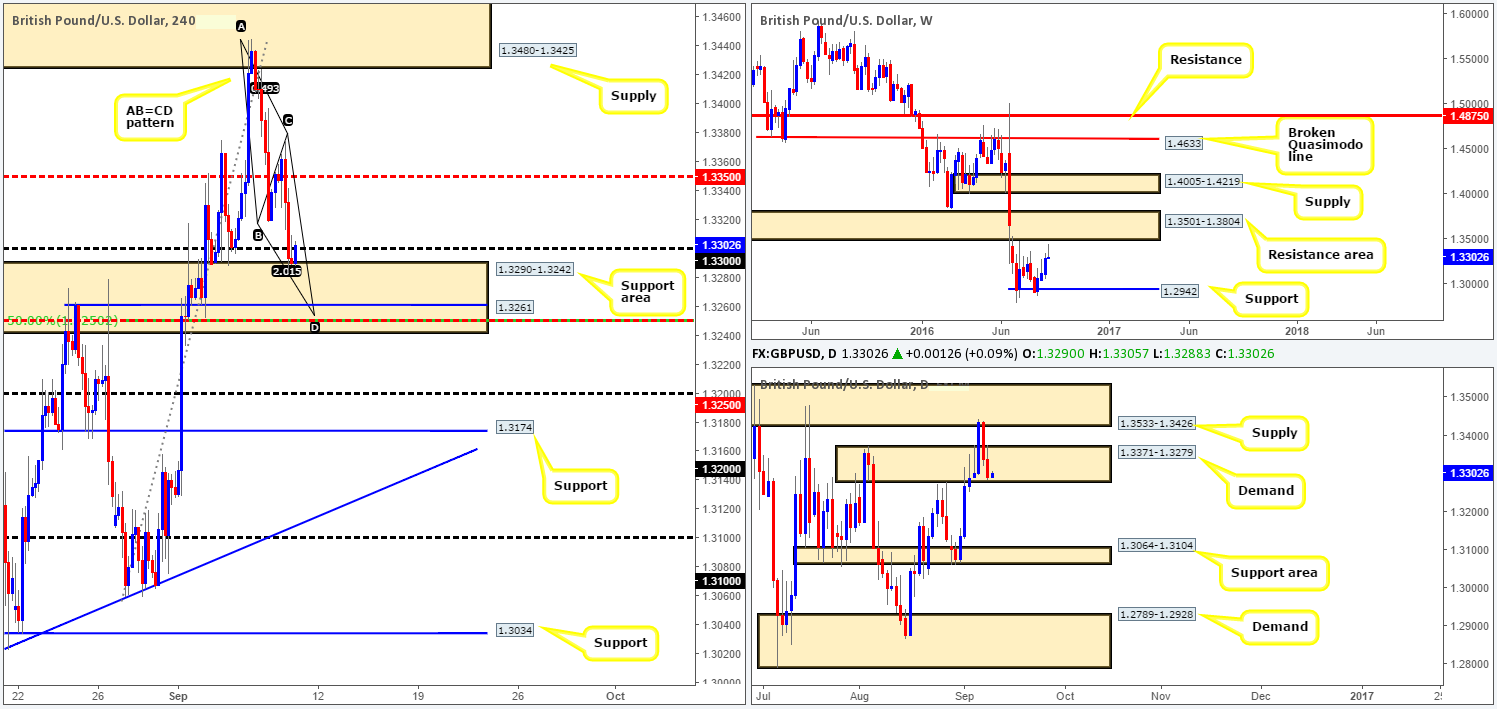
Levels to watch/live orders:
- Buys: 1.3290-1.3261 [tentative – confirmation required] (Stop loss: dependent on where one confirms this area).
- Sells: Watch for price to close below the H4 support area at 1.3290-1.3242 and then look to trade any retest seen thereafter (H4 bullish close required prior to pulling the trigger).
AUD/USD:
Kicking off this morning’s analysis with a look at the weekly chart shows that price is beginning to retreat from the trendline resistance extended from the high 0.8295. Ideally, what we’d like to see from here is a close below the resistance line at 0.7604. Sliding down to the daily chart, we can see that yesterday’s session printed a nice-looking bearish engulfing candle within the confines of a supply zone visible at 0.7719-0.7665. This – coupled with the recent pullback from the above said weekly trendline resistance could be enough to force prices back below the current weekly resistance today.
Turning our attention to the H4 chart, the commodity currency aggressively whipsawed through both the 0.77 handle as well as the H4 resistance level coming in at 0.7718. This was a noted level to watch for sells in our previous report – well done to any of our readers who managed to lock down a position from here. Yesterday’s US unemployment claims data came in better than expected, helping to push the pair below the H4 mid-way support line 0.7650 into the close.
Our suggestions: In view of price currently respecting the underside of 0.7650, we feel, given the higher-timeframe picture, that further downside may ensue towards the 0.76 boundary, which of course, represents the weekly resistance level discussed above. As such, should a lower timeframe sell signal (see the top of this report) form around the 0.7650 region, we would look to short, targeting 0.76 to end the week.
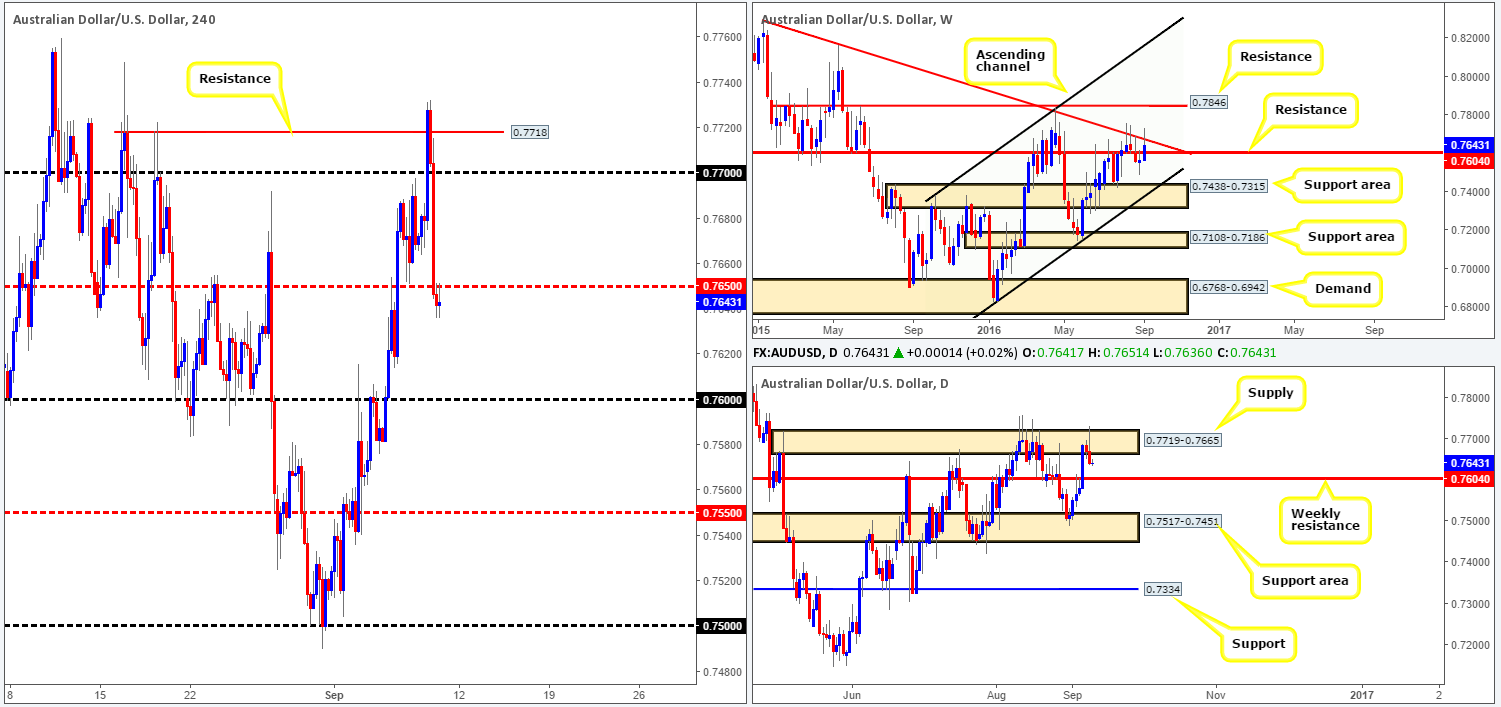
Levels to watch/live orders:
- Buys: Flat (Stop loss: n/a).
- Sells: 0.7650 region [tentative – confirmation required] (Stop loss: dependent on where one confirms this area).
USD/JPY:
As London came to a close yesterday, we saw the US dollar notably rally against the JPY, taking out the 102 handle and ending the day peaking around the H4 mid-way resistance 102.50. What this recent bout of buying also did was bring daily action up to a minor resistance coming in at 102.38. This, along with weekly price still showing room for this market to decline down to support at 100.61, we feel the rebound from the H4 102.50 band may extend lower as we enter into the more liquid sessions today. Downside H4 targets to have noted are the 102 handle and the newly-formed H4 demand area at 101.41-101.62. Beyond this barrier, however, we’re also looking at the H4 support at 100.87 and the aforementioned weekly support coming in at 100.61.
Our suggestions: Keep an eye on lower timeframe action around the current 102.50 level. Should one manage to pin down a position from here, look to take partial profits at the above noted (bold) zones. In the event that price manages to reach 100.87, we would advise liquidating all short positions around this region. The reason as to why is between this H4 support and the weekly support at 100.61, we have a strong-looking buy zone. Bolstered by a H4 trendline support taken from the low 99.64 as well as a H4 78.6% Fib support at 100.56, this area has enough confluence to buy from here without requiring the backing of lower timeframe confirmation
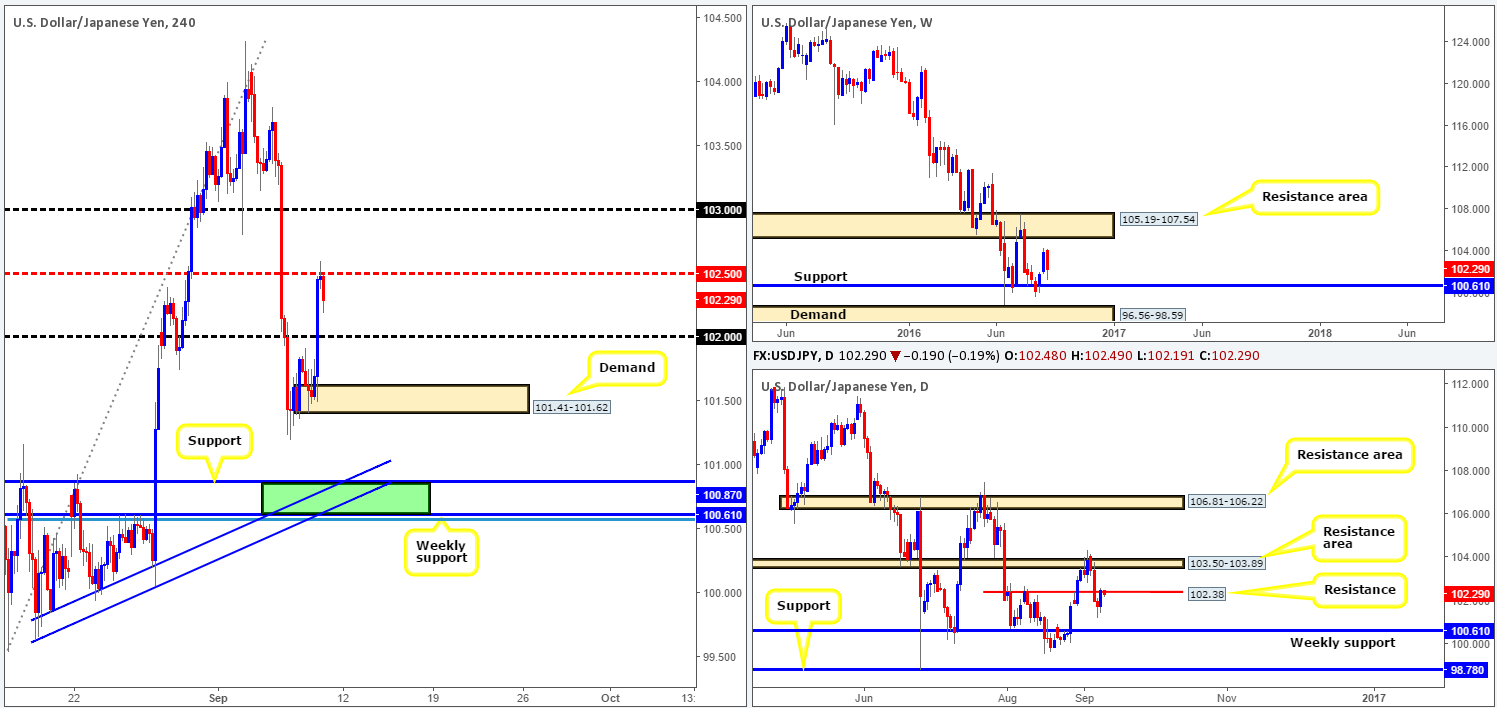
Levels to watch/live orders:
- Buys: 100.88 [pending order] (Stop loss: 100.48).
- Sells: 102.50 region [tentative – confirmation required] (Stop loss: dependent on where one confirms this area).
USD/CAD:
Early on in yesterday’s London morning session, we saw the USD/CAD rebound beautifully from a minor H4 support level penciled in at 1.2858. This eventually took out the 1.29 band and wound up reaching highs of 1.2939 on the day, recording the pair’s second consecutive daily gain! This begs the question whether there’s a chance the US dollar will push for its third consecutive gain today? Well, from the daily chart’s perspective, there’s room seen to the upside towards the 1.3001 mark: a resistance level. In spite of this, looking up on the weekly chart, price is trading from a supply zone coming in at 1.3295-1.3017, with room seen to decline further down to 1.2658: a 38.2% Fib support.
Our suggestions: To become buyers in this market, a decisive close (followed by a retest and a H4 bullish close) would need to be seen above the H4 mid-way resistance 1.2950. That way we’d not only have some confirmation that the bulls are gathering momentum from the daily support level at 1.2845, but the path beyond 1.2950 would also likely then be cleared up to the key figure 1.30, which as we already know is also a daily resistance level. In regard to selling, we would want to see the current daily support band taken out before deciding on the best course of action.
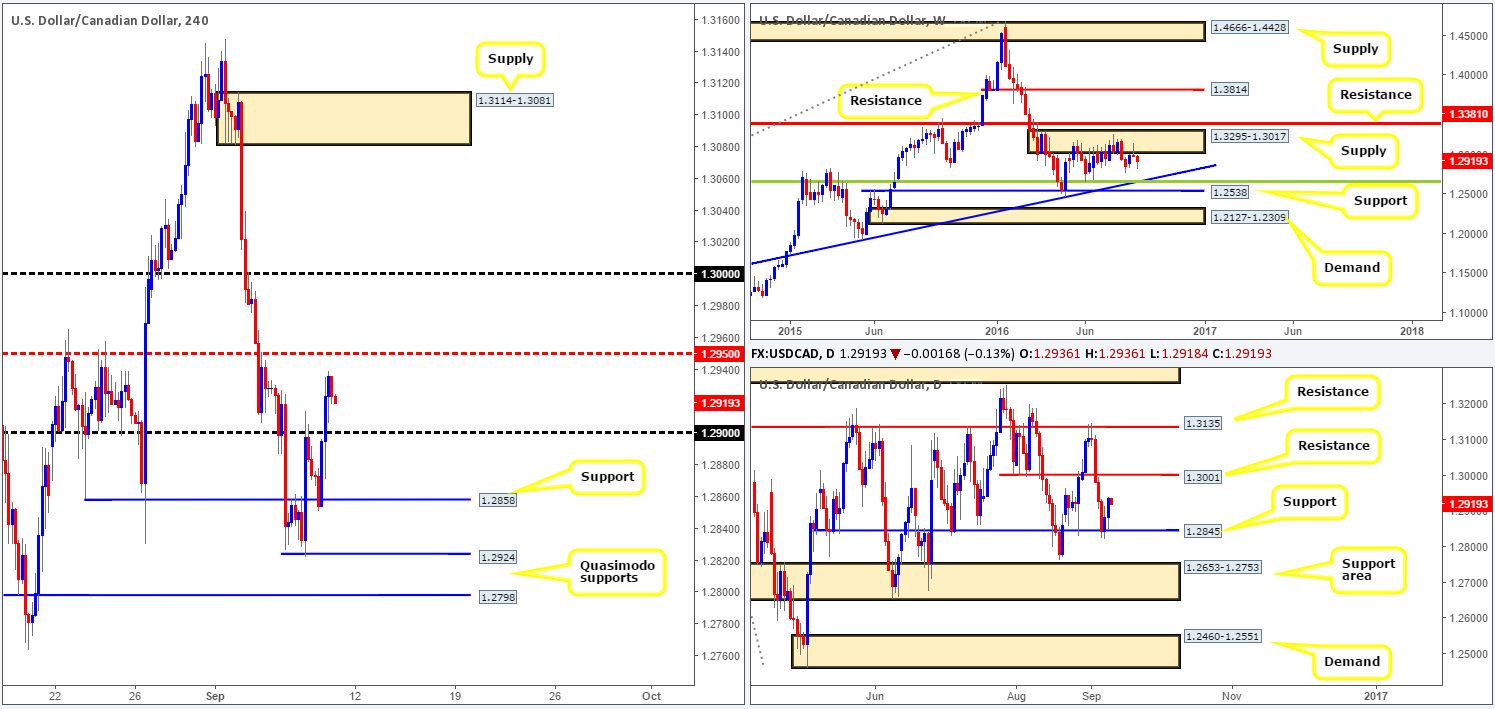
Levels to watch/live orders
- Buys: Watch for price to close above the 1.2950 region and then look to trade any retest seen thereafter (H4 bullish close required prior to pulling the trigger).
- Sells: Flat (Stop loss: n/a).
USD/CHF:
Across the board, we saw the US dollar rally higher yesterday, aggressively bouncing from a H4 support seen over in the US dollar index at 94.59. The USD/CHF pair, as you can see, began to bottom out just ahead of a H4 support at 0.9648, helped by better than expected US unemployment claims data. Technically speaking, this move was also bolstered by a daily support area seen at 0.9648-0.9708, which ended with the daily candle printing a bullish engulfing formation into the close. As a result, the psychological boundary 0.97 was taken out, potentially clearing the path northbound for further buying today up to the H4 resistance level coming in at 0.9762.
Our suggestions: Quite simply, we recommend waiting for price to retest the 102 neighborhood today. Should this take place and price chalks up a H4 bullish close, a long trade from this region, given the daily structure in place (see above), is, at least in our book, most certainly a valid setup.
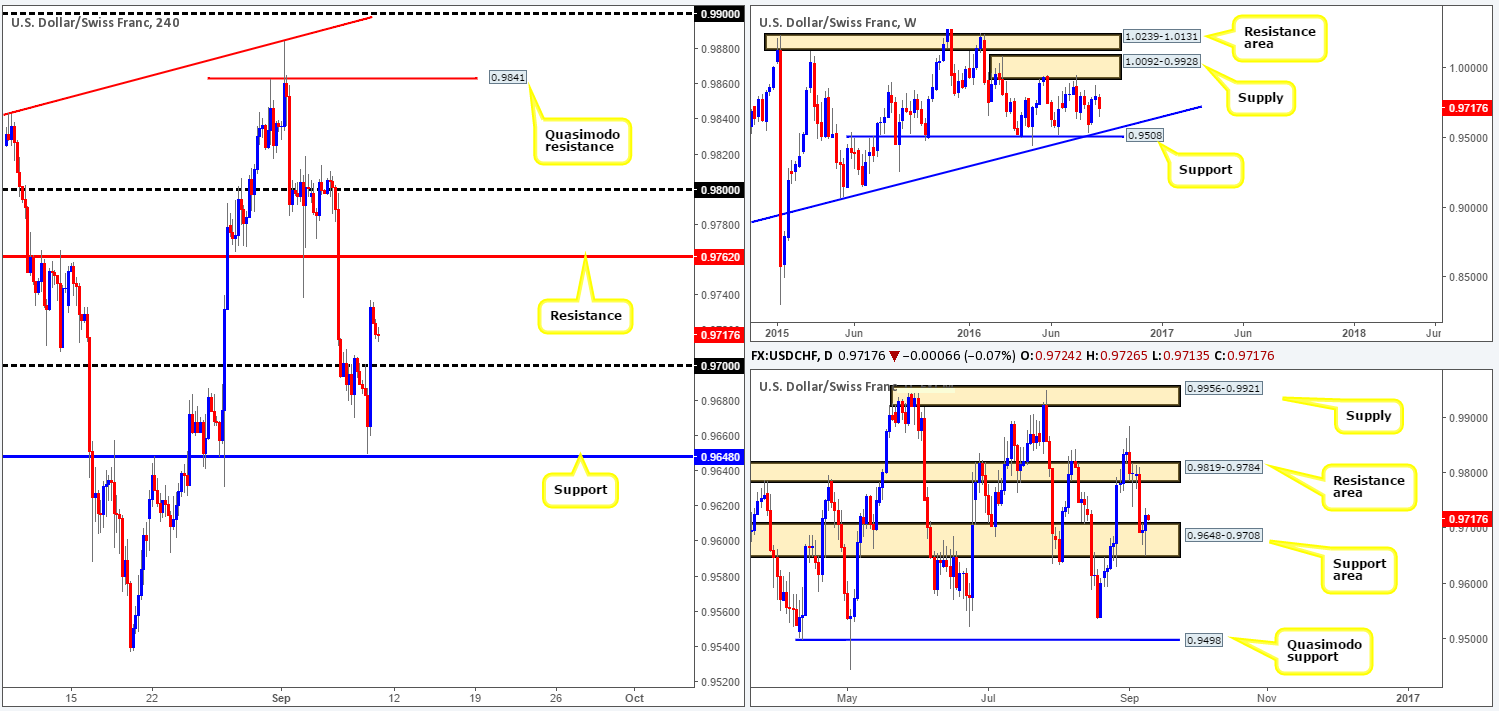
Levels to watch/live orders:
- Buys: 0.97 region [H4 bullish close required] (Stop loss: below the trigger candle).
- Sells: Flat (Stop loss: n/a).
DOW 30:
After the European Central Bank decided to leave monetary policy unchanged, this triggered a sharp sell off in the US Equity market yesterday. The DOW aggressively broke below the H4 consolidation lows at 18485, and went on to tag a H4 demand base seen at 18467-18446, which as you can see, is currently holding form. On the assumption that further downside is seen today, it’s possible that price action may be dragged down to H4 demand seen at 18321-18349.
With the above in mind, let’s see how the land lies over on the bigger picture. Weekly price remains firm above a support area coming in at 18365-18158, and has been since July 25th. Looking down to the daily chart, the index remains trading mid-range between 18322/18636. However, yesterday’s selling managed to chalk up a strong-looking bearish engulfing candle, which smothered three prior candles!
Our suggestions: To our way of seeing things, the H4 demand base is likely to give way today. The reasons for why simply comes down to the daily bearish engulfing candle and room seen on both higher-timeframe charts to move lower. Therefore, although the predominant trend is still facing north, we will be looking to short beyond the current H4 demand base today. A close below here followed up by a retest and a H4 bearish close, would, at least in our view, be sufficient enough to condone shorts, targeting the H4 demand base mentioned above at 18321-18349.
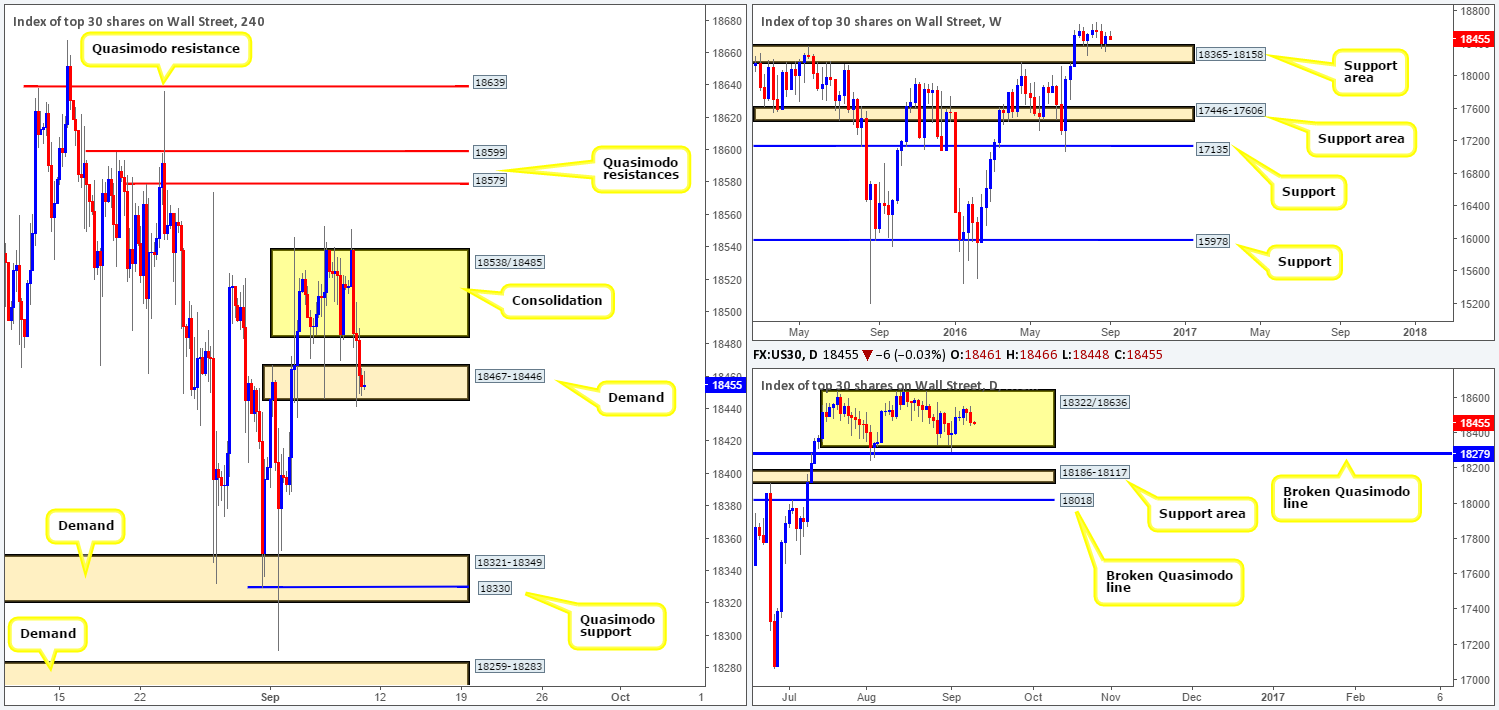
Levels to watch/live orders:
- Buys: Flat (Stop loss: n/a).
- Sells: Watch for price to close below the H4 demand at 18467-18446 and then look to trade any retest seen thereafter (H4 bullish close required prior to pulling the trigger).
GOLD:
(Trade update: live trade taken from 1345.9 was stopped out at 1340.5).
Dollar gains nudged the yellow metal lower yesterday, consequently taking out a H4 support area at 1344.5-1341.0 and reaching lows of 1335.6. This second consecutive daily loss has potentially opened up the floodgates for a move down to H4 support seen at 1332.3, and possibly the H4 support area at 1325.3-1322.8 (sits directly on top of a daily demand zone at 1305.3-1322.8 – the next downside target on the daily timeframe) today. However, before considering a sell, one must take into account that weekly action is still reflecting a rather bullish stance above the support area at 1307.4-1280.0, and could still extend up to the Quasimodo resistance level coming in at 1361.7.
Our suggestions: Other than looking for short trades within the H4 resistance area at 1344.5-1341.0, we see very little else to hang our hat on at the moment. Thanks to weekly action, our team will not look to enter short from the current H4 resistance area without the backing of lower timeframe confirmation (see the top of this report). Only once we have a solid sell signal form within the H4 sell zone, would we then look to short, targeting 1332.3, and then with a little bit of luck hopefully the H4 support area mentioned above at 1325.3-1322.8.
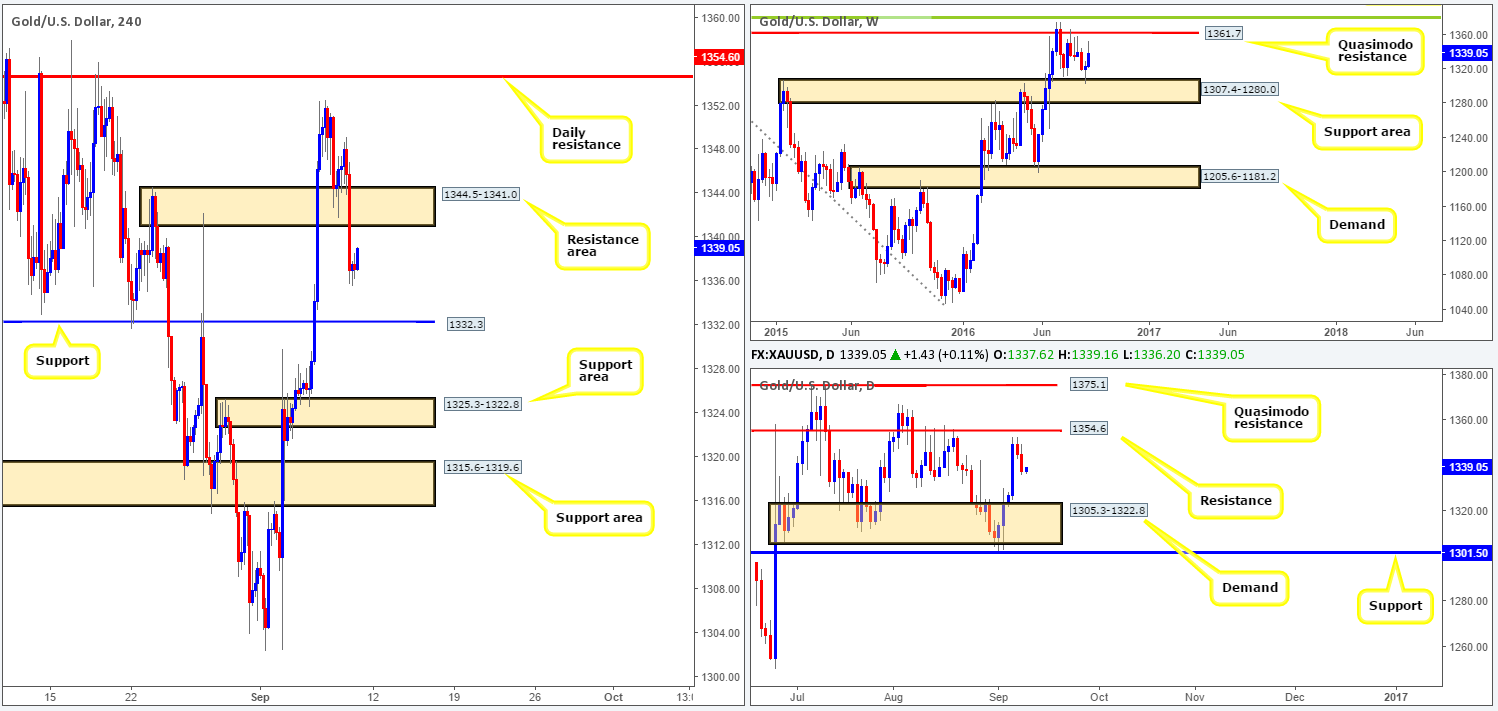
Levels to watch/live orders:
- Buys: Flat (Stop loss: n/a).
- Sells: 1344.5-1341.0 [tentative – confirmation required] (Stop loss: dependent on where one confirms this area).