A note on lower-timeframe confirming price action…
Waiting for lower timeframe confirmation is our main tool to confirm strength within higher timeframe zones, and has really been the key to our trading success. It takes a little time to understand the subtle nuances, however, as each trade is never the same, but once you master the rhythm so to speak, you will be saved from countless unnecessary losing trades. The following is a list of what we look for:
-
A break/retest of supply or demand dependent on which way you’re trading.
-
A trendline break/retest.
-
Buying/selling tails/wicks – essentially we look for a cluster of very obvious spikes off of lower timeframe support and resistance levels within the higher timeframe zone.
-
Candlestick patterns. We tend to stick with pin bars and engulfing bars as these have proven to be the most effective.
We typically search for lower-timeframe confirmation between the M15 and H1 timeframes, since most of our higher-timeframe areas begin with the H4. Stops are usually placed 3-5 pips beyond confirming structures.
EUR/USD:
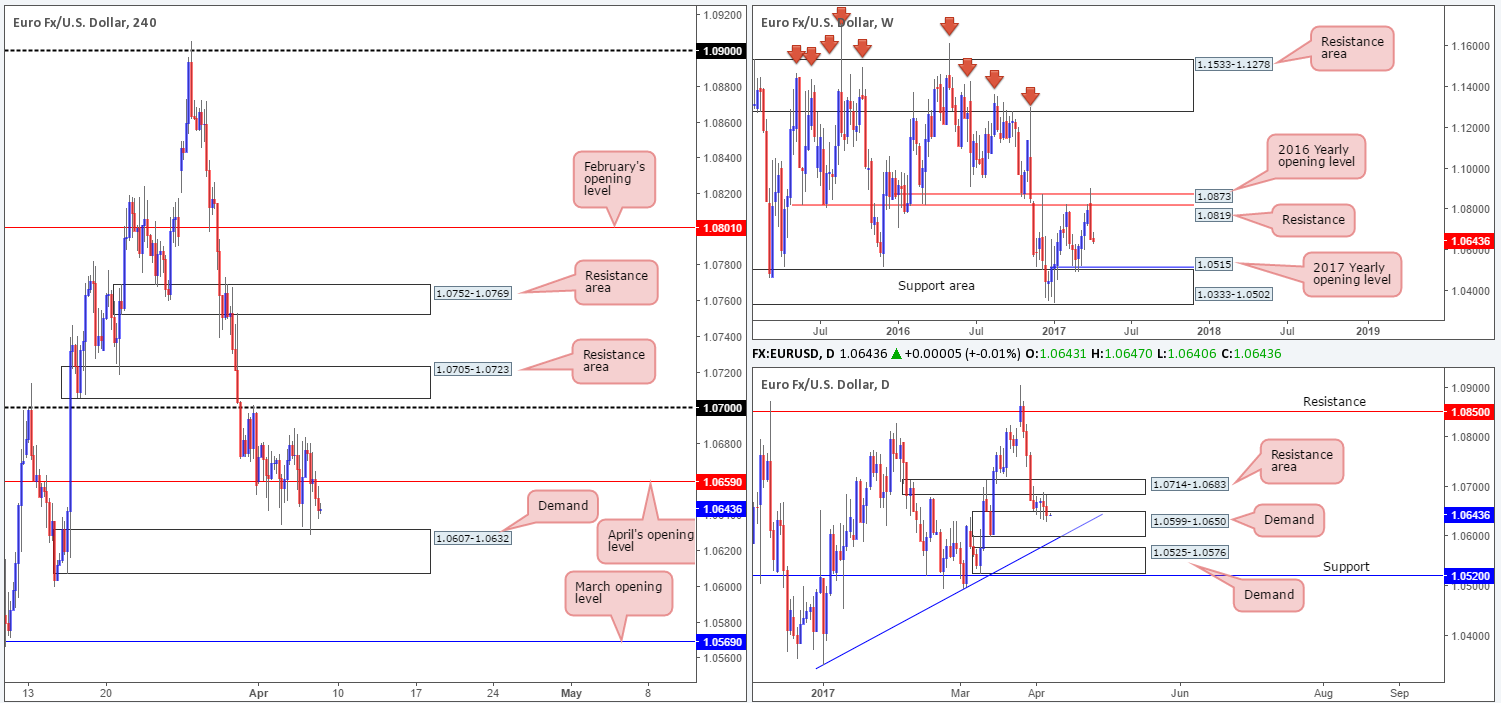
Since the beginning of the week, the single currency has been sandwiched between a daily demand base at 1.0599-1.0650 and a daily resistance area drawn from 1.0714-1.0683. Up on the weekly chart, nevertheless, the pair remains vulnerable to the downside, with little support seen in the picture until we connect with the 2017 yearly opening level at 1.0515/support area at 1.0333-1.0502.Jumping across to the H4 candles, price is seen trading beneath April’s opening barrier at 1.0659, and appears to be on course to shake hands with demand at 1.0607-1.0632 (located within the above said daily demand).
Today’s economic data brings out the main event of the week: the US non-farm payrolls employment report. Therefore, we may see price snap out of its consolidative phase. Beyond the current H4 demand, we have March’s opening level at 1.0569 in view. Above April’s opening line there’s the 1.07 handle, shadowed closely by a H4 resistance area penciled in at 1.0705-1.0723 to watch for.
Our suggestions: Right now, we see very little opportunity to trade, unless, of course, one fancies the idea of trading from the current H4 demand that’s bolstered by the daily demand at 1.0599-1.0650 (but this would place one against weekly flow – see above). Ultimately, we’re going to sit tight and see how price responds to the NFP report. Hopefully, it should shake things up a bit and create some trading opportunities!
Data points to consider: US non-farm payrolls employment report, Average hourly earnings and unemployment rate at 1.30pm. FOMC member Dudley speaks at 5.15pm GMT.
Levels to watch/live orders:
-
Buys: Flat (stop loss: N/A).
-
Sells: Flat (stop loss: N/A).
GBP/USD:
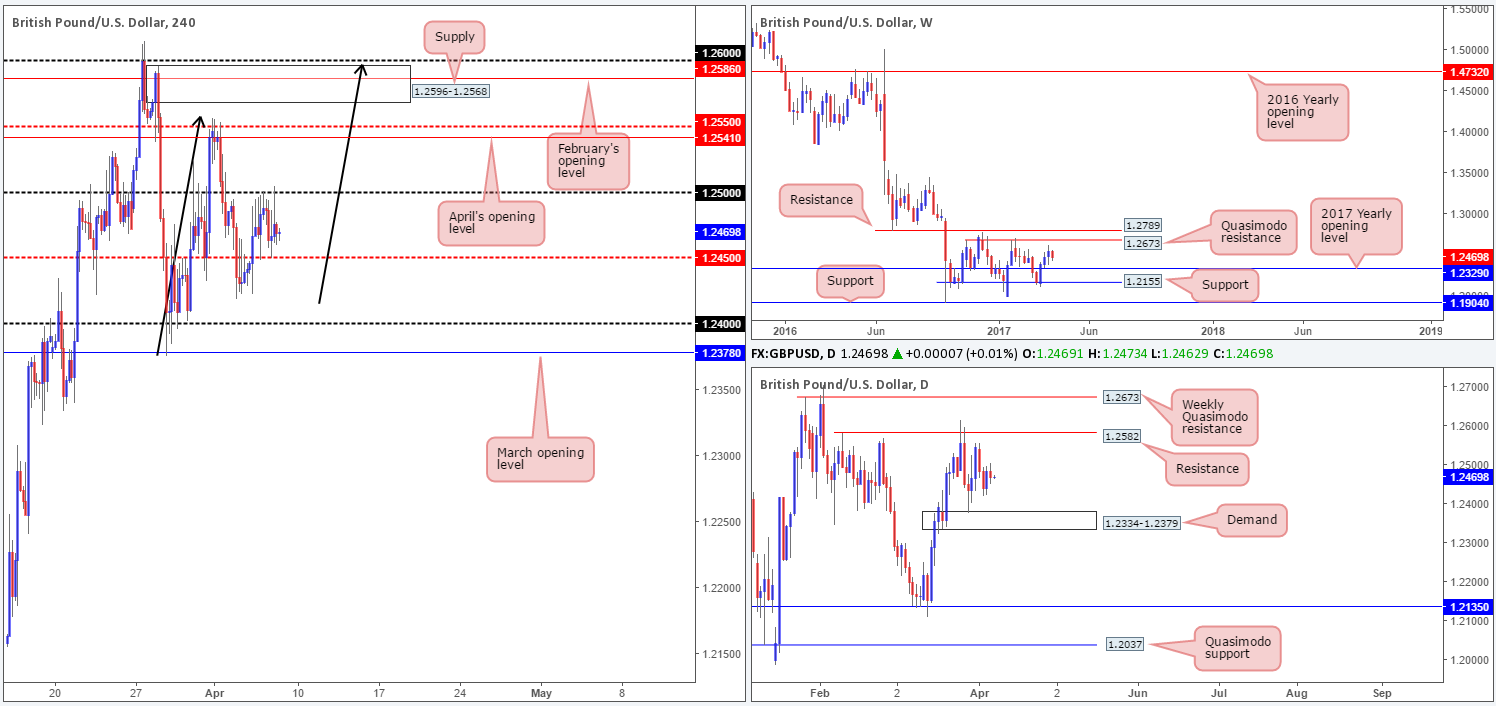
Of late, the GBP/USD has been seen ranging between the H4 mid-way support at 1.2450 and the psychological band 1.25. Of particular interest on the H4 chart, however, is the potential AB=CD bearish pattern that terminates around the upper edge of supply coming in at 1.2596-1.2568. Still, before this can come to fruition, April’s opening line at 1.2541 and the mid-level resistance at 1.2550 needs to be consumed.
Looking over to the bigger picture, weekly action is seen meandering between a Quasimodo resistance at 1.2673 and the 2017 yearly opening level at 1.2390. In addition to this, we can also see daily price loitering mid-range between resistance plotted at 1.2582 (lodged within the aforementioned H4 supply) and demand at 1.2334-1.2379.
Our suggestions: With the US non-farm payrolls employment report just around the corner, we are hesitant to take on any positions right now. Ideally, we’re looking for the NFP to push prices north to help complete the above noted H4 AB=CD structure.
Data points to consider: UK manufacturing at 9.30am, BoE Gov. Carney speaks at 10am. US non-farm payrolls employment report, Average hourly earnings and unemployment rate at 1.30pm. FOMC member Dudley speaks at 5.15pm GMT.
Levels to watch/live orders:
-
Buys: Flat (stop loss: N/A).
-
Sells: Flat (stop loss: N/A).
AUD/USD:
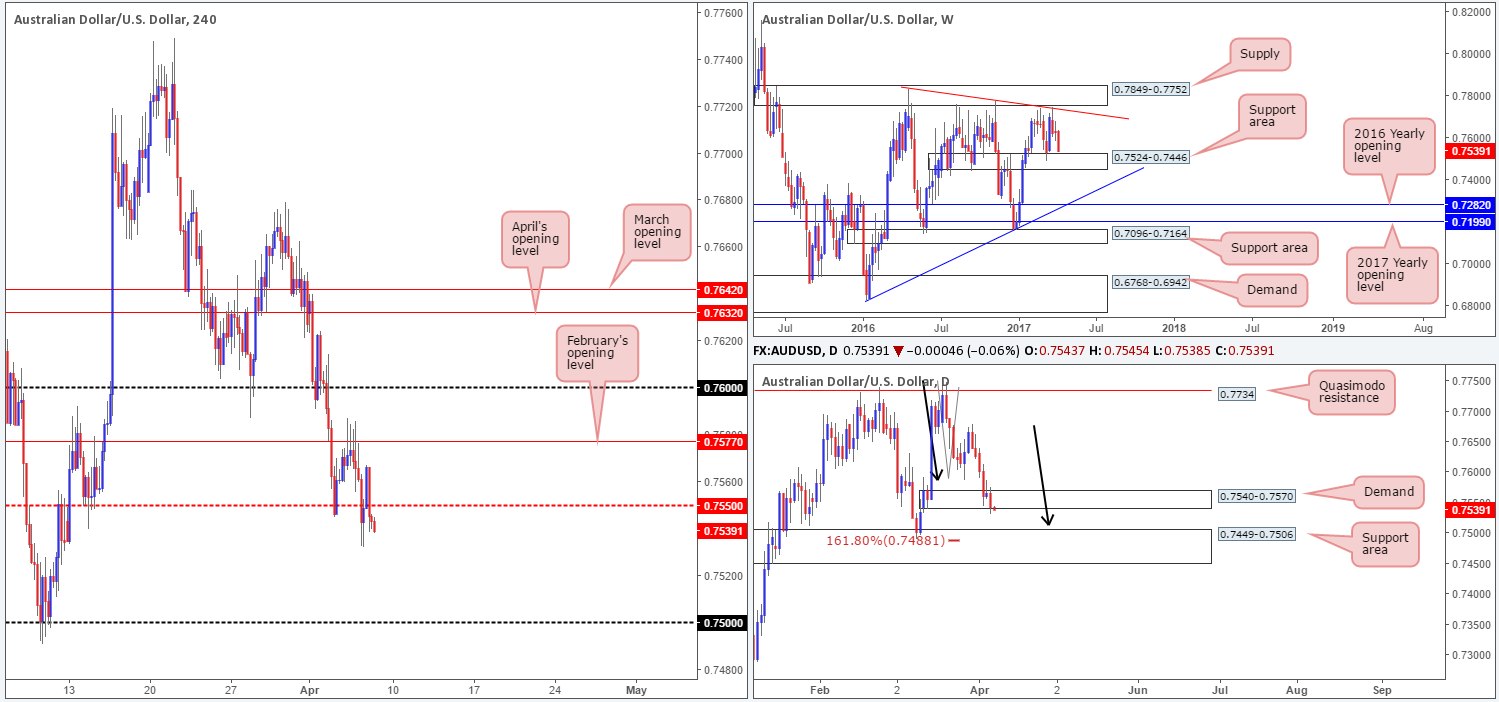
Kicking this morning’s report off with a look at the weekly timeframe, price is currently seen trading within striking distance of a support area fixed at 0.7524-0.7446. The pair is likely to find support here with it having been a considerable structure since mid-2016. Down on the daily timeframe, the bulls attempted to recover from demand at 0.7540-0.7570 on Wednesday, but, as you can see, failed to generate any type of follow through. The next zone of interest beyond here is 0.7449-0.7506: a support area that holds an AB=CD (see black arrows) 161.8% Fib ext. at 0.7488.
Across on the H4 timeframe, we can see that price has recently run through bids at 0.7550. According to the H4 structure, there’s very little stopping price from connecting with the 0.75 handle today. However, do note that the top edge of the weekly support area is seen at 0.7524, so the H4 candles may struggle to reach 0.75.
Our suggestions: With the daily candles still seen trading within demand at 0.7540-0.7570, and weekly price not far from connecting with a hefty piece of structure, we feel shorts beyond 0.7550 is a little too risky for our liking. As such, we will hold fire today and re-evaluate the situation post NFP.
Data points to consider: US non-farm payrolls employment report, Average hourly earnings and unemployment rate at 1.30pm. FOMC member Dudley speaks at 5.15pm GMT.
Levels to watch/live orders:
-
Buys: Flat (stop loss: N/A).
-
Sells: Flat (stop loss: N/A).
USD/JPY:
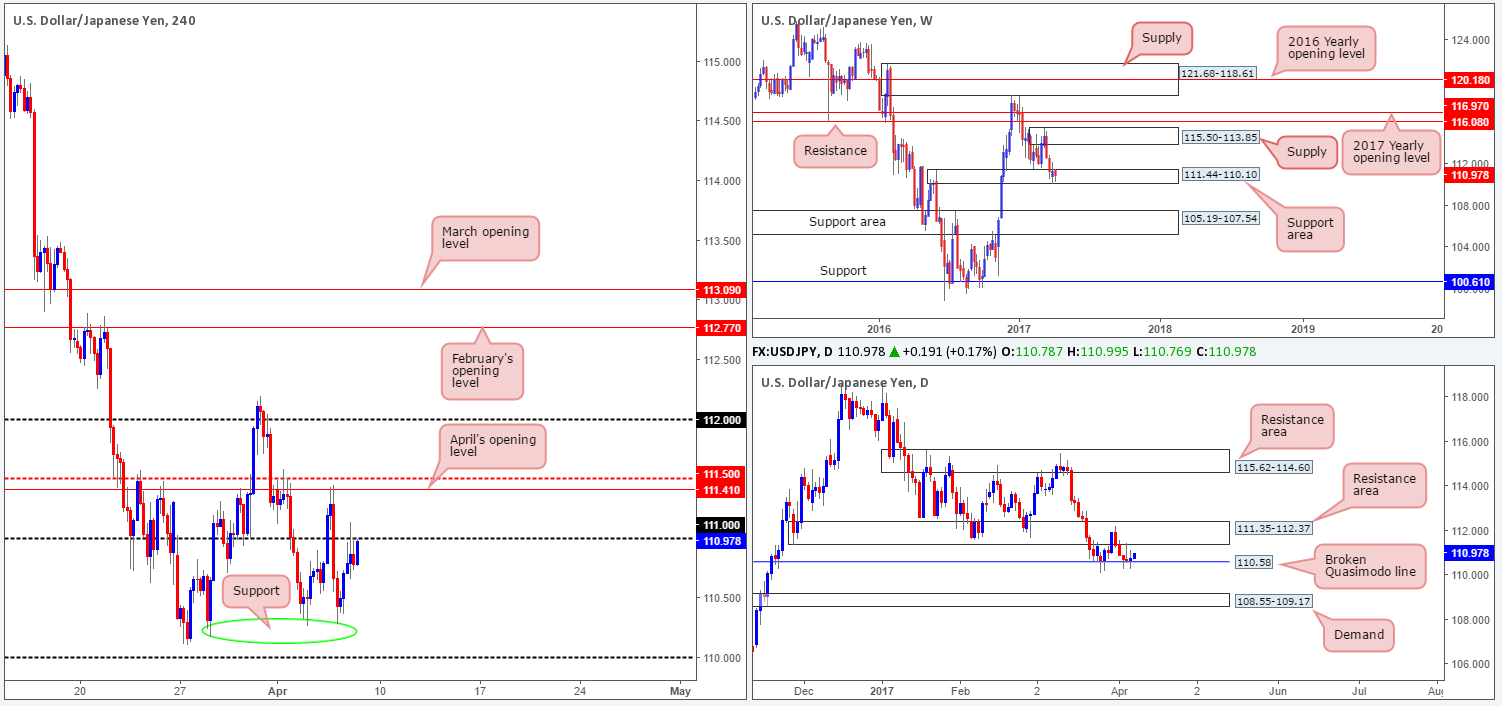
In view of weekly price holding firm within the walls of a support area at 111.44-110.10, entering into any long-term shorts may be risky. Daily price continues to range between a resistance area at 111.35-112.37 and a broken Quasimodo line at 110.58. Therefore, until the resistance area is taken out, we would also be wary of committing to any long-term buys at the moment.
Jumping across to the H4 chart, the candles are seen rejecting the 111 handle. A break beyond this number would likely place the underside of the daily resistance area at 111.35 in view, alongside April’s opening level at 111.41 and the mid-level resistance at 111.50.
Our suggestions: A short from the 111.50 region looks like a reasonable possibility, given its surrounding confluence. However, let’s bear in mind that by selling here, you would be going against weekly flow! As such, waiting for a lower-timeframe confirming signal to form beforehand (see the top of this report) may be the safer route to take.
Data points to consider: US non-farm payrolls employment report, Average hourly earnings and unemployment rate at 1.30pm. FOMC member Dudley speaks at 5.15pm GMT.
Levels to watch/live orders:
-
Buys: Flat (stop loss: N/A).
-
Sells: 111.50 region: ([waiting for a lower-timeframe confirming signal to form is advised] stop loss: dependent on where one confirms the area).
USD/CAD:
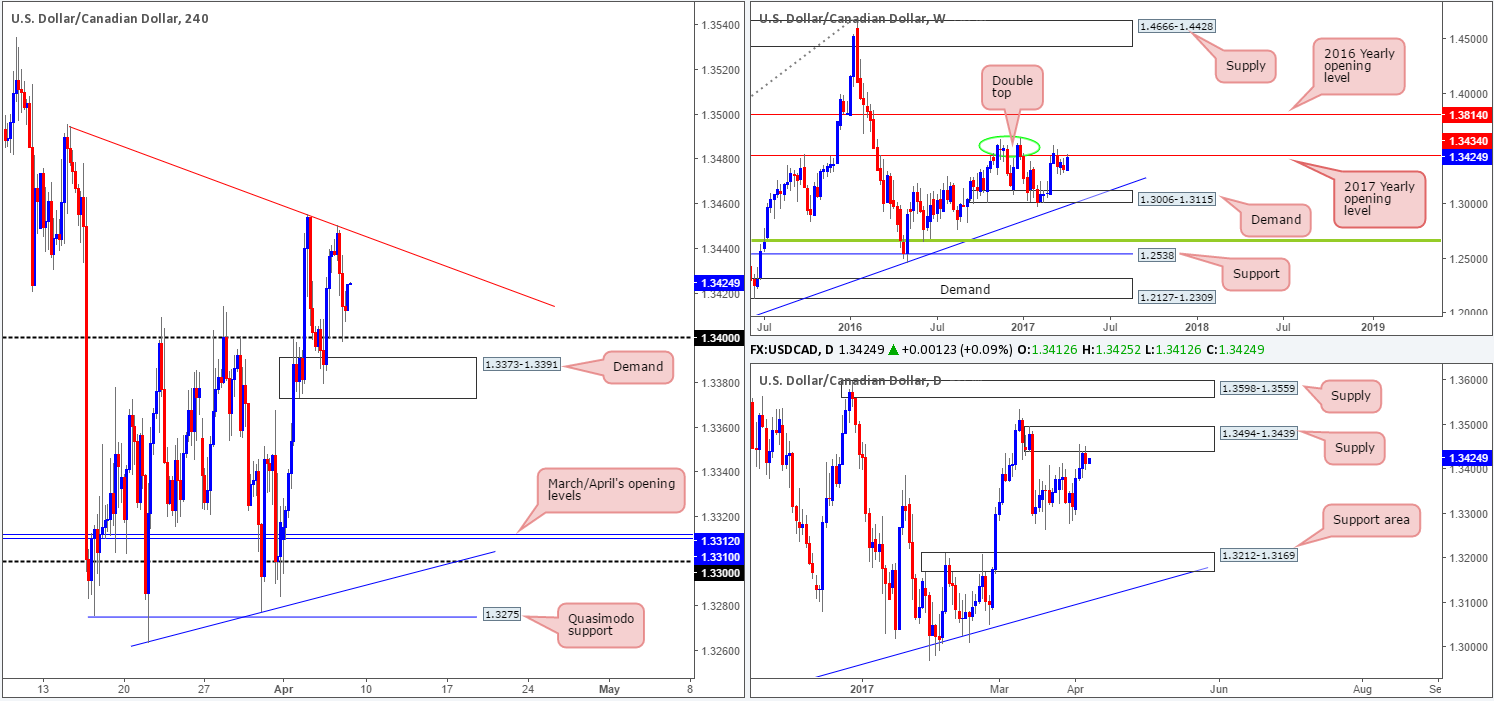
While the H4 candles are seen finding support off the 1.34 handle at the moment, one must take into account that not only is weekly action teasing the 2017 yearly opening level at 1.3434, but daily price is also seen testing the underside of a daily supply coming in at 1.3494-1.3439. To that end, we would not be keen to join in on any buying from 1.34 right now. With the above notes in mind, we have our eye on the H4 trendline resistance extended from the high 1.3495 for possible shorting opportunities.
Our suggestions: To avoid any fakeout seen at the aforementioned H4 trendline, however, a reasonably sized H4 bearish rotation candle is required before our team would consider shorting. The first take-profit target can be seen at 1.34, followed closely by a H4 demand drawn in at 1.3373-1.3391.
Data points to consider: US non-farm payrolls employment report, Average hourly earnings and unemployment rate at 1.30pm. FOMC member Dudley speaks at 5.15pm. Canadian employment data also scheduled for release at 1.30pm GMT.
Levels to watch/live orders:
-
Buys: Flat (stop loss: N/A).
-
Sells: H4 trendline resistance extended from the high 1.3495 ([waiting for a reasonably sized H4 bearish rotation candle to form before pulling the trigger is advised] stop loss: ideally beyond the trigger candle).
USD/CHF:
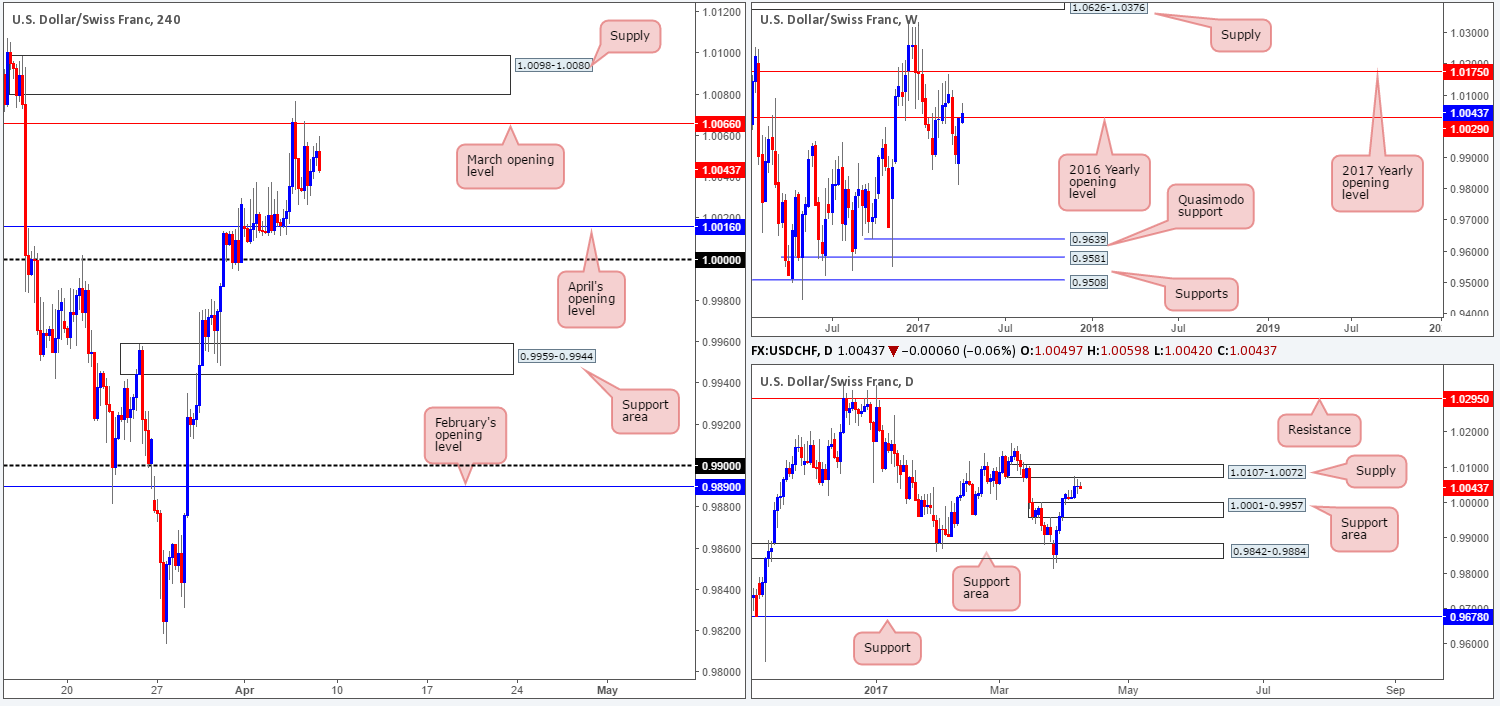
As can be seen from the H4 chart this morning, March’s opening level at 1.0066 capped upside during Wednesday/Thursday’s sessions. This level – coupled with the nearby H4 supply at 1.0098-1.0080, will be a difficult area to break, in our opinion. Even more so, considering that there’s a daily supply zone also seen currently in play at 1.0107-1.0072.
Our suggestions: An ideal scenario would be for H4 price to fake beyond March’s opening level and touch gloves with the aforementioned H4 supply. Should this occur and the H4 candles form a nice-looking selling wick, we would consider shorts. With that being said though, today’s economic data brings out the main event of the week: the US non-farm payrolls employment report, potentially creating unpredictable moves. As a result, our desk noted that unless H4 price fakes beyond 1.0066 into the H4 supply during the London morning segment, we will wait on the sidelines until post NFP.
Data points to consider: US non-farm payrolls employment report, Average hourly earnings and unemployment rate at 1.30pm. FOMC member Dudley speaks at 5.15pm GMT.
Levels to watch/live orders:
-
Buys: Flat (stop loss: N/A).
-
Sells: A fakeout beyond 1.0066 into H4 supply at 1.0098-1.0080 in the form of a H4 selling wick would be an interesting signal to sell (stop loss: ideally beyond the trigger candle).
DOW 30:
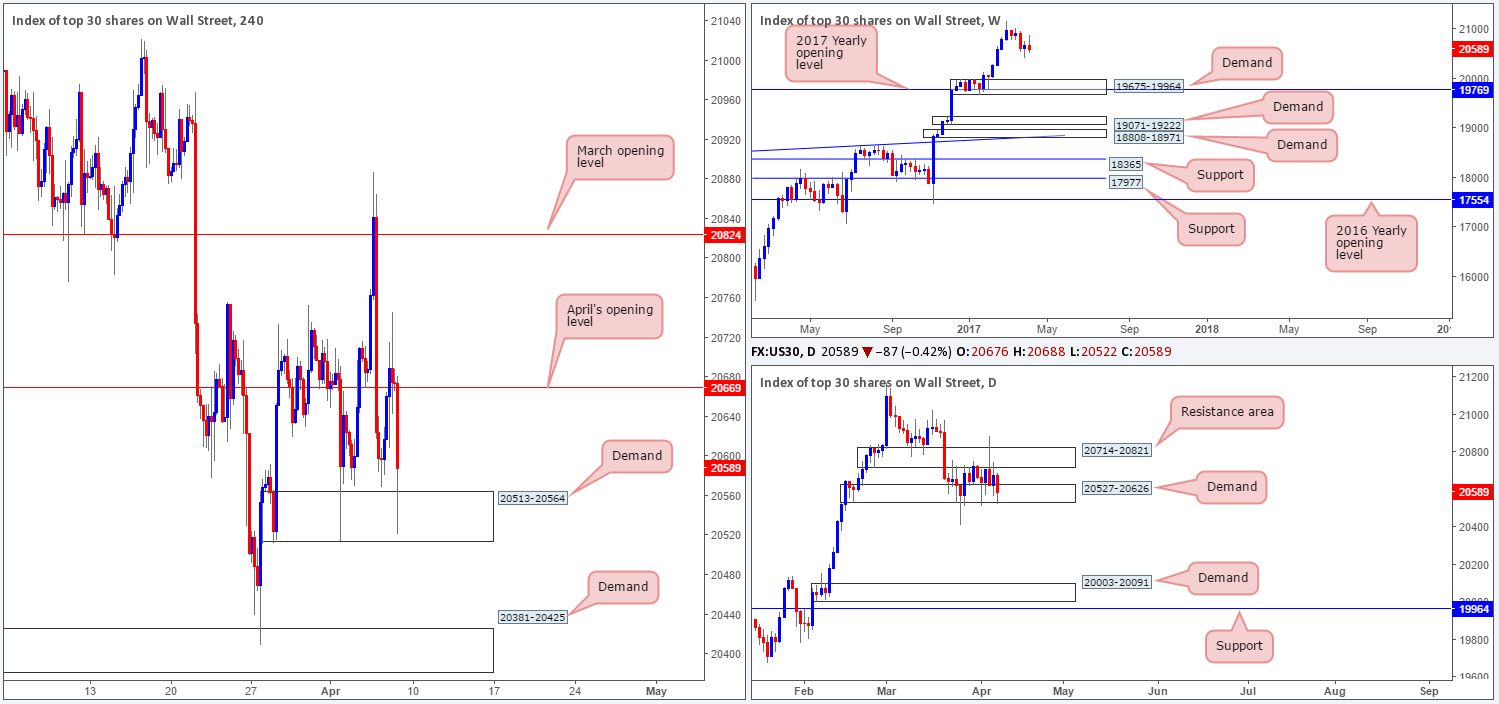
Since price topped at a record high of 21170 and pulled back to lows of 20409, the index entered into a phase of consolidation on the daily chart. The resistance area at 20714-20821 and demand coming in at 20527-20626 have, as you can see, both withstood multiple attacks.
While weekly price shows room to extend down to demand at 19675-19964, we would prefer to see the daily demand zone consumed before any shorts are considered. The next downside hurdle on the daily timeframe can be seen at a demand base drawn from 20003-20091 (positioned just above the weekly demand).
Our suggestions: Neither a long nor short seems attractive at this time. Yes, a long from the current H4 demand at 20513-20564 is interesting, given its connection to daily demand, but not when the weekly chart shows so much space visible to the downside! Personally, we’ll wait for the NFP to do its thing and reassess following the release.
Data points to consider: US non-farm payrolls employment report, Average hourly earnings and unemployment rate at 1.30pm. FOMC member Dudley speaks at 5.15pm GMT.
Levels to watch/live orders:
-
Buys: Flat (stop loss: N/A).
-
Sells: Flat (stop loss: N/A).
GOLD:
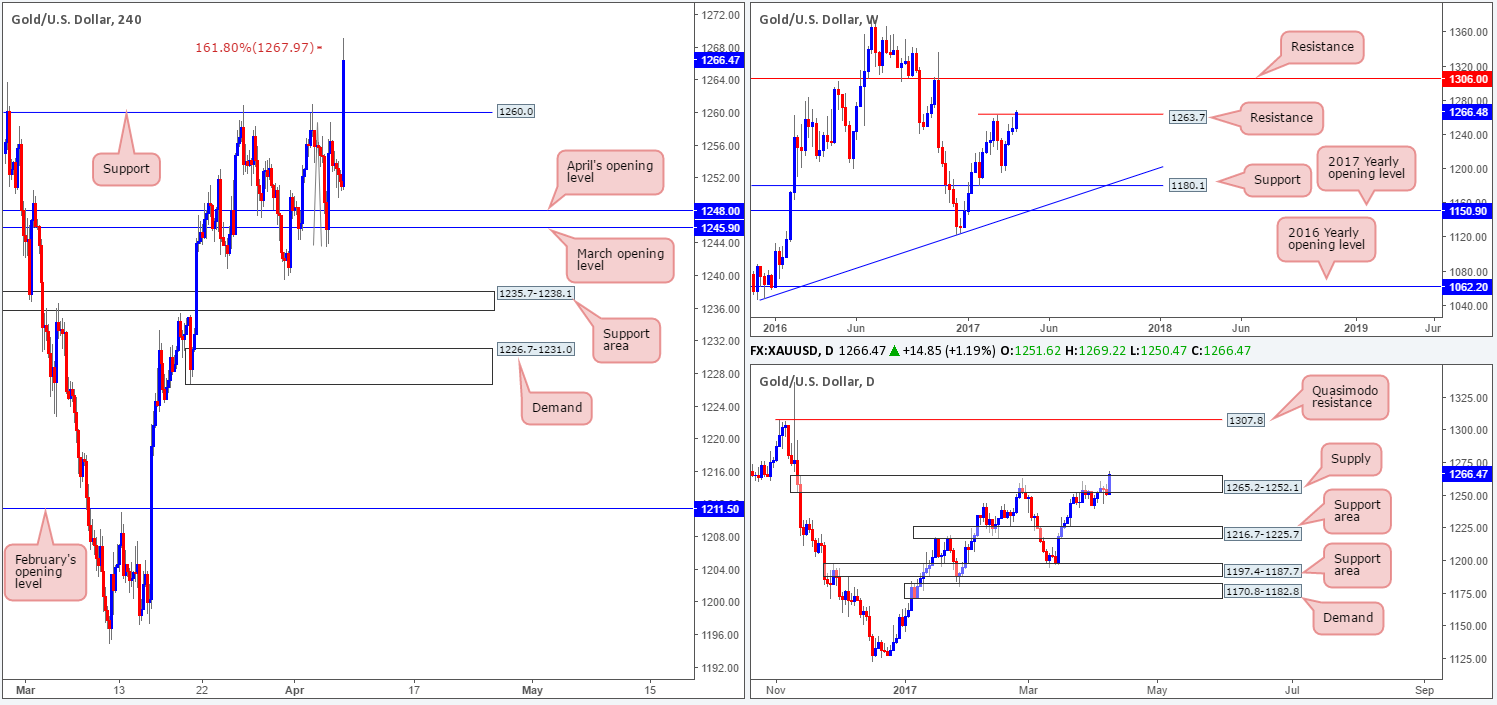
In recent hours the US dollar sold off, consequently pushing the price of gold higher. H4 price walloped its way through resistance at 1260.0 (now acting support), and has potentially paved the way for the unit to challenge resistance pegged at 1275.5. Before we all go hunting for longs in this market, however, it might be worth noting that weekly resistance at 1263.7 is currently in play, as is the upper edge of a daily supply at 1265.2.
Our suggestions: Although a long from 1260.0 is tempting, we feel that the higher-timeframe structure will be just too overwhelming here! The H4 161.8% Fib ext. at 1267.9 (taken from the low 1243.6) seems to be holding firm at the moment. Given this factor, and the higher-timeframe resistances in motion, a short from here is high probability. Still, seeing as how there is limited structure to place stops, we will wait for a lower-timeframe confirming sell signal to form here before committing (see the top of this report).
Levels to watch/live orders:
-
Buys: Flat (stop loss: N/A).
-
Sells: 1267.9 region ([waiting for a lower-timeframe confirming signal to form is advised before pulling the trigger [stop loss: dependent on where one confirms this area).


