A note on lower-timeframe confirming price action…
Waiting for lower timeframe confirmation is our main tool to confirm strength within higher timeframe zones, and has really been the key to our trading success. It takes a little time to understand the subtle nuances, however, as each trade is never the same, but once you master the rhythm so to speak, you will be saved from countless unnecessary losing trades. The following is a list of what we look for:
- A break/retest of supply or demand dependent on which way you’re trading.
- A trendline break/retest.
- Buying/selling tails/wicks – essentially we look for a cluster of very obvious spikes off of lower timeframe support and resistance levels within the higher timeframe zone.
- Candlestick patterns. We tend to stick with pin bars and engulfing bars as these have proven to be the most effective.
We typically search for lower-timeframe confirmation between the M15 and H1 timeframes, since most of our higher-timeframe areas begin with the H4. Stops are usually placed 3-5 pips beyond confirming structures.
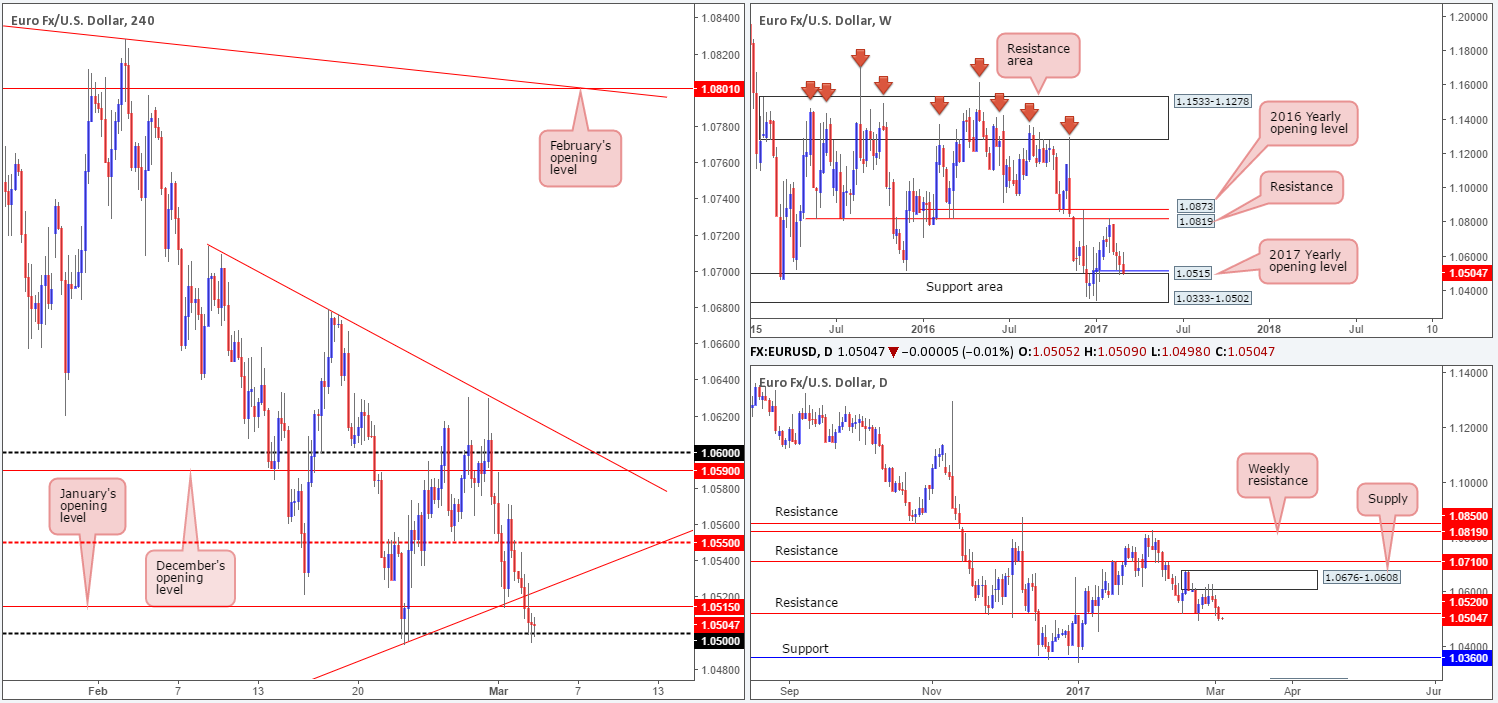
EUR/USD:
As can be seen from the H4 chart this morning, price failed to sustain gains beyond the H4 mid-way level 1.0550 and concluded the day pushing through both the H4 trendline support extended from the low 1.0340 and January’s opening level at 1.0515.
While the unit is currently seen feeding off of the 1.05 handle at the moment, upside looks incredibly limited from here given that daily action also broke below daily support at 1.0520 (now acting resistance). A H4 close beyond the 1.05 barrier could, according to the H4 structure, trigger another round of selling down to the 1.04 neighborhood.
Our suggestions: Despite both the daily and H4 charts indicating that the bears have a slight edge in this market at the moment, it may be worth noting that weekly price has just entered into a major weekly support area coming in at 1.0333-1.0502!
With the potential for weekly bulls to step in here, would a H4 close below 1.05 really be considered a bearish signal? Should the H4 candles retest the underside of 1.05 and print a reasonably sized H4 bear candle, then we believe the pair will take another dive lower. This is simply because the weekly support zone is nearly 200 pips in size! And since we would only be targeting 1.04, it could still come to fruition as long as the retest and confirming H4 bear candle is seen.
Data points to consider: US ISM-manufacturing PMI at 3pm, FOMC member Evans speaks at 3.15pm, FOMC member Powell speaks at 5.15pm, FOMC member Fischer along with Fed Chair Yellen speaks at 6pm GMT.
Levels to watch/live orders:
- Buys: Flat (stop loss: N/A).
- Sells: Watch for a H4 close below 1.05 and look to trade any retest seen thereafter ([we would also advise waiting for a reasonably sized H4 bear candle to form following the retest before looking to execute a trade] stop loss: ideally beyond the trigger candle).
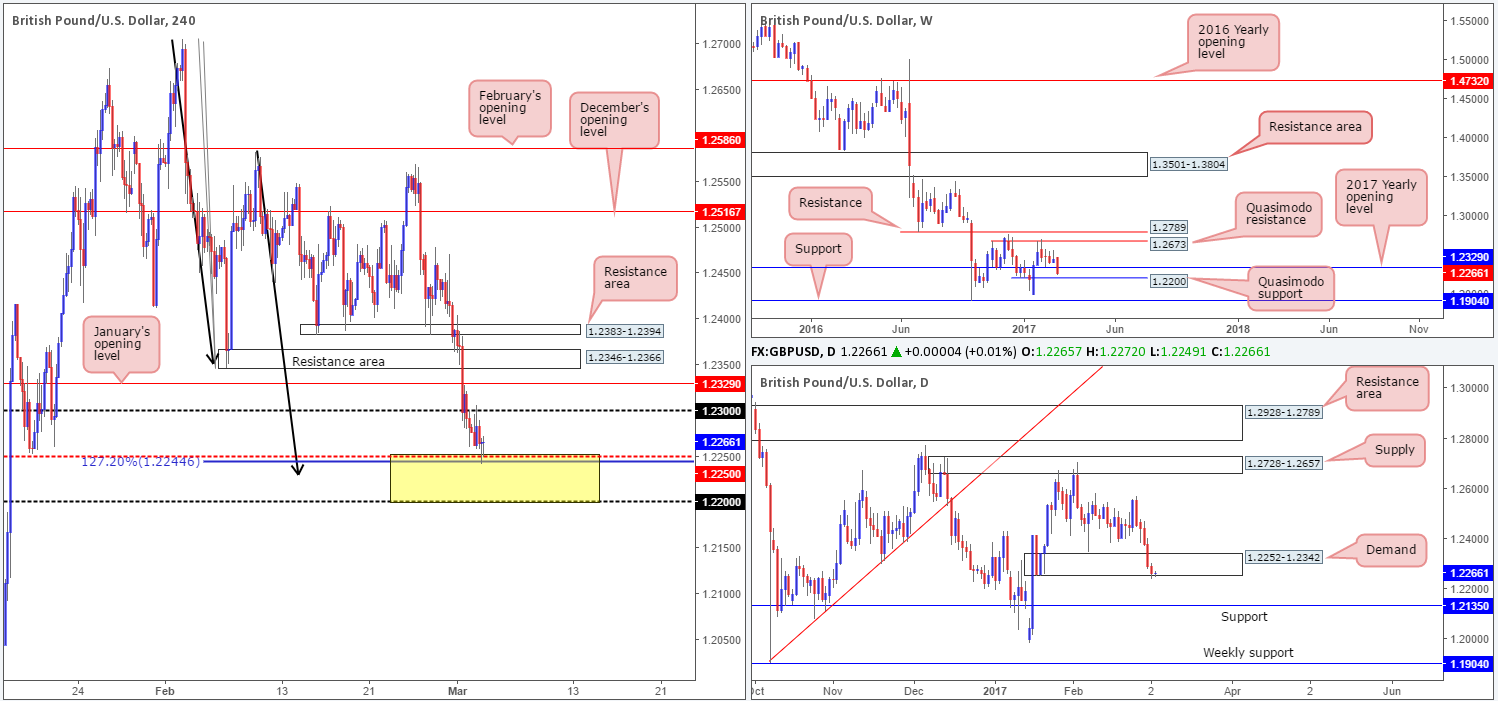
GBP/USD:
During the course of yesterday’s sessions the GBP/USD chalked up its fifth consecutive bearish candle, which, as you can see, forced the H4 candles into the H4 mid-way point 1.2250. For those who read Thursday’s report you may recall that our desk highlighted the 1.22/1.2250 area as a potential buy zone in this market. 1.2250 fuses with a H4 AB=CD (see black arrows) 127.2% Fib ext. at 1.2244 taken from the high 1.2706, and is currently holding firm as we write. However, we were ideally looking for a slight break into our H4 buy zone before buying, since we did not want to execute a long position too far from 1.22 handle as this number represents a weekly Quasimodo support. And because of this we may have missed the boat!
For any of our readers who managed to pin down a position from here, well done! We would be looking for price to tag the 1.23 level before taking some profits and reducing risk to breakeven.
Our suggestions: Should the bears step in and push price deeper into the above noted yellow H4 zone today, however, we would still look to buy if price pencils in a reasonably sized H4 bull candle, with stops placed below the trigger candle.
Data points to consider: UK services PMI at 9.30am. US ISM-manufacturing PMI at 3pm, FOMC member Evans speaks at 3.15pm, FOMC member Powell speaks at 5.15pm, FOMC member Fischer along with Fed Chair Yellen speaks at 6pm GMT.
Levels to watch/live orders:
- Buys: 1.22/1.2250 ([wait for a reasonably sized H4 bull candle to form within the zone before looking to pull trigger here] stop loss: ideally beyond the trigger candle).
- Sells: Flat (stop loss: N/A).
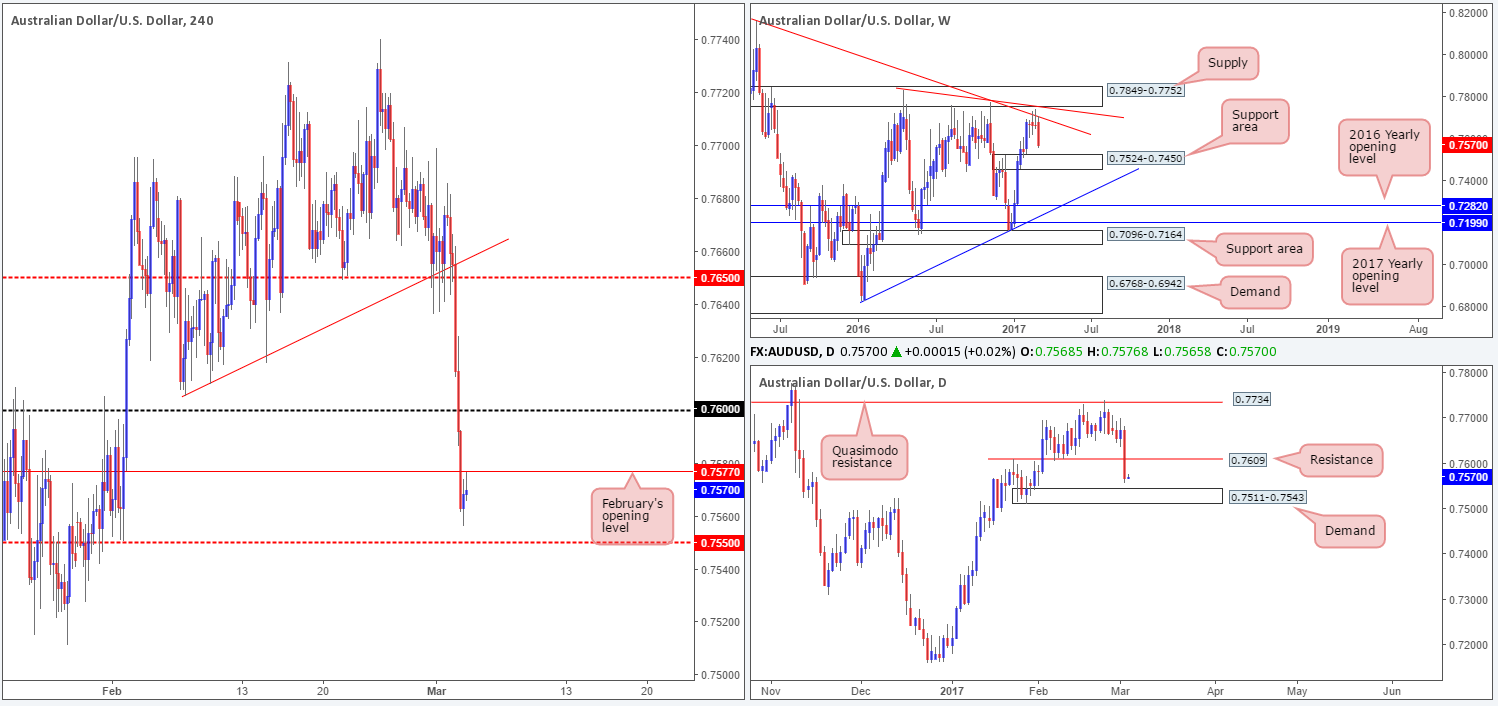
AUD/USD:
Across the board, we saw the US dollar gravitate north yesterday and pull the gold market lower. This, as you can see, pushed the Aussie dollar aggressively south going into the London segment. Technically speaking, this move was also bolstered by the fact that the weekly candles are selling off from a weekly trendline resistance stretched from the high 0.8163. Daily support at 0.7609 (now acting resistance) was also taken out during the bearish assault and is now on course to connect with a daily demand zone coming in at 0.7511-0.7543.
Given that the H4 candles are currently seen retesting the underside of February’s opening base at 0.7577, is there scope for a trade short from here? Well, the next downside target on the weekly scale falls in at 0.7524-0.7450: a weekly support area. On the daily chart, a daily demand mentioned above at 0.7511-0.7543 is the next hurdle in the firing range. All of this coupled with the nearby 0.7550 H4 mid-way level gives us a collective target support zone of 0.7524/0.7550.
Our suggestions: So, to answer the question regarding whether there’s scope for a sell trade from 0.7577, we would say probably not, due to the limited downside space seen to the 0.7524/0.7550 neighborhood. Therefore, at least for the time being, our desk remains on the sidelines.
Data points to consider: US ISM-manufacturing PMI at 3pm, FOMC member Evans speaks at 3.15pm, FOMC member Powell speaks at 5.15pm, FOMC member Fischer along with Fed Chair Yellen speaks at 6pm GMT.
Levels to watch/live orders:
- Buys: Flat (stop loss: N/A).
- Sells: Flat (stop loss: N/A).
USD/JPY:
In recent sessions, the USD/JPY printed its fourth consecutive daily bullish candle and drove the unit up to within an inch of the daily resistance area coming in at 115.62-114.60. Also of note is the H4 candles recently connecting with the H4 mid-way resistance point at 114.50 (the black arrow represents a H4 Quasimodo left shoulder that converges with the 114.50 number), which is shadowed closely by December’s opening level at 114.68.
Ultimately, we do believe there is enough supporting structure around 114.50 to see price challenge the 114 handle today. However, it does seem we may have missed the boat here!
Our suggestions: On account of the above notes, we will be looking for shorting opportunities on the lower timeframes at current price (see the top of this report), targeting 114 and possibly the H4 demand at 113.47-113.70.
Data points to consider: US ISM-manufacturing PMI at 3pm, FOMC member Evans speaks at 3.15pm, FOMC member Powell speaks at 5.15pm, FOMC member Fischer along with Fed Chair Yellen speaks at 6pm GMT.

Levels to watch/live orders:
- Buys: Flat (stop loss: N/A).
- Sells: 114.50 region ([wait for a lower-timeframe signal to form before looking to pull the trigger] stop loss: dependent on where one confirms the zone).
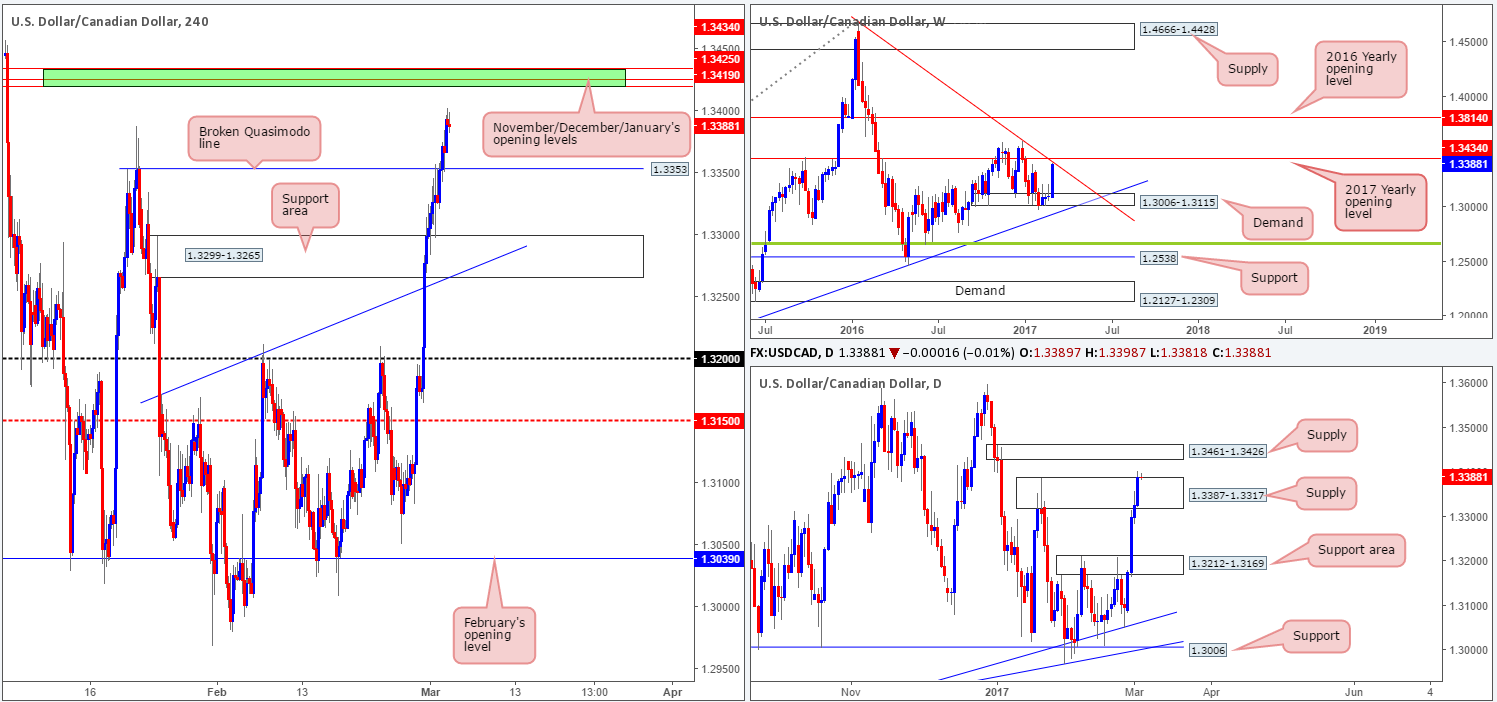
USD/CAD:
Kicking this morning’s report off with a look at the weekly chart, we can see that weekly price is seen trading within reaching distance of the weekly trendline resistance taken from the high 1.4689, followed closely by the 2017 yearly opening level at 1.3434. Looking down to the daily candles, recent action spiked above daily supply coming in at 1.3387-1.3317 and has potentially cleared the runway north up to daily supply at 1.3461-1.3426.
What’s interesting here is that the 2017 yearly opening level is, as can be seen on the H4 chart, positioned nearby November and December’s opening levels at 1.3419/1.3425 (green zone). In addition to this, the 2017 yearly opening level is situated within the lower limits of the daily supply mentioned above at 1.3461-1.3426.
Our suggestions: Quite simply, keep an eye on the green H4 zone 1.3434/1.3419 for shorting opportunities today. Given the size of the area, however, it may be better to wait for additional confirmation in the form of a H4 bear candle. This will also help avoid any fakeout that may take place!\
Data points to consider: US ISM-manufacturing PMI at 3pm, FOMC member Evans speaks at 3.15pm, FOMC member Powell speaks at 5.15pm, FOMC member Fischer along with Fed Chair Yellen speaks at 6pm GMT.
Levels to watch/live orders:
- Buys: Flat (stop loss: N/A).
- Sells: 1.3434/1.3419 ([wait for a H4 bear candle to form before looking to pull trigger here] stop loss: ideally beyond the trigger candle).
USD/CHF:
Although the USD/CHF pair advanced north yesterday, the overall structure of this market remains unchanged. As such, our desk continues to focus on the H4 sell zone seen at 1.02/1.0170 (yellow zone). The area comprises of the following converging structures: both December and January’s opening levels at 1.0170/1.0175, a potential H4 AB=CD 127.2% Fib ext. at 1.0185, another potential minor H4 AB=CD symmetrical formation completing also around the 1.0185 region (see black arrows), an upper H4 channel resistance line pegged from the high 1.0044, a H4 Quasimodo resistance at 1.0197, a 1.02 psychological handle and let’s not forget that all of this is seen housed within the daily supply zone coming in at 1.0248-1.0168.
Our suggestions: In light of this confluence, our team will, dependent on the time of day, look to sell from the H4 127.2% Fib ext. level, with stops placed a few pips above 1.02.
Data points to consider: US ISM-manufacturing PMI at 3pm, FOMC member Evans speaks at 3.15pm, FOMC member Powell speaks at 5.15pm, FOMC member Fischer along with Fed Chair Yellen speaks at 6pm GMT.
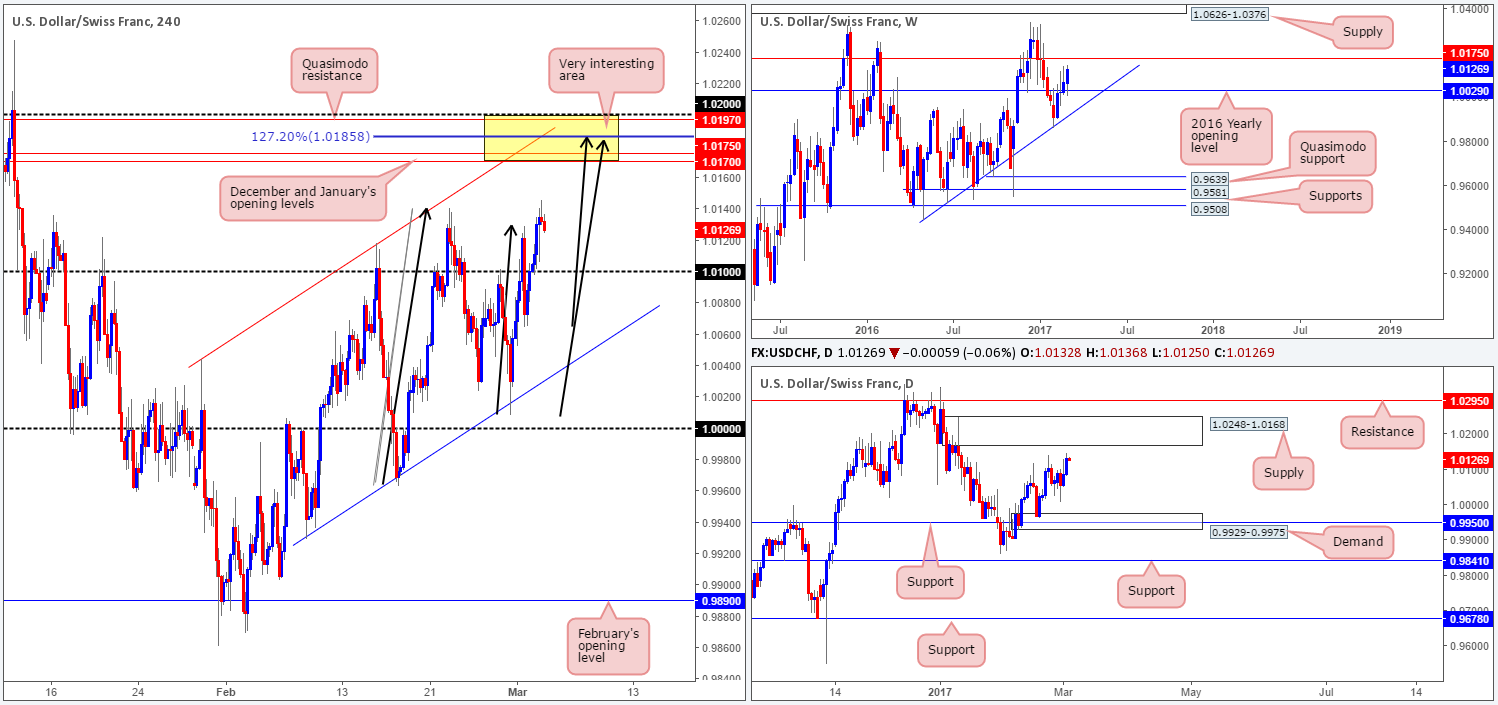
Levels to watch/live orders:
- Buys: Flat (stop loss: N/A).
- Sells: 1.0185 region ([an area one could possibly trade at market] stop loss: 1.0205).
DOW 30:
US stocks fell from record highs yesterday, as the dollar’s recent advance and declines seen in the gold market bolsters the likelihood of further interest rate hikes in the near future. The descent, as you can see, forced the H4 candles back below the 21000 neighborhood, and has potentially opened up the gates for price to challenge the H4 demand coming in at 20837-20869. This H4 demand sits a few points above the daily demand seen at 20714-20821, so for traders looking to go long from here, you may want to note the possibility of a slight fakeout being seen through the current H4 demand.
Our suggestions: Right now, we have absolutely no intention of looking to sell this market beyond 21000. We would rather look to buy from the above noted H4 demand, or even the H4 demand seen below it at 20769-20801, which happens to be positioned within the walls of the aforementioned daily demand zone!
Data points to consider: US ISM-manufacturing PMI at 3pm, FOMC member Evans speaks at 3.15pm, FOMC member Powell speaks at 5.15pm, FOMC member Fischer along with Fed Chair Yellen speaks at 6pm GMT.
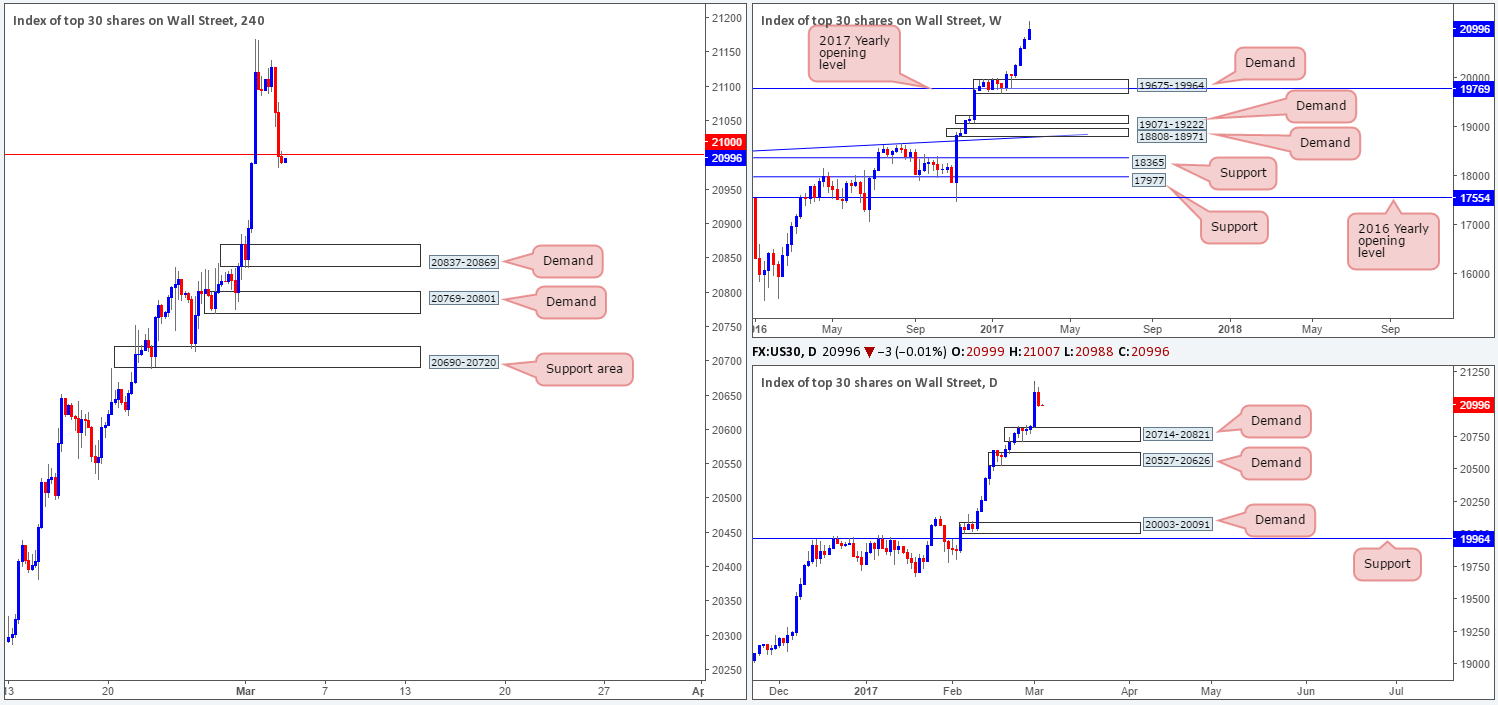
Levels to watch/live orders:
- Buys: 20837-20869 ([wait for a reasonably sized H4 bull candle to form before looking to pull trigger here] stop loss: ideally beyond the trigger candle). 20769-20801 ([wait for a H4 bull candle to form before looking to pull trigger here] stop loss: ideally beyond the trigger candle).
- Sells: Flat (stop loss: N/A).
GOLD:
In recent trading, weekly action has pushed itself back below the weekly support at 1241.2 and looks on course to form a nice-looking bearish engulfing candle! Before this can be achieved, nevertheless, the daily support area drawn from 1232.9-1224.5 will need to be taken out.
Turning our attention to the H4 candles, we can see that price is on the verge of connecting with a H4 demand base drawn from 1225.7-1229.7. Apart from this area being positioned within the above noted daily support area, it may be worth noting that it also converges with a H4 AB=CD completion point (see black arrows) as well!
Our suggestions: While there is a possibility that price could engulf the current H4 demand base today, given what we’ve noted on the weekly chart, we still feel a bounce is likely to be seen from this zone in view of its confluence. As a result, should price strike this zone today, we will switch down to the lower timeframes and watch how the action behaves. Assuming that we are able to pin down a lower-timeframe buy signal here (see the top of this report), we will look to enter long, targeting the H4 resistance area at 1235.7-1238.1 as an initial take-profit target.
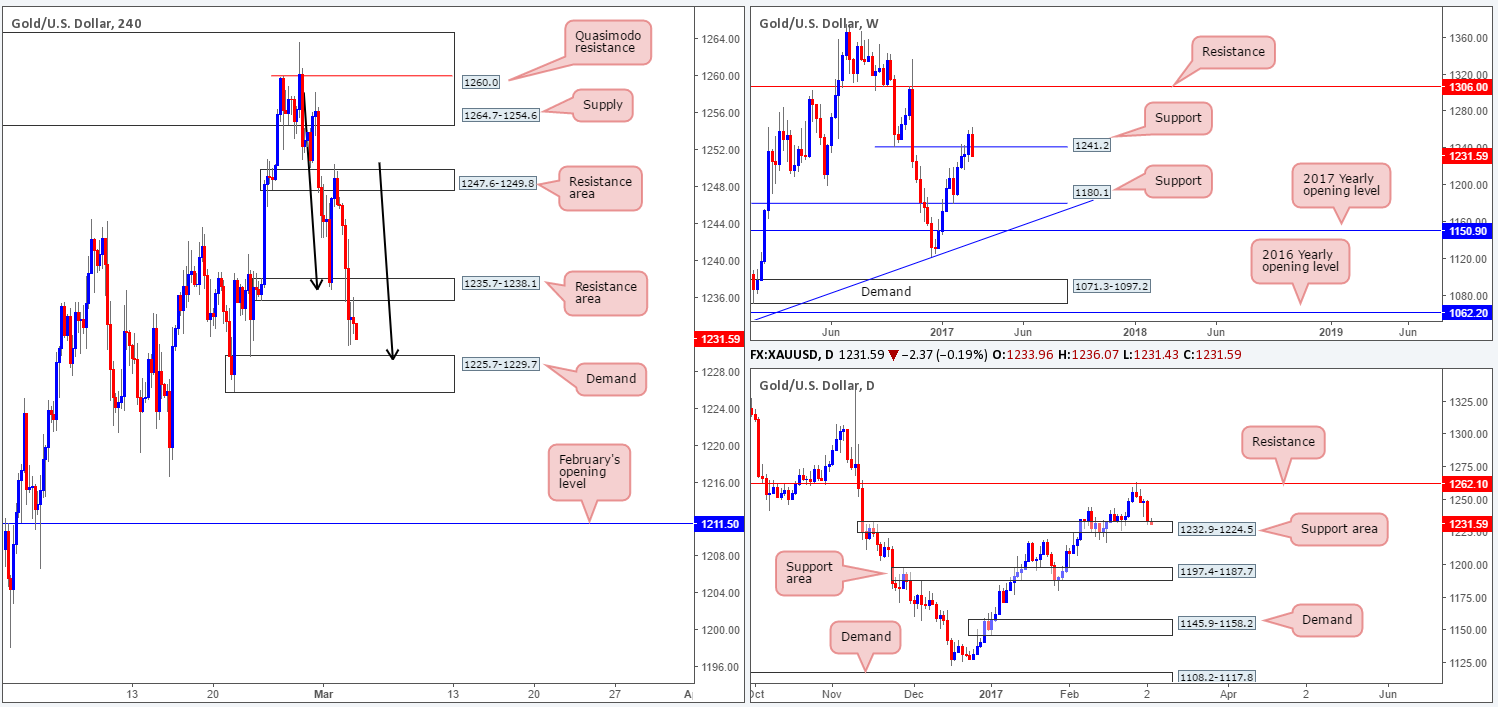
Levels to watch/live orders:
- Buys: 1225.7-1229.7 ([wait for a lower-timeframe signal to form before looking to pull the trigger] stop loss: dependent on where one confirms the zone).
- Sells: Flat (stop loss: N/A).