A note on lower timeframe confirming price action…
Waiting for lower timeframe confirmation is our main tool to confirm strength within higher timeframe zones, and has really been the key to our trading success. It takes a little time to understand the subtle nuances, however, as each trade is never the same, but once you master the rhythm so to speak, you will be saved from countless unnecessary losing trades. The following is a list of what we look for:
- A break/retest of supply or demand dependent on which way you’re trading.
- A trendline break/retest.
- Buying/selling tails/wicks – essentially we look for a cluster of very obvious spikes off of lower timeframe support and resistance levels within the higher timeframe zone.
- Candlestick patterns. We tend to only stick with pin bars and engulfing bars as these have proven to be the most effective.
We search for lower timeframe confirmation between the M15 and H1 timeframes, since most of our higher-timeframe areas begin with the H4. Stops are usually placed 5-10 pips beyond confirming structures.
EUR/USD:
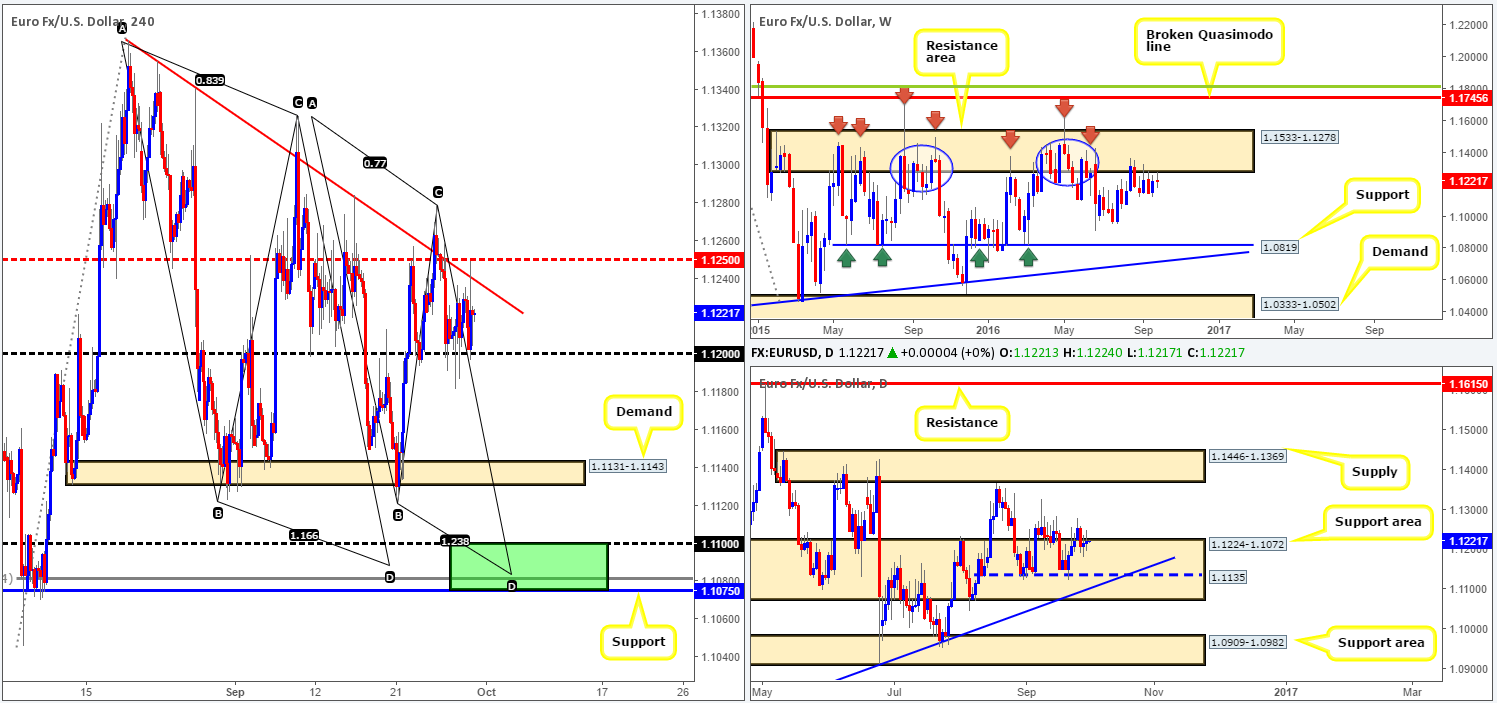
Kicking things off with a quick look at the weekly chart this morning, weekly investors appear neutral as price remains hugging the underside of a major resistance area seen at 1.1533-1.1278. Looking down to the daily chart, we can see that two back-to-back indecision candles recently took shape within a large support area penciled in at 1.1224-1.1072. Under these circumstances, there seems to be somewhat of a tug-of-war scenario going on between the two higher-timeframe structures at the moment.
Stepping over to the H4 chart, the single currency continued to take on a more laid back approach yesterday. Although US GDP and US Jobless Claims data came in hotter than expected, the pair barely moved 20 pips! As things stand, H4 action is now considered range bound between the mid-way resistance 1.1250 (merges with a trendline resistance extended from the high 1.1366) and the 1.12 handle.
Our suggestions: Given the lackluster effort seen from the daily buyers within the support area at 1.1224-1.1072 recently, and price seen kissing the underside of the aforementioned weekly resistance area at the moment, we still feel that 1.12 is on shaky ground. With that being said, a close below 1.12, followed up with a retest to the underside of this vicinity, along with a H4 bearish close would, in our book, be sufficient enough to condone a short in this market (despite prices lurking within a daily support area). Targets for this setup can be seen at 1.1131-1.1143: a H4 demand, followed by the H4 support at 1.1075 and the 1.11 band (green zone). Not only is 1.1075/1.11 a good take-profit area for any shorts in this market, it’s also a fantastic barrier to look for longs. It sits within the depths of the aforementioned daily support area, as well as converging with a daily trendline support taken from the low 1.0516, a deep H4 88.6% Fib support at 1.1081 and also two H4 AB=CD bull pattern completion points (taken from the highs 1.1366/1.1327). While this H4 buy zone will very likely bounce price, do keep in mind that by entering long from here you’re effectively buying into weekly flow. As a result, waiting for at least a H4 bullish close to form prior to pulling the trigger may be the better path to take.
Levels to watch/live orders:
- Buys: 1.1075/1.11 [H4 bullish close required] (Stop loss: beyond the trigger candle).
- Sells: Watch for a close below the 1.12 handle and look to trade any retest seen thereafter (H4 bearish close required).
GBP/USD:
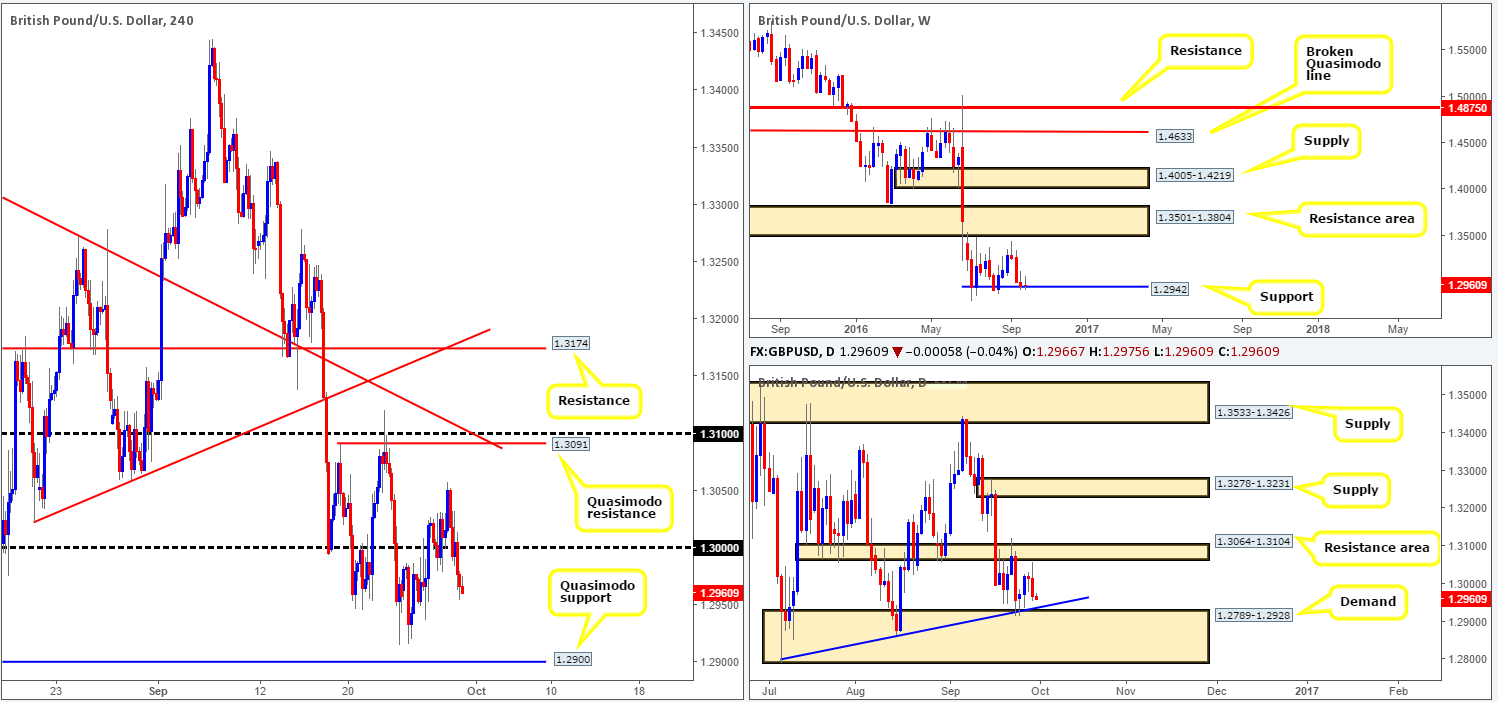
Going into the early hours of yesterday’s session, the pound put in a top around the H4 mid-way resistance 1.3050, which, as you can see, set the high for the day. The pair spent the remaining sessions selling off, consuming the key figure 1.30 along the way, and reaching lows of 1.2954 by the close. From a technical standpoint, this selloff was likely a combination of the H4 mid-way resistance 1.3050, price trading within shouting distance of a daily resistance area at 1.3064-1.3104 and the predominant trend pointing in a more southerly direction at present. Granted, weekly price is trading around a support level at 1.2942, but given that its previous reaction failed to achieve fresh highs, we’re wary of this barrier.
Despite the somewhat bearish tone put forward in the above paragraph, daily price still has a large demand at its disposal around the 1.2789-1.2928 region (blends with a trendline support taken from the low 1.2789) . On top of this, there’s also the H4 Quasimodo support at 1.2900 to take into account as well!
Our suggestions: While we believe that this pair will eventually clock fresh lows, a bounce from the above noted H4 Quasimodo support is likely to be seen. Building a case for entry here, we not only have the aforementioned daily demand supporting this level, but 1.2900 also represents a psychological boundary which a lot of traders will likely have their eye on. Just to be clear here though guys, we’re not expecting price to ‘reverse’ from this H4 level, just bounce! In addition to this, we would also advise waiting for lower timeframe price action to confirm buying interest resides here before taking the plunge (see the top of this report for information on lower timeframe entry techniques).
Data points to consider today is the UK’s current account scheduled for release at 8.30am, along with a final GDP reading also set to take the spotlight at 8.30am (GMT).
Levels to watch/live orders:
- Buys: 1.2900 region [tentative – lower timeframe confirmation required] (Stop loss: dependent on where one confirms the area).
- Sells: Flat (Stop loss: N/A).
AUD/USD:
For those who read our previous report on the Aussie pair you may recall that our team mentioned that they were still interested in shorting the H4 Quasimodo resistance level at 0.7698, if a reasonably sized H4 bearish candle close took shape. As demonstrated on the H4 chart, this is exactly what happened: a perfect H4 bearish engulfing candle formed going into the early hours of yesterday’s session. Our team entered on the close of this candle at 0.7685 and placed the stop above the candle head at 0.7712. We’ve already taken 70% off the table around the 0.7644ish range and have moved the stop to breakeven plus 3. The plan is to hold the remaining position into the weekend, since we believe a bearish close seen below the weekly resistance level at 0.7604 could spark further selling next week. Well done to any of our readers who managed to jump aboard this one too!
Apart from the above setup currently in play, we do not really see a way to pyramid this setup other than waiting for a close beyond the 0.76 handle and attempting to sell the retest. Although selling the underside of 0.76 is valid according to the higher-timeframe charts, the H4 support area at 0.7568-0.7549, however, is nearby and looks to be troublesome. It was here that price bounced from to break through the weekly resistance level! Therefore, this area commands respect. With that in mind, for us to short this market again, a close beyond this H4 support barrier would need to be seen.

Levels to watch/live orders:
- Buys: Flat (Stop loss: N/A).
- Sells: 0.7685 [live] (Stop loss: breakeven).
USD/JPY:
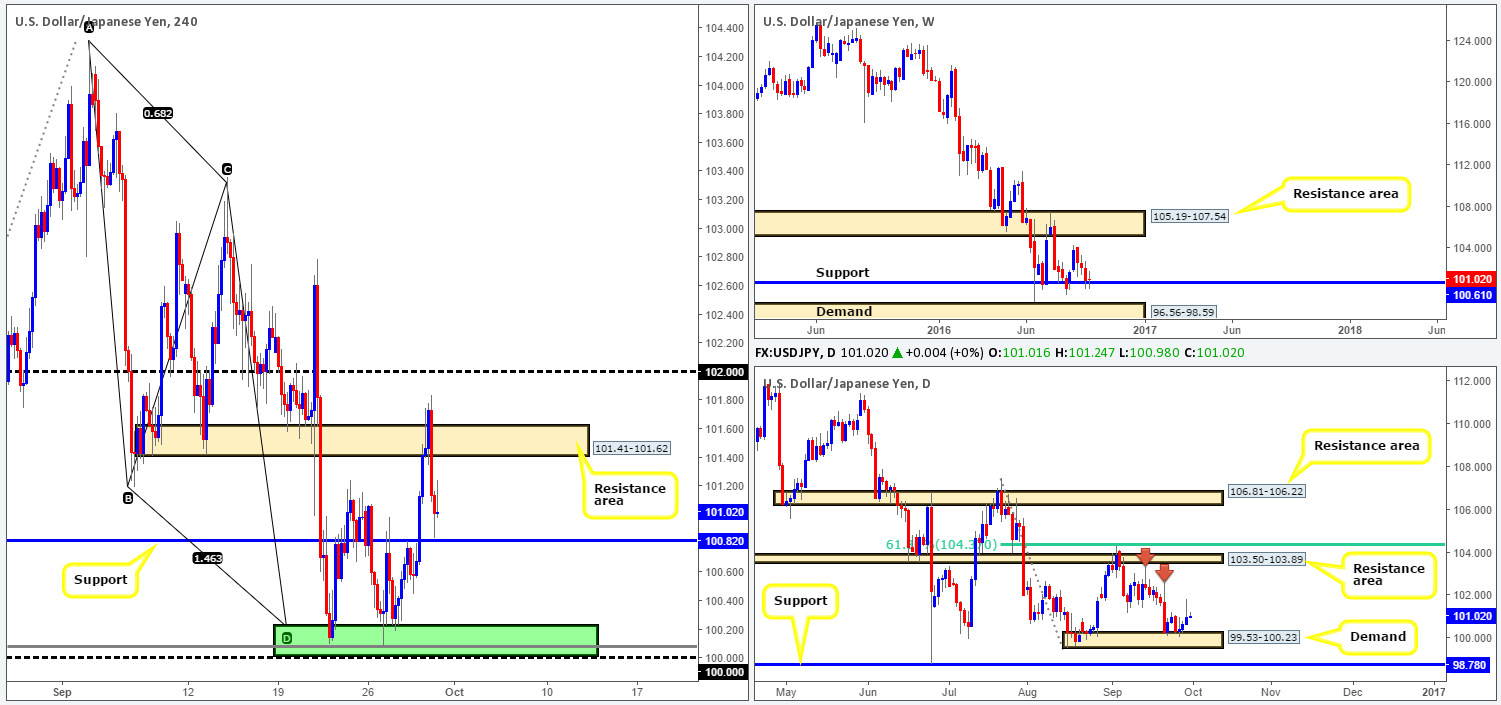
From the H4 chart, recent action shows that the USD/JPY extended its bounce from the 100.00/100.21 region (green zone) for a third consecutive day. Be that as it may, yesterday’s advance hit a ceiling around the resistance area coming in at 101.41-101.62, consequently bringing price down to the 100.82 neighborhood: a resistance-turned support level.
Apart from the prominent downtrend this market is currently entrenched within, support on the weekly chart at 100.61 seem to holding its own at the moment, even if weekly traders do seem to be undecided right now. Technicals on the daily chart show the daily demand barrier drawn from 99.53-100.23 also holding ground. However, whether yesterday’s daily selling wick will entice sellers into the market today is difficult to judge!
Our suggestions: Looking for longs off the current H4 support boundary is something we may consider today, if, and only if, we see a reasonably sized H4 bull candle chalked in. Targets from here can be seen at the above said H4 resistance area, followed by the 102 handle.
Levels to watch/live orders:
- Buys: 100.82 region [H4 bullish close required] (Stop loss: beyond the trigger candle).
- Sells: Flat (Stop loss: N/A).
USD/CAD:
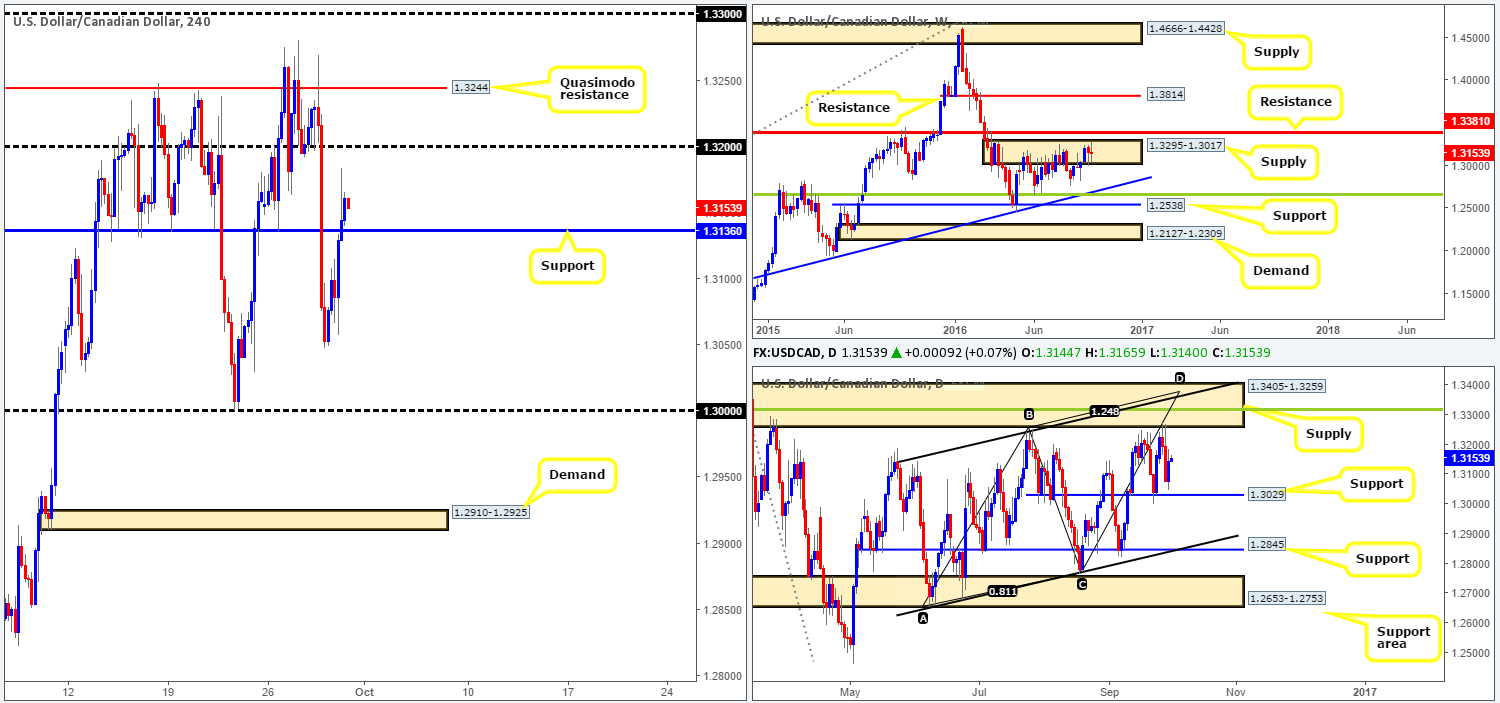
During the course of yesterday’s sessions, we saw the USD/CAD recover some of its recent losses following OPEC’s agreement to limit oil production. Recently, however, the pair edged above H4 resistance at 1.3136 (now acting support) and now looks set to extended further north to the 1.32 mark, and quite possibly the H4 Quasimodo resistance at 1.3244.
With daily price turning just ahead of a support level at 1.3029 and weekly action currently battling for position within supply registered at 1.3295-1.3017, where does one go from here? Technically speaking, traders are in a rather precarious position. Should one buy this market, you face potential opposition from weekly sellers within the above said supply zone. If, on the other hand, one looks to sell, you’d be selling into a H4 resistance-turned support coming in at 1.3136. This – coupled with CAD GDP data set to hit the wire at 12.30pm GMT today, we have decided to remain flat going into the week’s end.
Levels to watch/live orders
- Buys: Flat (Stop loss: N/A).
- Sells: Flat (Stop loss: N/A).
USD/CHF:
Going into yesterday’s US session, the Swissy pair took a hit to the mid-section as prices aggressively tumbled lower. This move was likely bolstered by a lower than expected US pending home sales reading and an overall stronger Swiss Franc seen across the board. Price drove through both the H4 trendline support extended from the low 0.9631 and the minor H4 support at 0.9661, leaving the candles free to tag the larger H4 support just beneath it at 0.9648, before printing a small end-of-day correction. As things stand at the moment, the H4 picture shows that the buyers and sellers are capped by the underside of the recently broken H4 trendline and the minor H4 support mentioned above at 0.9661.
Despite the recent push lower, daily activity is still seen trading within the lower edge of a support area coming in at 0.9648-0.9708. Up on the weekly timeframe, nonetheless, the candles show room to continue grinding lower down to weekly support at 0.9581 (the lower limit of the current weekly range [1.0092-0.9928/0.9581]).
Our suggestions: For traders wishing to buy this market, we would advise waiting for price to take out the current H4 trendline resistance beforehand. Targets for longs beyond this boundary come in at the H4 resistance area drawn from 0.9706-0.9721, followed by the 0.98 handle.
Conversely, to become sellers in this market, waiting for at least a H4 close beyond the H4 support at 0.9648 would, in our opinion, be the better route to take. Not only would the H4 path then potentially be clear down to the 0.96 hurdle, but also the last remaining bids within the aforementioned daily support area would very likely be taken out. To trade this move, nevertheless, a retest to the underside of 0.9648 would need to be seen along with a reasonably sized H4 bearish candle, with the 0.96 level in mind as a first take-profit target.
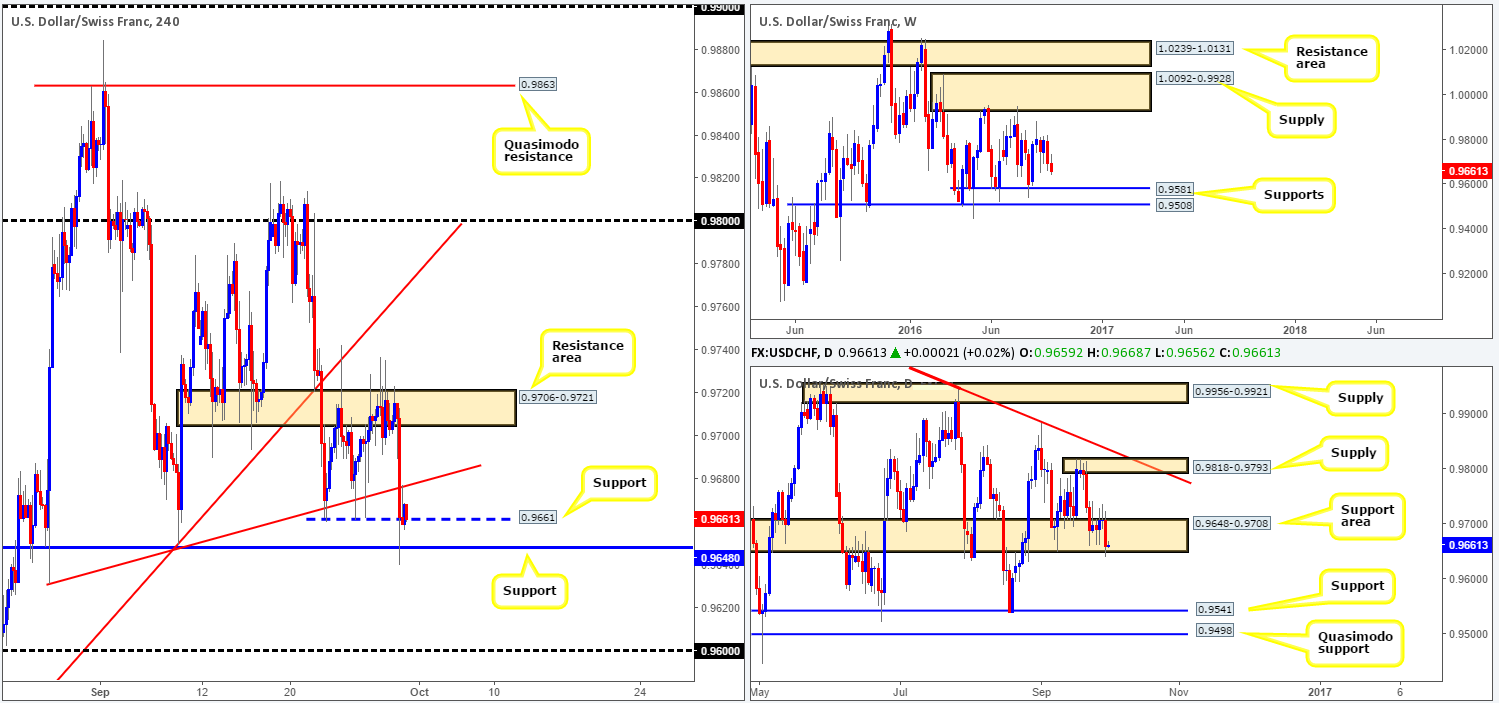
Levels to watch/live orders:
- Buys: Watch for a close above the H4 trendline resistance extended from the low 0.9631 and look to trade any retest seen thereafter (a H4 bullish close following the retest would be a bonus).
- Sells: Watch for a decisive close below the H4 support level at 0.9648 and look to trade any retest seen thereafter (H4 bearish close required).
DOW 30:
Despite upbeat US Labor and GDP data yesterday the US stock market had little response, as prices fell sharply throughout the course of the day. At this point, the H4 candles are seen capped by a resistance area formed by 18179-18206 and a support level seen at 18066. Now, just to be clear, we have no interest in buying from this support nor would we sell from the overhead resistance zone.
For one, selling at the resistance area when price recently connected with a daily trendline support taken from the low 15501 is, in our opinion, asking to for trouble. And, buying from the current support, even though it’s bolstered by a daily trendline support, is risky, when weekly action shows room to push back down to 17977: a support level.
Our suggestions: Put simply, our team has their eye on the H4 Quasimodo support level at 18023 for buys. As the stop will be placed below the head of this formation (17959), this just clears the weekly support hurdle mentioned above at 17977. Therefore, our team has set a pending buy order at 18024 with a stop set at 17955. The first take-profit target is likely to be the underside of the current support at 18066.
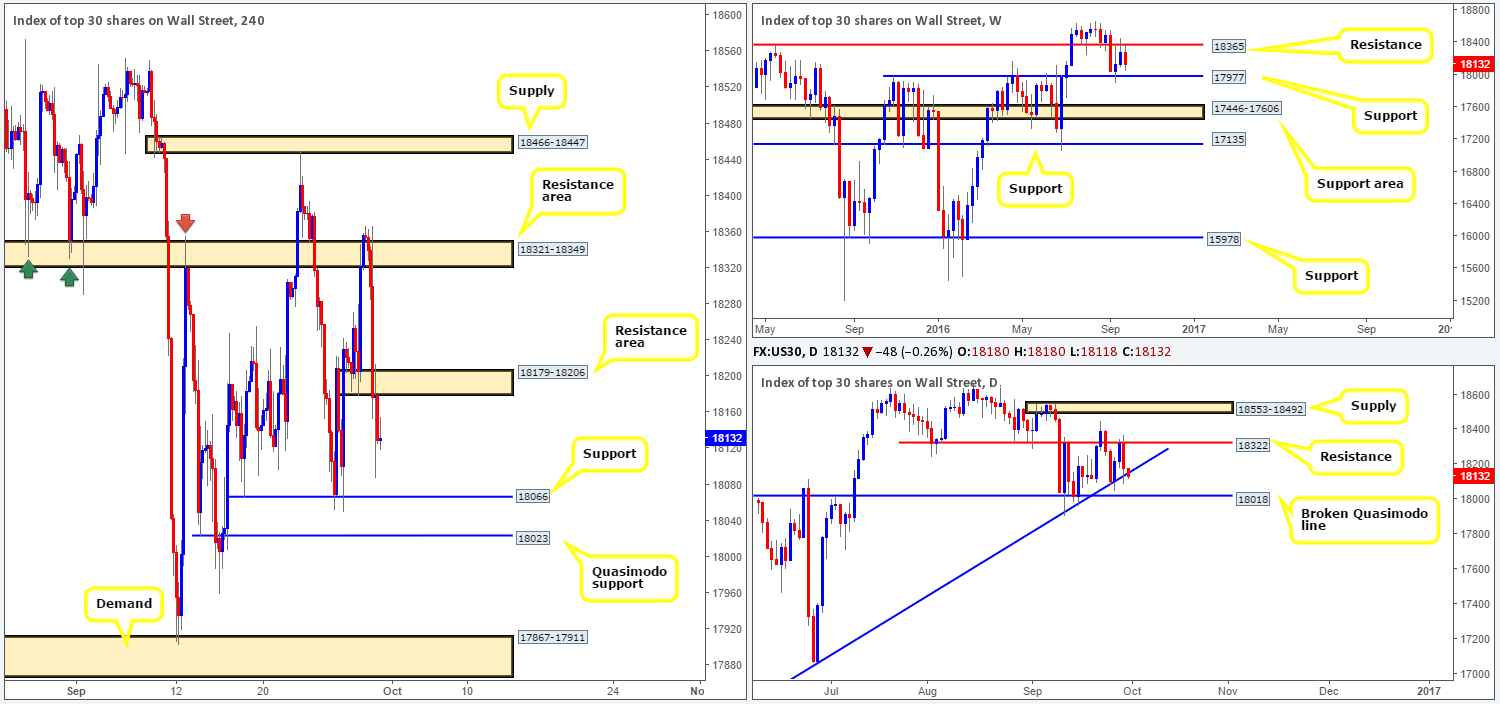
Levels to watch/live orders:
- Buys: 18024 [pending order] (Stop loss: 17955).
- Sells: Flat (Stop loss: N/A).
GOLD:
Following a stronger than expected US Labor and GDP reading yesterday, the gold market pushed lower, consequently tagging the H4 support coming in at 1316.0. Bolstered by a daily demand area at 1305.3-1322.8, this support level managed to push the yellow metal to highs of 1324.2 by the close. 1316.0, along with the lower H4 Quasimodo support level at 1311.8, were both levels of interest highlighted in yesterday’s report, so well done to any of our readers who managed to jump aboard here!
To our way of seeing things at the moment, as long as weekly action does not push down to test the support area seen at 1307.4-1280.0, further buying could be seen today towards the H4 resistance area given at 1331.8-1329.6. However, we would not consider becoming buyers until the H4 high marked with a red arrow at 1325.6 is consumed. This represents the top edge of the last H4 supply area which could stop prices from reaching the above noted H4 resistance area. To be on the safe side, we would not only require a close above this H4 high, but also a retest followed by a lower timeframe buy signal (see the top of this report for information on lower timeframe entry techniques).
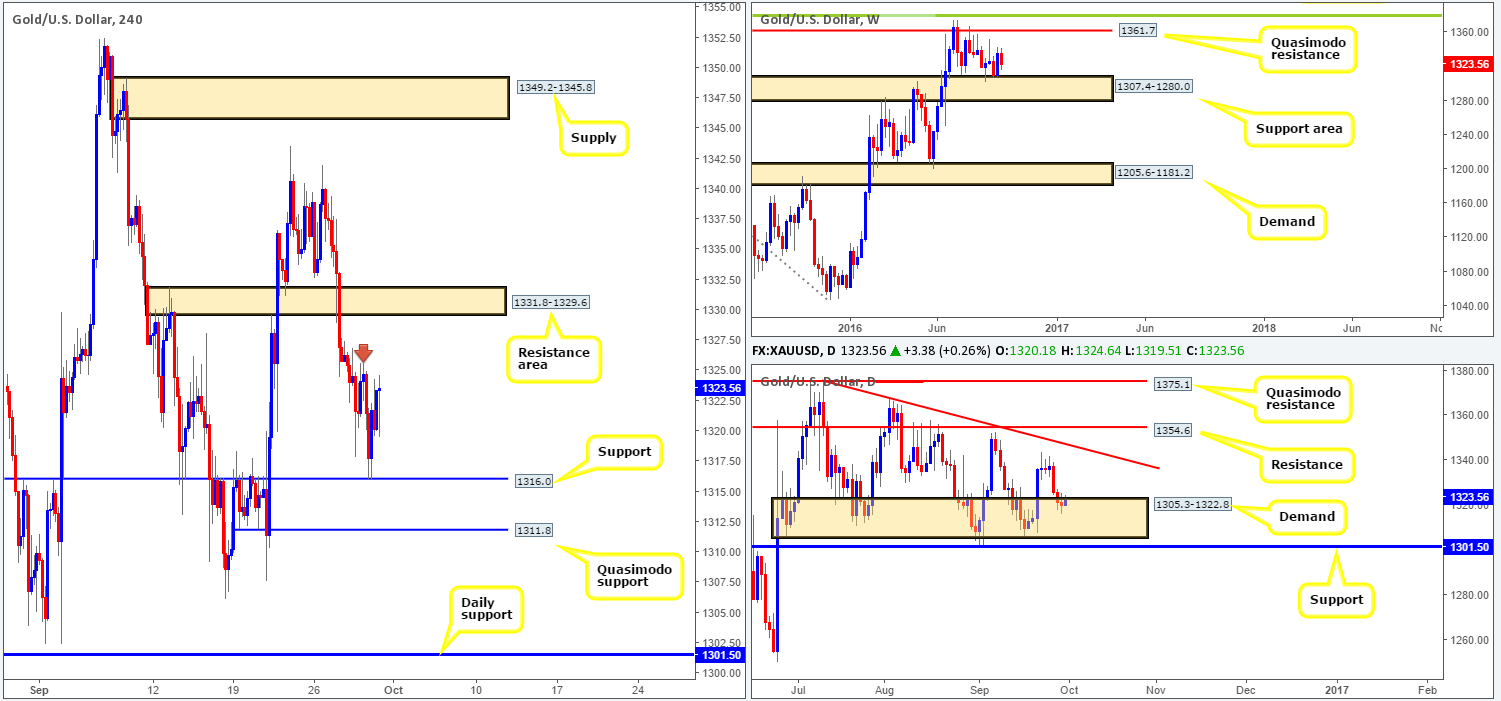
Levels to watch/live orders:
- Buys: Watch for a close above the H4 high at 1325.6 and look to trade any retest seen thereafter (lower timeframe confirmation required).
- Sells: Flat (Stop loss: N/A).


