A note on lower timeframe confirming price action…
Waiting for lower timeframe confirmation is our main tool to confirm strength within higher timeframe zones, and has really been the key to our trading success. It takes a little time to understand the subtle nuances, however, as each trade is never the same, but once you master the rhythm so to speak, you will be saved from countless unnecessary losing trades. The following is a list of what we look for:
- A break/retest of supply or demand dependent on which way you’re trading.
- A trendline break/retest.
- Buying/selling tails – essentially we look for a cluster of very obvious spikes off of lower timeframe support and resistance levels within the higher timeframe zone.
- Candlestick patterns. We tend to only stick with pin bars and engulfing bars as these have proven to be the most effective.
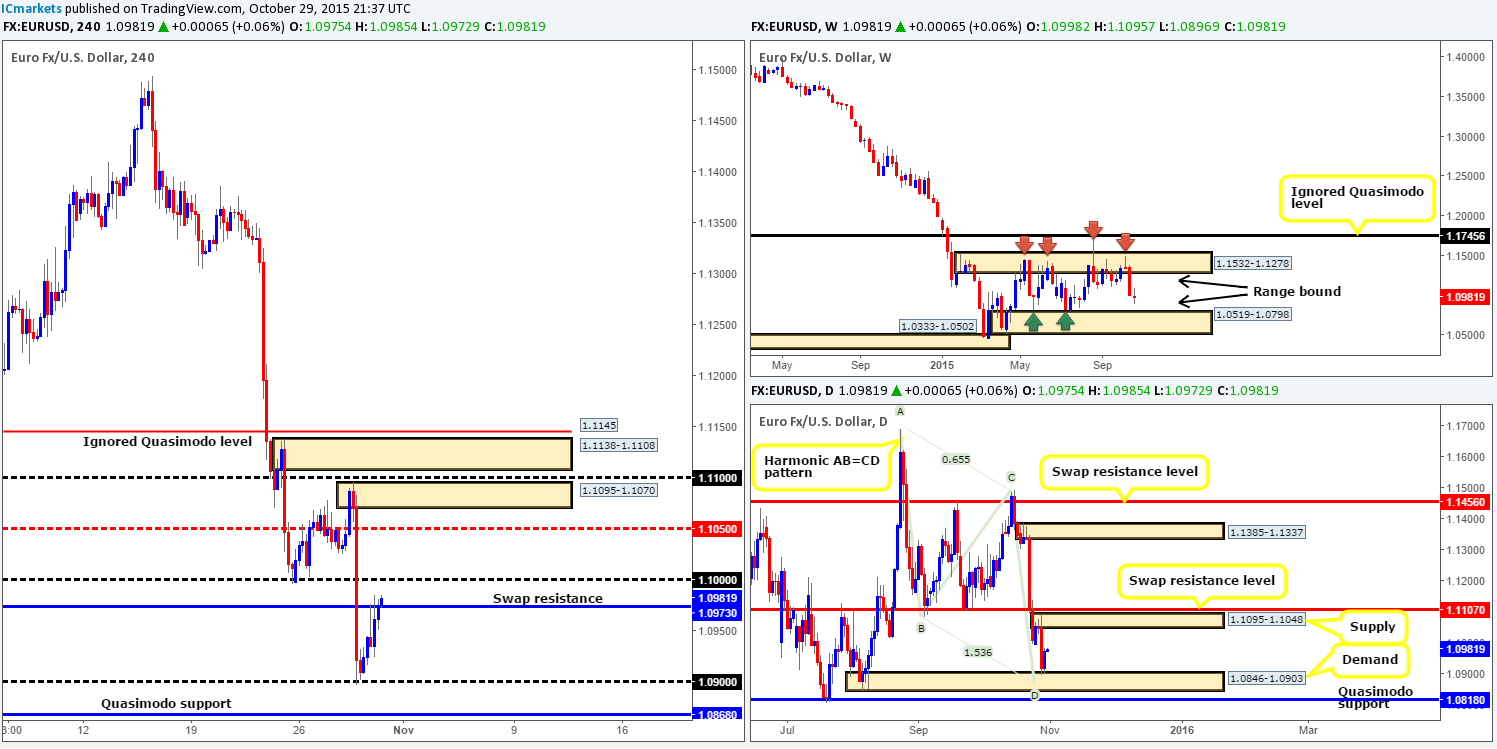
EUR/USD:
In our previous report (http://www.icmarkets.com/blog/thursday-29th-october-daily-technical-outlook-and-review/), we mentioned that psychological support 1.0900 was worthy of our attention due to it converging with the top-side of demand at 1.0846-1.0903 (also coincides with a nice-looking Harmonic AB=CD bull pattern at 1.0869). Unfortunately, we found little evidence of buying interest on the lower timeframes to permit us to enter long here. Well done to any of our readers who did though as price hit the swap resistance level 1.9730 (our immediate take-profit area) with little to no drawdown.
Pushing forward, what direction do we see the EUR going in today? Well, to be quite frank, it’s very difficult to judge. Here’s why:
- Weekly remains trading mid-range between 1.1532-1.1278/ 1.0519-1.0798 at the moment.
- From the daily timeframe, we can see price rebounded nicely off of the aforementioned demand zone, and appears to have room to continue appreciating north today up to supply at 1.1095-1.1048.
- 4hr action shows price currently trading above the aforementioned swap resistance level, and looks to be heading in the direction of the large psychological resistance 1.1000.
Therefore, neither a long nor short seems attractive to us at this time. Trade this pair carefully today guys!
Levels to watch/live orders:
- Buys: Flat (Stop loss: N/A).
- Sells: Flat (Stop loss: N/A).
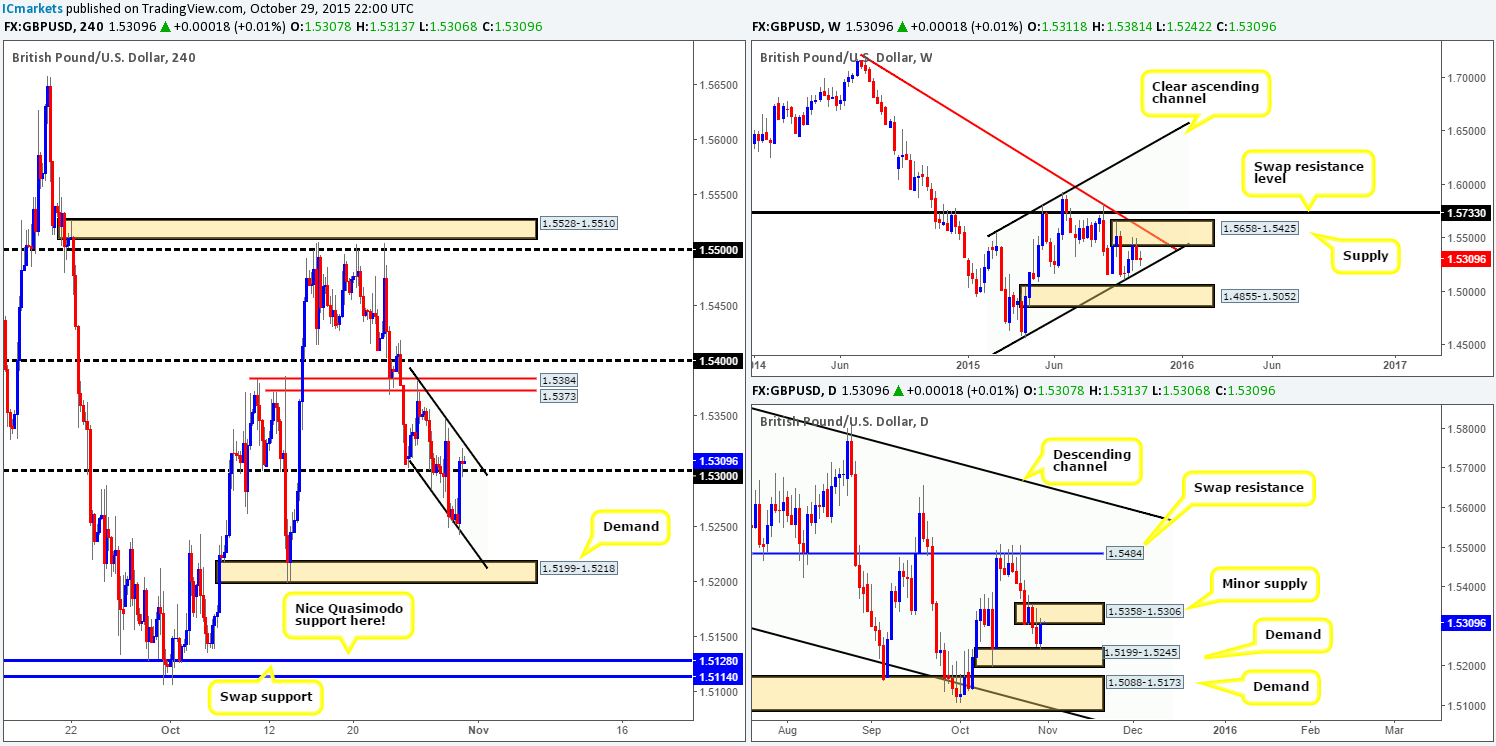
GBP/USD:
Using a top-down approach this morning, we can see that weekly action on Cable is beginning to show hesitation in between supply seen at 1.5658-1.5425 and channel support taken from the low 1.4564. Meanwhile, down in the pits of the daily timeframe, price is now kissing the underside of a minor supply base drawn from 1.5358-1.5306 following a rebound from demand at 1.5199-1.5245.
Turning our attention to the 4hr timeframe, however, it is clear to see that a healthy round of bids entered the market place from lows of 1.5242 as we moved into the American session yesterday. This, as you can see, pushed price above psychological resistance 1.5300, which is, at the time of writing, holding firm as support. In addition to this, Cable is also encased within a downward channel (1.5381/1.5282) at the moment, and right now is seen flirting with the upper limits of this pattern.
Given the points above, it is, like the EUR/USD, such a tricky one to call today! We have weekly showing indecision, the daily trading around the underside of a minor supply area and the 4hr tightly confined between two opposing lines (see above in bold). With this, as far as we see, there is no trade opportunity presenting itself at this time.
Levels to watch/ live orders:
- Buys: Flat (Stop loss: N/A).
- Sells: Flat (Stop loss: N/A).
AUD/USD:
Previously (http://www.icmarkets.com/blog/thursday-29th-october-daily-technical-outlook-and-review/), we mentioned that we believed this pair had further to depreciate due to the weekly chart (at that time) showing room to continue lower to demand at 0.6935-0.7046. Additionally, there was, and still is mind you, room to move lower on the daily timeframe down towards a major swap support barrier coming in at 0.7035, which is located within the above said weekly demand.
We also mentioned that if prices were to close below the 4hr demand zone at 0.7101-0.7113 and a confirmed retest to the underside of this area was seen, we may short. Unfortunately, we could not pin-point a setup here to allow us to commit to a position yesterday. Well done to any of our readers who managed to lock in some green pips from this move.
Going forward, we can see that weekly action is now kissing the top-side of the above said weekly demand. Usually, we would be looking to take a long right about now, especially seeing as price is trading around a 4hr demand zone circled in pink at 0.7055-0.7077. However, we still remain wary here due to the possibility of a further drive lower on the daily scale to the test the major swap support level mentioned above at 0.7035. To that end, we’re going to stick with our original analysis and wait and see if price touches gloves with demand drawn from 0.7002-0.7209 before we consider buying this market (sits just below the daily level and very deep within the weekly demand).
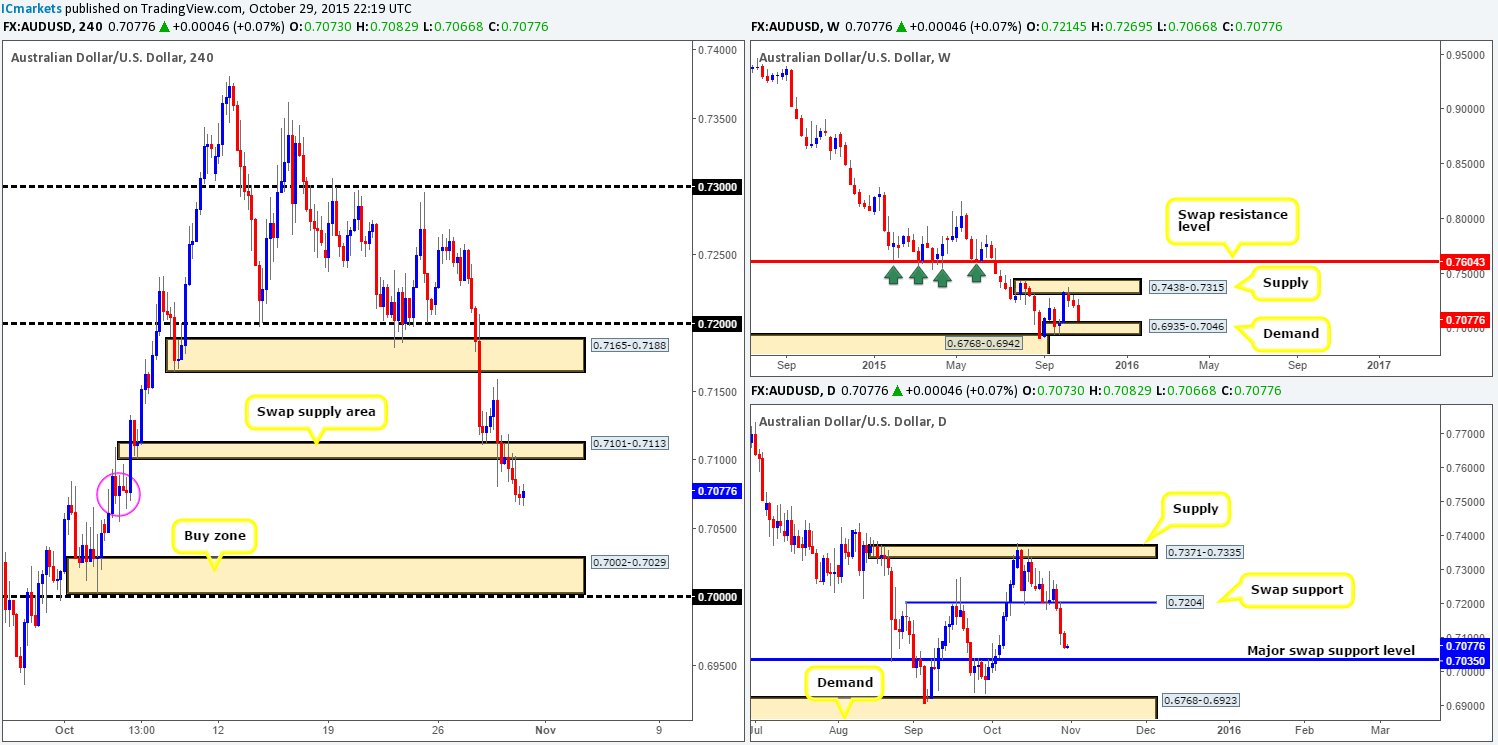
Levels to watch/ live orders:
- Buys: 0.7002-0.7209 [dependent on the approach to this zone and time of day, we may consider entering at market here] (Stop loss: likely below 0.7000 by about 10 pips).
- Sells: Flat (Stop loss: N/A).
USD/JPY:
Throughout the course of yesterday’s trade, we saw support form around the 120.70 mark, pushing this market up to and beyond psychological resistance 121.00, which, as you can see, is being retested as support now.
To our way of seeing things, from the weekly down to the daily timeframe this market is trading around overall supply (weekly range resistance area at 122.01-121.40/daily range supply area visible at 121.72-121.21). That being the case, we have absolutely no interest in buying this pair from 121.00 today. With regards to selling on the other hand, here is what we’re currently looking at:
- Once/if price breaks below 120.71, we may consider a short on any retest seen at this level (with confirmation), due to there being a relatively clear path lower down towards demand at 120.05-120.27.
- And, as we mentioned in yesterday’s analysis, we’ll also be keeping an eye on the Quasimodo resistance area above at 121.72-121.38 for potential sells, due to where it is located on the higher timeframe picture (see above).
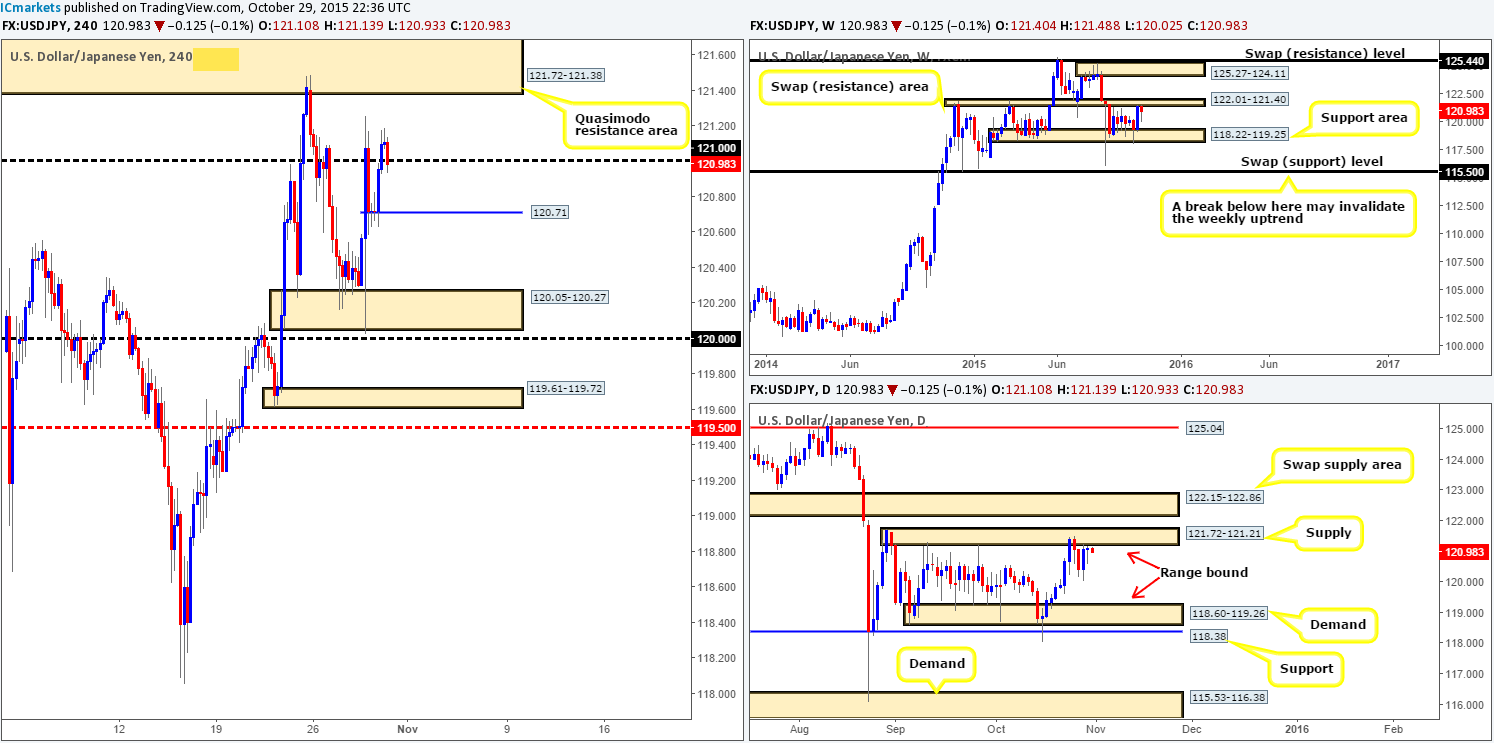
Levels to watch/ live orders:
- Buys: Flat (Stop loss: N/A).
- Sells: Watch for bids to be consumed around 120.71 and then look to trade any retest seen at this level (confirmation required) 121.72-121.38 [Tentative – confirmation required] (Stop loss: dependent on where one confirms this area).
USD/CAD:
Based on recent price action, we can see that the 4hr chart is currently in the process of chalking up an AB=CD bull pattern completing deep within demand (1.3038-1.3082) at 1.3055. Additionally, there is also converging 50.0% Fibonacci support being seen at the base of this pattern.
With the above structures forming a relatively cool buy zone at the moment, how do things stand on the higher timeframes? Well, both the weekly and daily timeframes show price still loitering above a swap support level coming in at 1.3128. That being the case, for our area of interest on the 4hr timeframe to see action, price will need to fake below this weekly level and also psychological support 1.3100. Personally we think this is possible. Ultimately though, we would want to see our demand area hit today, as we like our AB=CD structures to be reasonably symmetrical. If we do see the above occur, depending on the time of day, we will likely enter at market with our stop placed below at 1.3032.
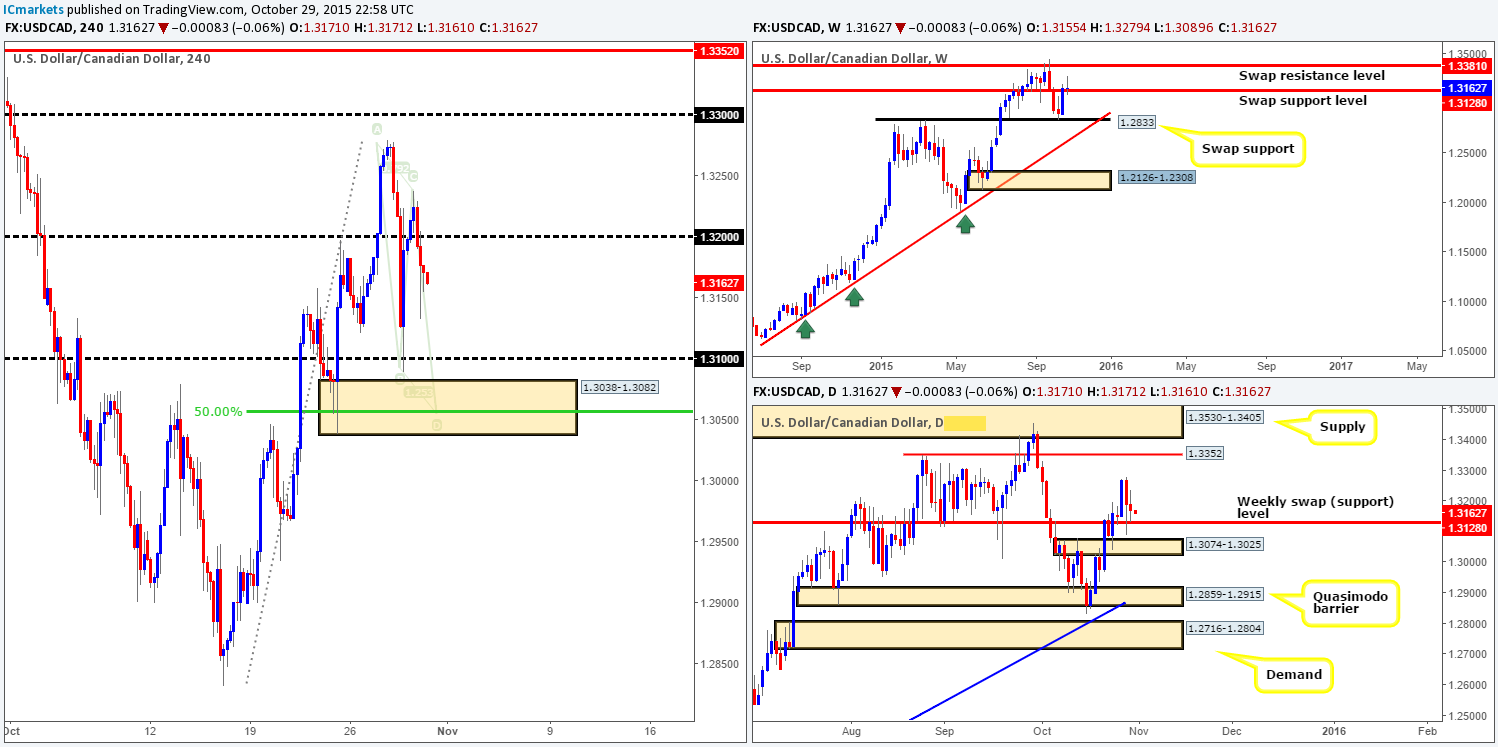
Levels to watch/ live orders:
- Buys: (Looking to enter at market around the 1.3038-1.3082 demand area. However, this will depend on the time of day).
- Sells: Flat (stop loss: N/A).
USD/CHF:
As can be seen from the 4hr chart, the USD/CHF sold off from within supply coming in at 0.9981-0.9936 yesterday, bringing price down into the jaws of psychological support 0.9900. On two occasions, the buyers attempted to defend this number before finally giving way late during the U.S. session.
Now, a close below a psychological support is significant in itself and, in our experience, usually portends to further downside. Despite this, when we look across to the higher timeframe picture, the close below 0.9900 on the 4hr scale no longer looks so attractive! The weekly shows a clear run north up to a stacked area of supply coming in at 1.0239-1.0131/1.0126-1.0044. In addition to this formation, we also see a nice-looking AB=CD Harmonic pattern completing around 1.0046. Down on the daily, however, we can see that price is currently retesting a recently broken resistance barrier as support at 0.9893. Should this daily level give way, there is very little that we see stopping this pair from falling back down to the weekly swap (support) level at 0.9795.
Taking the above into consideration, here is our two cents’ worth on current market structure:
- A daily close below the daily level mentioned above at 0.9893 could see price depreciate. This may open up the possibility of a retest trade to the underside of 0.9900 next week. Furthermore, a close lower will also likely result in price attacking 4hr demand at 0.9819-0.9843, followed closely by the ignored Quasimodo support at 0.9802 (both of which are located very close to the weekly swap [support] level at 0.9795). In our book, these two 4hr barriers would be considered worthy buy zones!
- Should the daily level hold ground today, nonetheless, a break above 0.9900 will be seen and price will likely drive higher into the current 4hr supply zone at 0.9981-0.9936, and potentially reach parity by the day’s end.
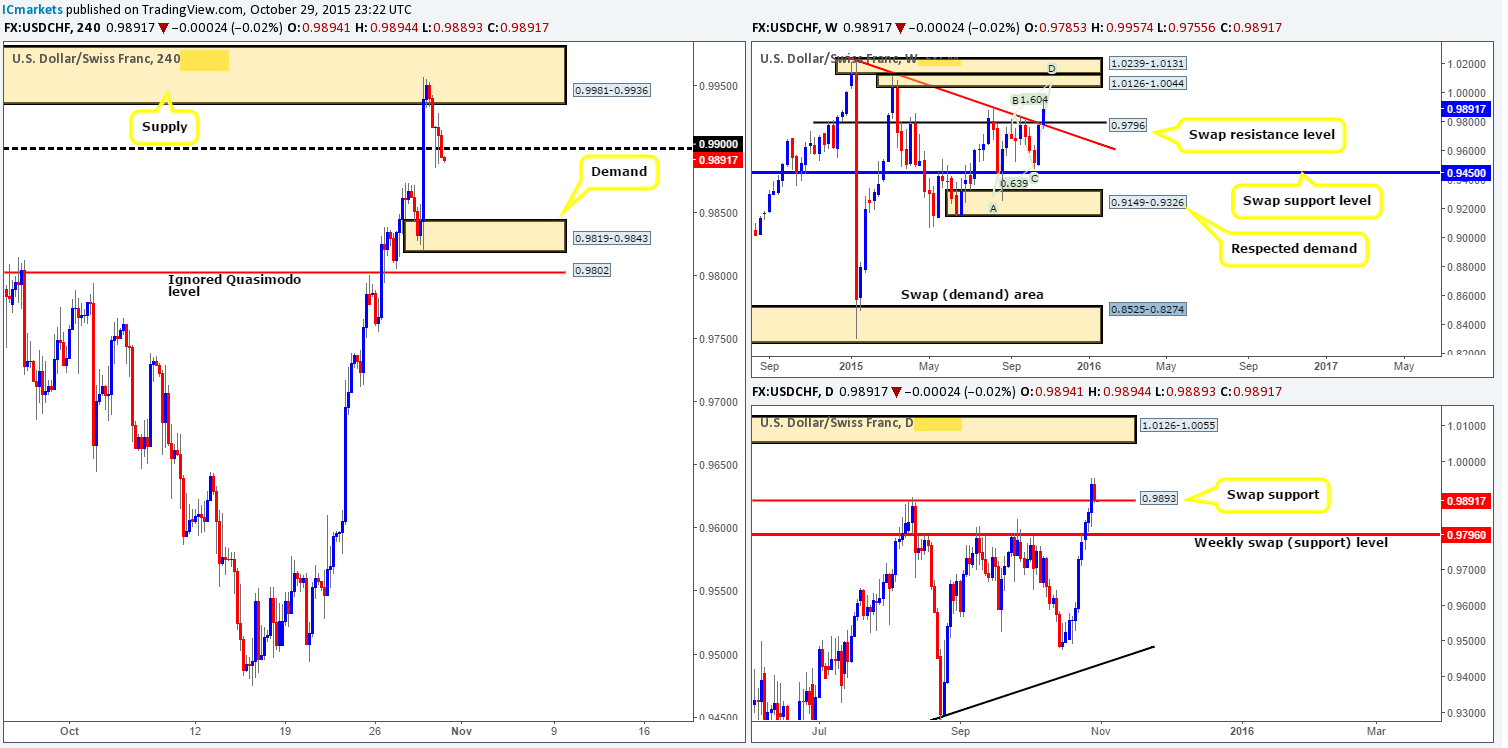
Levels to watch/ live orders:
- Buys: 0.9819-0.9843 [Tentative – confirmation required] (Stop loss: dependent on where one confirms this area) 0.9802 [Tentative – confirmation required] (Stop loss: dependent on where one confirms this level).
- Sells: Flat (Stop loss: N/A).
DOW 30: (We still have a LIVE short in the market from 17527 with our stop at 17830 [above weekly supply]).
Things are not looking too good for our short taken way down at 17527 right now! Price rebounded from the 4hr Quasimodo resistance level at 17772 early on in yesterday’s trade, bringing the DOW into a swap support drawn from 17960. We were hoping to see a break below this level, but, as you can see, the buyers had other plans unfortunately!
With price once again trading around the aforementioned Quasimodo resistance level, where do we go from here? Well, yesterday, we were confident sellers. Now, however, we’re not so sure. Although price is trading within a weekly supply zone at 17800-17600 and also within its partner zone on the daily timeframe at 17800-17723 at the moment, we have yet to see any real selling interest materialize over the past few days.
Therefore, if our sell position is not stopped out today, we’ll close it manually and end the week flat in this market.
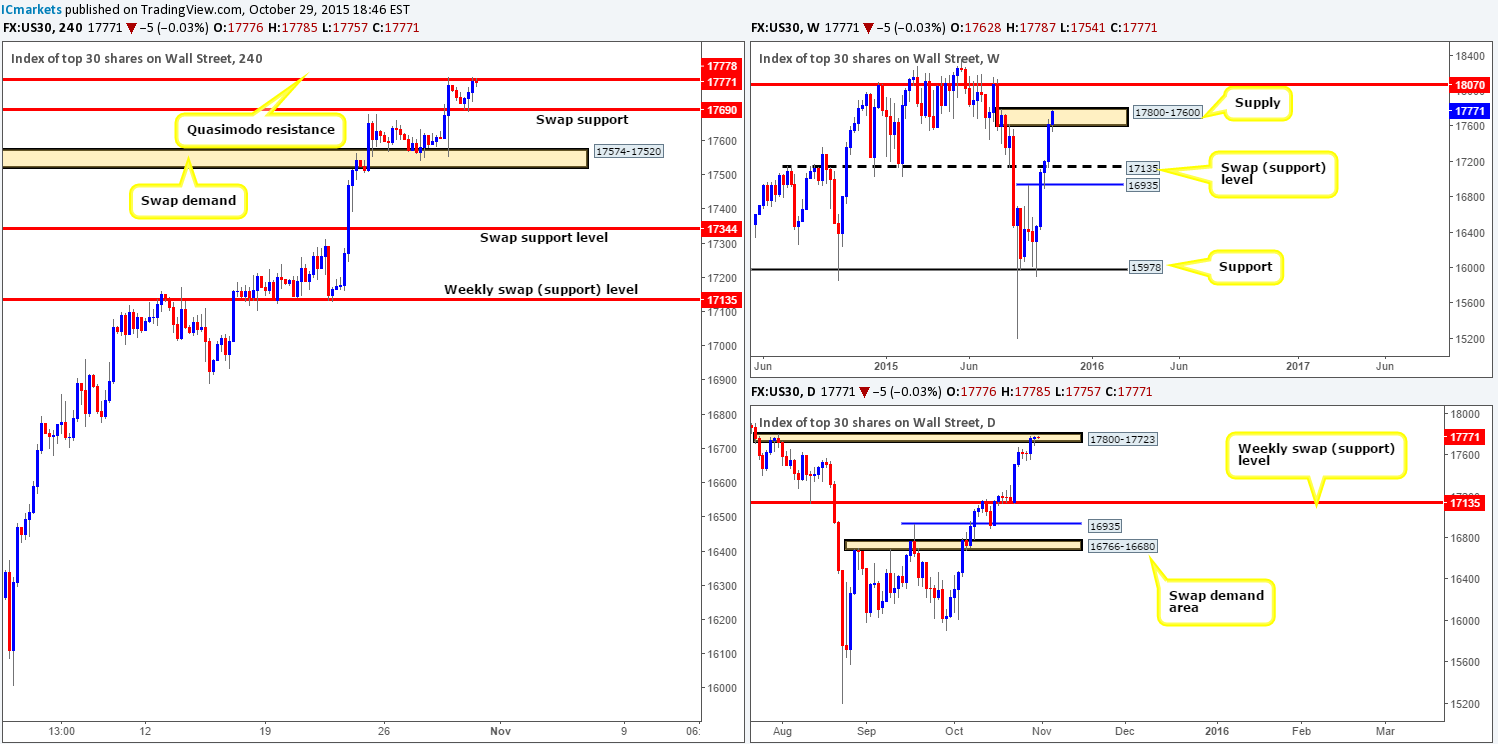
Levels to watch/ live orders:
- Buys: Flat (Stop loss: N/A).
- Sells: 17527 [LIVE] (Stop loss: 17830).
XAU/USD: (Gold)
Beginning with the weekly timeframe this morning, we can see that following a second stab to the underside of supply at 1205.6-1181.2, price is now trading below the swap support level at 1157.4. Should a close form below this barrier this week, the path south is likely clear for prices to continue lower next week down to demand coming in at 1098.6-1121.7. Daily action on the other hand, shows that this recent selling has brought Gold into the jaws of a strong-looking demand drawn from 1136.5-1145.0.
Going one lower to the 4hr timeframe, Gold strongly sold off from the underside of swap resistance at 1162.2 yesterday, consequently closing below the Quasimodo base at 1151.7-1154.7, and reaching lows of 1144.5 on the day.
With the above in mind, today’s spotlight will firmly be focused on the demand area at 1136.5-1140.7. Not only is this beauty located deep within daily demand mentioned above at 1136.5-1145.0, it also boasts additional support from the 61.8% Fibonacci level at 1137.7.
The only drawback to trading this zone long that we see is the current weekly structure showing room to drop lower (see above). Nevertheless, we still expect a decent bounce from this zone. We have placed a pending buy order at 1141.4, with a stop just below at 1135.3. Should our order not be filled before the beginning of the U.S. session, we’ll likely cancel it and reassess next week.
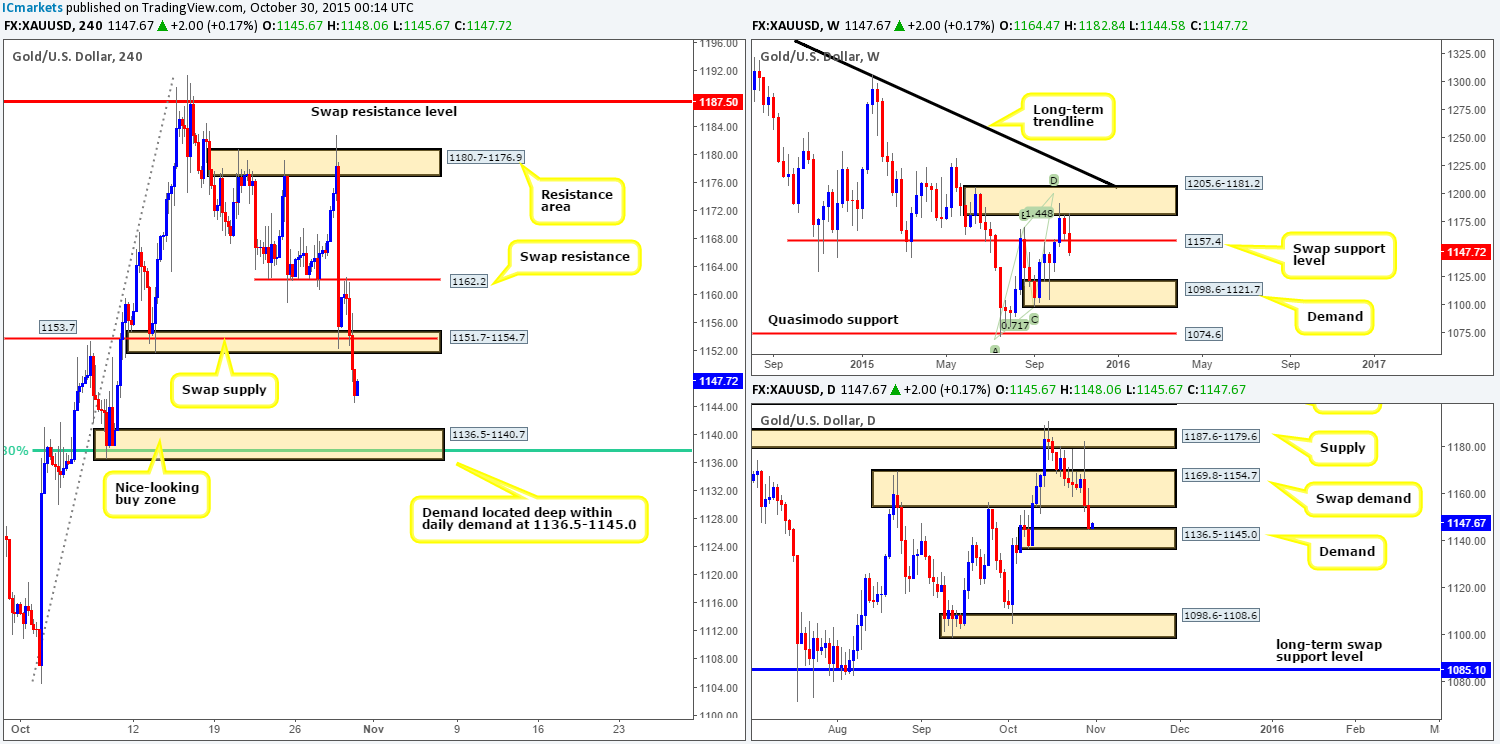
Levels to watch/ live orders:
- Buys: 1141.4 [Pending order] (Stop loss: 1135.3).
- Sells: Flat (Stop loss: N/A).


