EUR/USD:
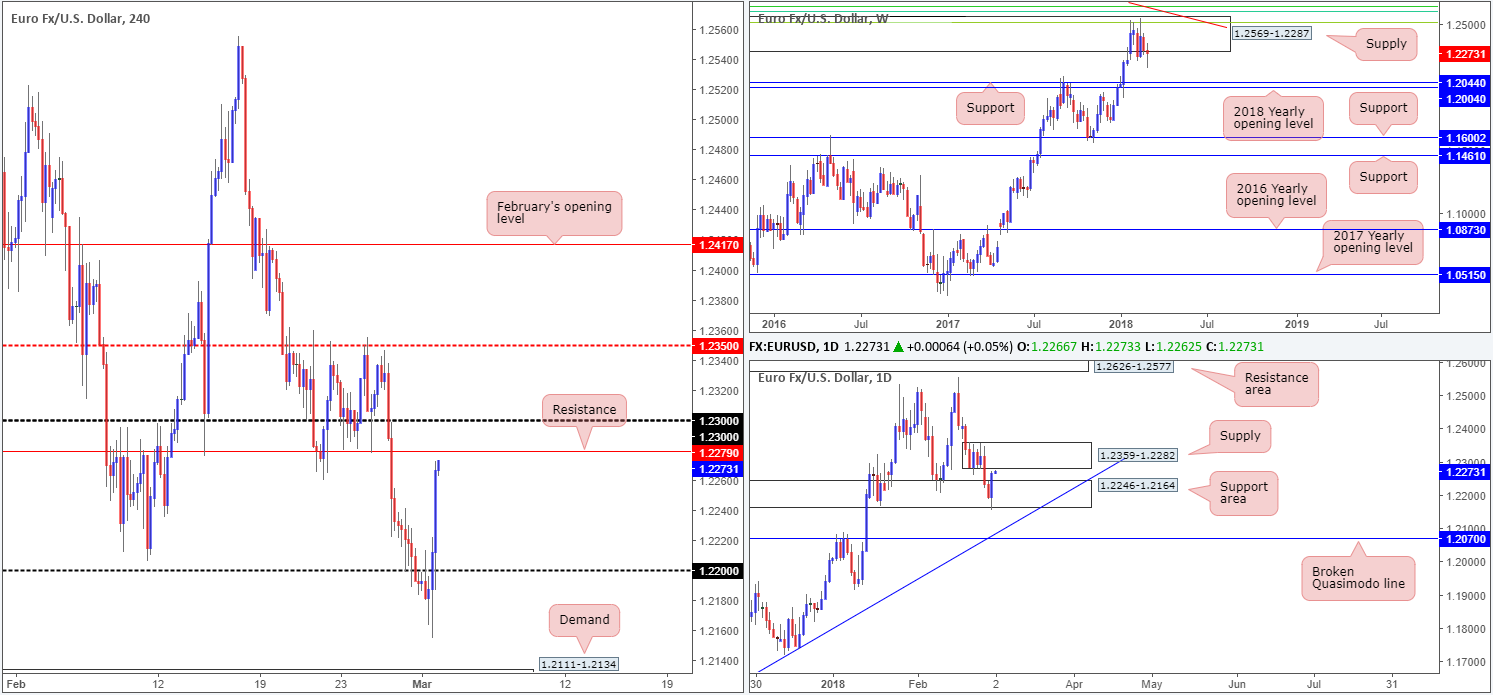
After dropping sharply the past couple of days, the euro found a floor of bids just ahead of a H4 demand base located at 1.2111-1.2134. H4 price reclaimed the 1.22 handle and aggressively climbed to highs of 1.2272, which, as far as we can see, was largely led by fears over Trump’s recent announcement regarding tariffs on imported steel and aluminum.
While latest movements saw daily action form a strong-looking daily bullish engulfing candle from a daily support area at 1.2246-1.2164, upside is somewhat limited on this scale given the nearby daily supply base at 1.2359-1.2282. What this move also accomplished was pushing weekly price back up to the underside of a major weekly supply area coming in at 1.2569-1.2287.
Potential trading zones:
The H4 resistance seen just ahead of current price at 1.2279 is attractive, with it having held as support so well in the past. This – coupled with the line also being located around the underside of the aforementioned daily and weekly supplies, as well as a few pips ahead of the round number 1.23, this level is likely to be a solid battle line going forward. As for take-profit targets from this angle, we’d be looking for the unit to at least reconnect with 1.22.
Data points to consider: German retail sales m/m at 7am; Spanish unemployment change at 8am; US revised UoM consumer sentiment at 3pm GMT.
Areas worthy of attention:
Supports: 1.22 handle; 1.2111-1.2134; 1.2246-1.2164.
Resistances: 1.23 handle; 1.2279; 1.2569-1.2287; 1.2359-1.2282.
GBP/USD:
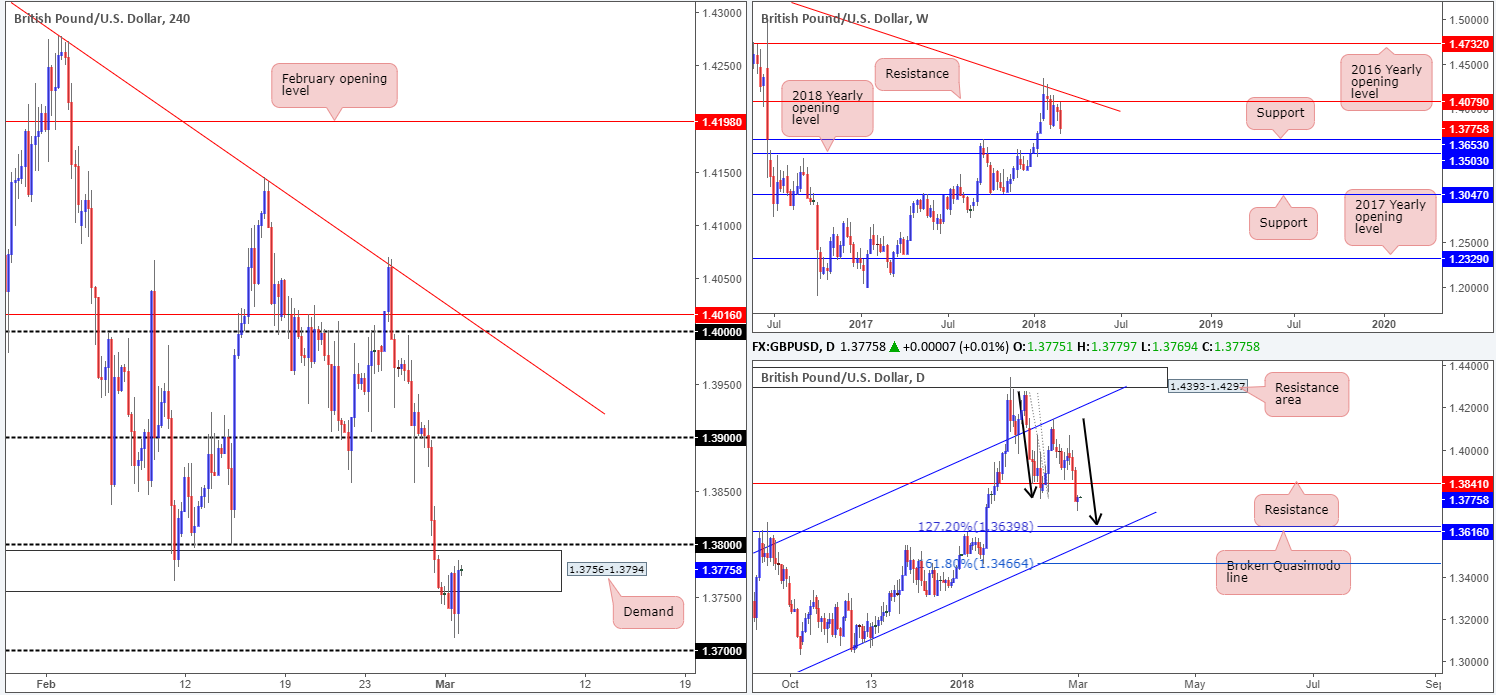
The GBP/USD, as you can see on the H4 chart this morning, experienced a significant amount of choppy action on Thursday around the underside of a recently broken H4 demand base at 1.3756-1.3794. Likely caused by Brexit angst and Trump’s recent announcement regarding tariffs on imported steel and aluminum, this movement has highly likely cleared stops and opened the door down to the 1.37 handle.
Views from the bigger picture also continue to echo a bearish vibe. Weekly price shows little stopping it from reaching weekly support plotted at 1.3653, while daily action appears to be on course to shake hands with a daily broken Quasimodo line at 1.3610 that is positioned nearby a daily AB=CD 127.2% Fib ext. point at 1.3639.
Potential trading zones:
Given that the higher timeframes indicate room to push lower, the team’s attention is drawn to the aforementioned broken H4 demand and nearby 1.38 handle. A full or near-full-bodied H4 bearish candle printed around this area would, in our humble opinion, be enough to validate shorts, ultimately targeting the 1.37 area as an initial take-profit zone, followed by 1.3653 and then 1.3639/1.3616.
Data points to consider: PM May speaks today (timing is tentative); UK construction PMI at 9.30am; BoE Gov. Carney speaks at 10am; US revised UoM consumer sentiment at 3pm GMT.
Areas worthy of attention:
Supports: 1.37 handle; 1.3616/1.3639; 1.3653.
Resistances: 1.38 handle.
AUD/USD:
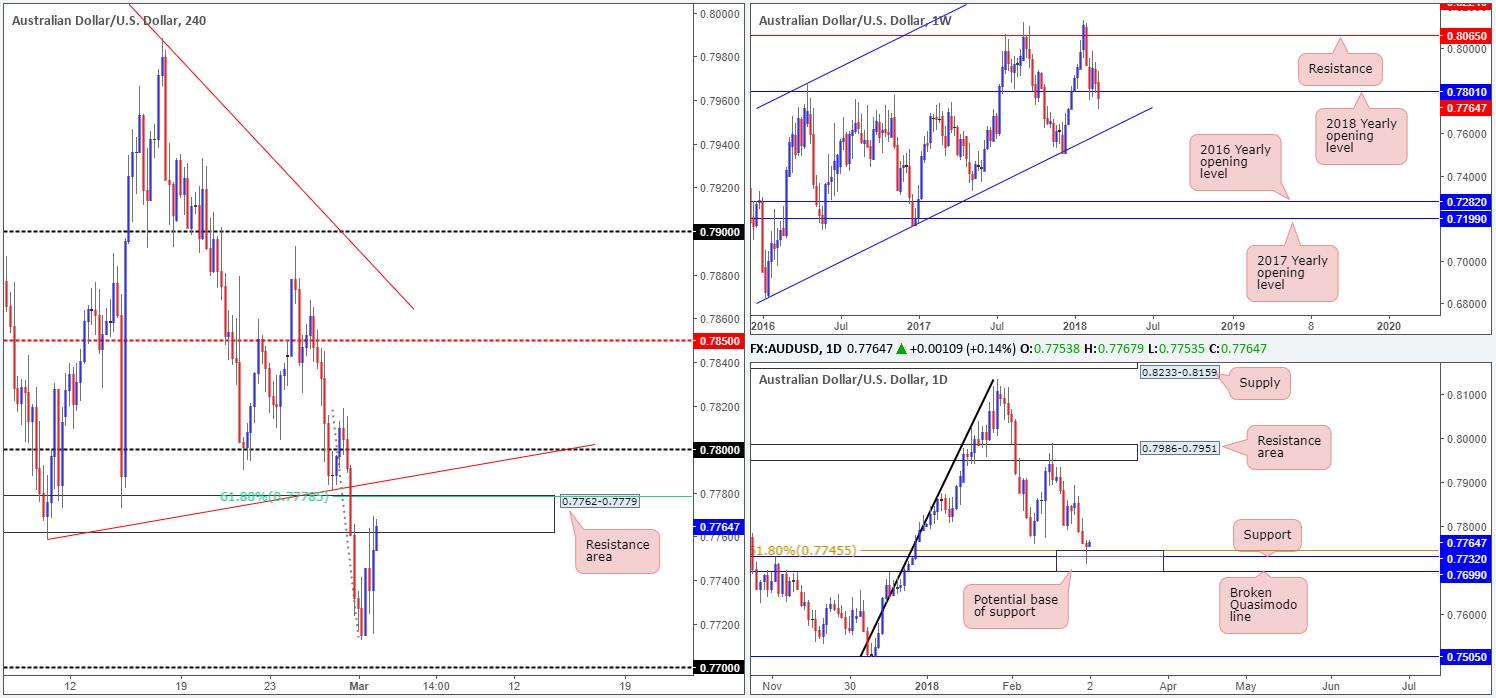
Despite recording its third consecutive daily loss on Thursday, the commodity currency printed a nice-looking daily rejection candle from within the walls of a daily support area fixed between 0.7699/0.7745. This has likely caught the attention of candle enthusiasts who are more than likely prepping to slam down that buy button!
Although we are also fond of the recent daily buying tail, the H4 and weekly timeframes do not really imbue confidence. H4 price recently shook hands with a H4 resistance area pegged at 0.7762-0.7779, which happens to be positioned just beneath a H4 trendline resistance taken from the low 0.7758 and also nearby a 61.8% H4 Fib resistance at 0.7778. In addition to this, weekly flow remains below the 2018 yearly opening level at 0.7801, which is basically represented by the 0.78 handle on the H4 scale and could therefore act as resistance. As is evident from the charts, the bulls certainly have their work cut out for them should they intend on trying to push higher!
Potential trading zones:
Buying this market, despite a strong-looking daily support zone and daily buying tail, is not something the team here would label a high-probability move given the large amount of topside resistance just overhead. At the same time, though, selling is also not really favorable in this market, according to current structure.
Irrespective of the direction one selects today, you will be going up against some form of higher-timeframe structure. Therefore, opting to stand on the sidelines may be the better path to take today.
Data points to consider: US revised UoM consumer sentiment at 3pm GMT.
Areas worthy of attention:
Supports: 0.77 handle; 0.7699/0.7745.
Resistances: 0.78 handle; H4 trendline resistance; 0.7778; 0.7801; 0.7762-0.7779.
This site has been designed for informational and educational purposes only and does not constitute an offer to sell nor a solicitation of an offer to buy any products which may be referenced upon the site. The services and information provided through this site are for personal, non-commercial, educational use and display. IC Markets does not provide personal trading advice through this site and does not represent that the products or services discussed are suitable for any trader. Traders are advised not to rely on any information contained in the site in the process of making a fully informed decision.
This site may include market analysis. All ideas, opinions, and/or forecasts, expressed or implied herein, information, charts or examples contained in the lessons, are for informational and educational purposes only and should not be construed as a recommendation to invest, trade, and/or speculate in the markets. Any trades, and/or speculations made in light of the ideas, opinions, and/or forecasts, expressed or implied herein, are committed at your own risk, financial or otherwise.
The use of the site is agreement that the site is for informational and educational purposes only and does not constitute advice in any form in the furtherance of any trade or trading decisions.
The accuracy, completeness and timeliness of the information contained on this site cannot be guaranteed. IC Markets does not warranty, guarantee or make any representations, or assume any liability with regard to financial results based on the use of the information in the site.
News, views, opinions, recommendations and other information obtained from sources outside of www.icmarkets.com.au, used in this site are believed to be reliable, but we cannot guarantee their accuracy or completeness. All such information is subject to change at any time without notice. IC Markets assumes no responsibility for the content of any linked site. The fact that such links may exist does not indicate approval or endorsement of any material contained on any linked site.
IC Markets is not liable for any harm caused by the transmission, through accessing the services or information on this site, of a computer virus, or other computer code or programming device that might be used to access, delete, damage, disable, disrupt or otherwise impede in any manner, the operation of the site or of any user’s software, hardware, data or property.


