EUR/USD:
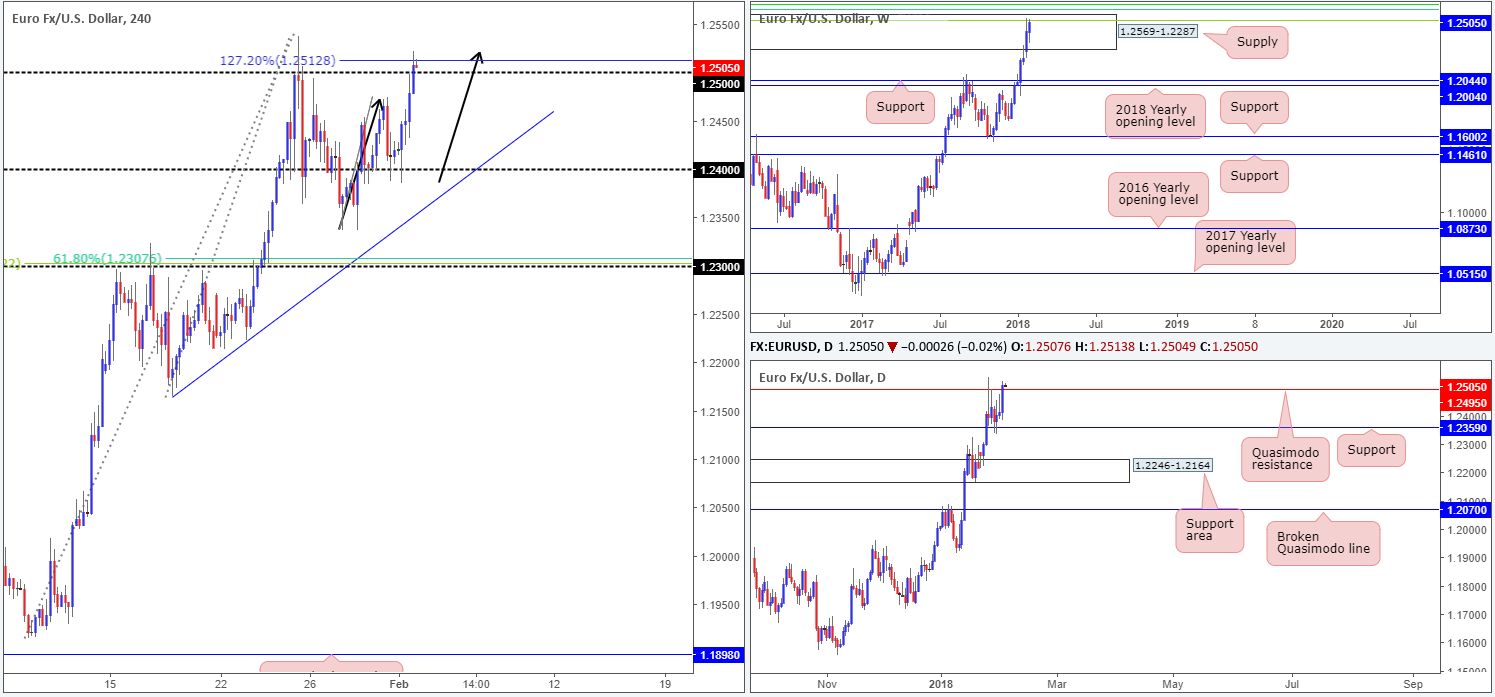
The euro made considerable ground against its US counterpart on Thursday, after finding active bids around the 1.24 handle (H4 timeframe). Largely ignoring better-than-expected US ISM manufacturing PMI data, the pair, as you can see, concluded the day marginally closing beyond the 1.25 handle and connected with a H4 AB=CD (see black arrows) 127.2% Fib ext. point at 1.2512.
Despite daily price also faintly crossing above a daily Quasimodo resistance at 1.2495, let’s keep in mind that weekly movement remains trading within the walls of a weekly supply zone printed at 1.2569-1.2287. Another essential point to consider is that yesterday’s high: 1.2522 connected beautifully with a 38.2% weekly Fib resistance at 1.2519 taken from the high 1.6038 (forms part of a weekly Fib cluster circling around the top edge of the current weekly supply base).
Potential trading zones:
With weekly supply still in play (along with weekly Fib zone) and the H4 AB=CD 127.2% Fib ext. point recently brought into the fray, as well as a truckload of stop-loss orders above 1.25 now likely filled (buy stops provide liquidity to sell), a selloff could be in store. To be safe, however, stop-loss orders for any shorts at this point are best placed beyond the weekly supply edge (1.2569).
Data points to consider: EUR Spanish unemployment change at 8am; US job’s figures at 1.30pm; US revised UoM consumer sentiment at 3pm; FOMC member Williams speaks at 7.30pm GMT.
Areas worthy of attention:
Supports: 1.24/5 handle.
Resistances: 1.2569-1.2287; Weekly Fib cluster; 1.2495.
GBP/USD:
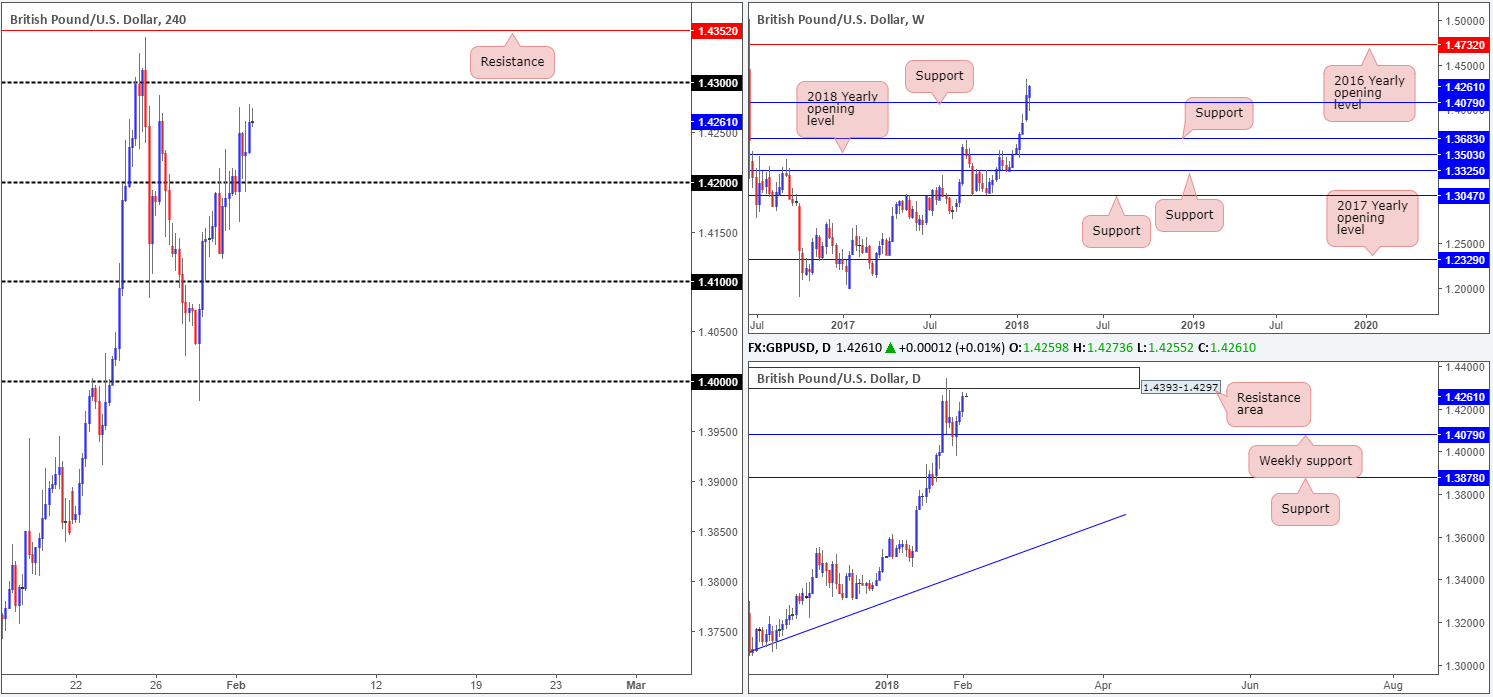
Like the EUR/USD, the British pound also ended Thursday’s segment in positive territory.
Lower-than-expected UK manufacturing PMI figures, however, did spark a round of intraday selling (seen clearer on the M30 timeframe), which eventually saw H4 price retest the 1.42 handle as support. 1.42, as you can see, remained firm into the day’s close, despite a strong US ISM manufacturing PMI reading.
The next upside hurdle on the H4 scale can be seen at 1.43, which aligns nicely with the underside of a daily resistance area plotted at 1.4393-1.4297. Meanwhile, weekly price continues to reflect a bullish stance above weekly support at 1.4079. Continued bidding from this neighborhood is a reasonable possibility, since there’s little resistance in view until we arrive at 1.4732: the 2016 yearly opening level.
Potential trading zones:
Although it may be tempting to buy this market based on weekly technicals, the market’s landscape is somewhat cluttered on both H4 and daily timeframes.
The flipside to this, of course, is attempting to fade 1.43 knowing it has the backing of a daily resistance area. If you’re comfortable with the threat of further buying on the weekly timeframe, then this could be an option, targeting the 1.42 handle as the initial take-profit zone.
Data points to consider: UK construction PMI at 9.30am; US job’s figures at 1.30pm; US revised UoM consumer sentiment at 3pm; FOMC member Williams speaks at 7.30pm GMT.
Areas worthy of attention:
Supports: 1.4079; 1.42 handle.
Resistances: 1.4393-1.4297; 1.4732; 1.43 handle.
AUD/USD:
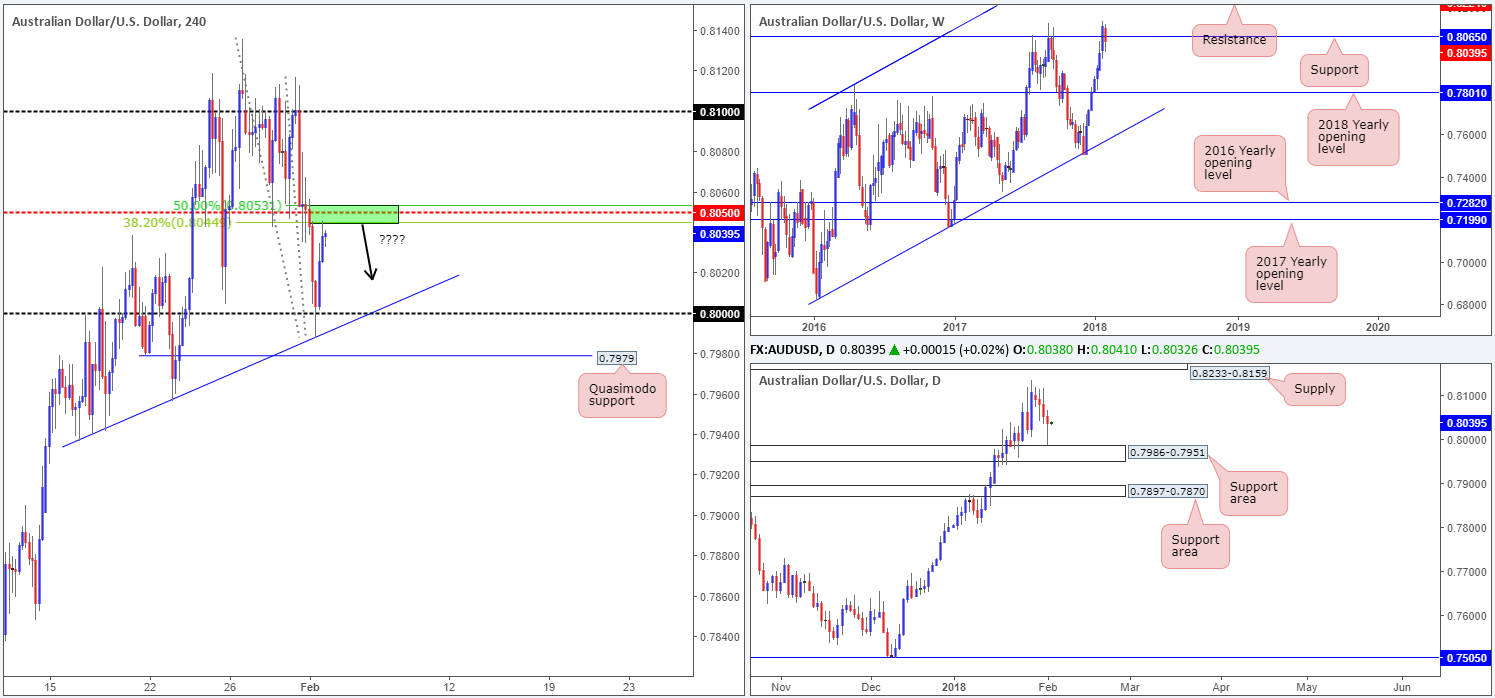
The AUD/USD, as you can see, extended its losing streak on Thursday, but did, with the help of a nearby daily support area at 0.7986-0.7951, manage to recover the majority of the day’s losses from the large psychological band seen on the H4 timeframe at 0.80.
Latest trading has positioned weekly price beneath weekly support at 0.8065, and placed the H4 candles around a H4 38.2% Fib resistance level at 0.8044 (seen a few pips ahead of the H4 mid-level resistance line at 0.8050/50.% Fib resistance at 0.8053).
Potential trading zones:
One could look to fade the green H4 zone today, given weekly sellers were able to muster enough strength to drive beneath weekly support. This is not a high-probability trade, though, in our opinion, given the current uptrend, so waiting for additional candle confirmation might be an idea (full or near-full-bodied H4 bear candle).
Data points to consider: US job’s figures at 1.30pm; US revised UoM consumer sentiment at 3pm; FOMC member Williams speaks at 7.30pm GMT.
Areas worthy of attention:
Supports: 0.80 handle; 0.7986-0.7951.
Resistances: 0.8050; 0.8044; 0.8053.
USD/JPY:
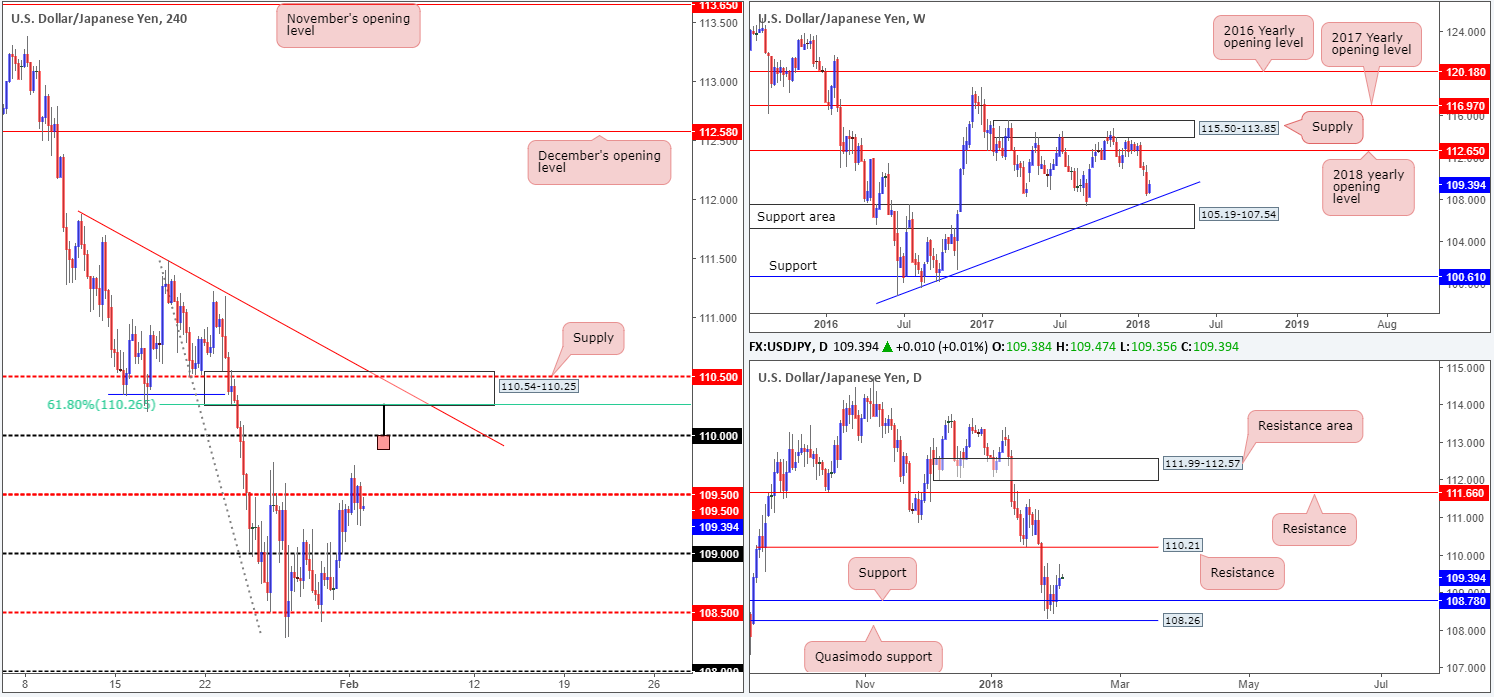
As can be seen from the H4 timeframe this morning, the USD/JPY market spent the majority of the day meandering back and forth around the H4 mid-level resistance line at 109.50. In view of this somewhat lackluster performance, much of the following report will echo thoughts put forward in Thursday’s analysis.
Turning the focus over to the daily timeframe, daily price extended gains yesterday after daily resistance at 108.78 (now acting support) was engulfed during Wednesday’s movement in reasonably strong fashion. By and of itself, this could spark another round of buying, since upside is relatively free until we shake hands with daily resistance printed at 110.21.
Weekly action, on the other hand, shows us that the USD/JPY still has some wiggle room to probe as low as a weekly trendline support taken from the low 98.78, followed closely by a weekly support area at 105.19-107.54.
Potential trading zones:
As of current prices, buying is not something we would label high probability. In fact, even with a H4 close above 109.50, we would still not consider buying to be valid, given the threat of additional selling on the weekly timeframe at the moment.
An area we do still have an eyeball on, however, is the H4 supply zone coming in at 110.54-110.25, as it is positioned nearby the aforesaid daily resistance and merges with a H4 mid-level resistance at 110.50, as well as a H4 trendline resistance taken from the high 111.87 and a H4 61.8% Fib resistance at 110.26.
An ideal sell signal, in our view, would be a H4 selling wick that penetrates through 110 and connects with the underside of the above noted H4 supply (see H4 chart). That way stop-loss orders above 110 would be filled and therefore provide liquidity to those wishing to sell from the H4 supply. One could look jump aboard following the close of the candle, with stops either placed above the candle’s wick or above the H4 supply itself. The first target objective from here can be set at 109.50.
Data points to consider: US job’s figures at 1.30pm; US revised UoM consumer sentiment at 3pm; FOMC member Williams speaks at 7.30pm GMT.
Areas worthy of attention:
Supports: 109 handle; 108.78; Weekly trendline support; 105.19-107.54.
Resistances: 109.50; 110 handle; 110.54-110.25; 110.50; H4 trendline resistance; 110.26; 110.21.
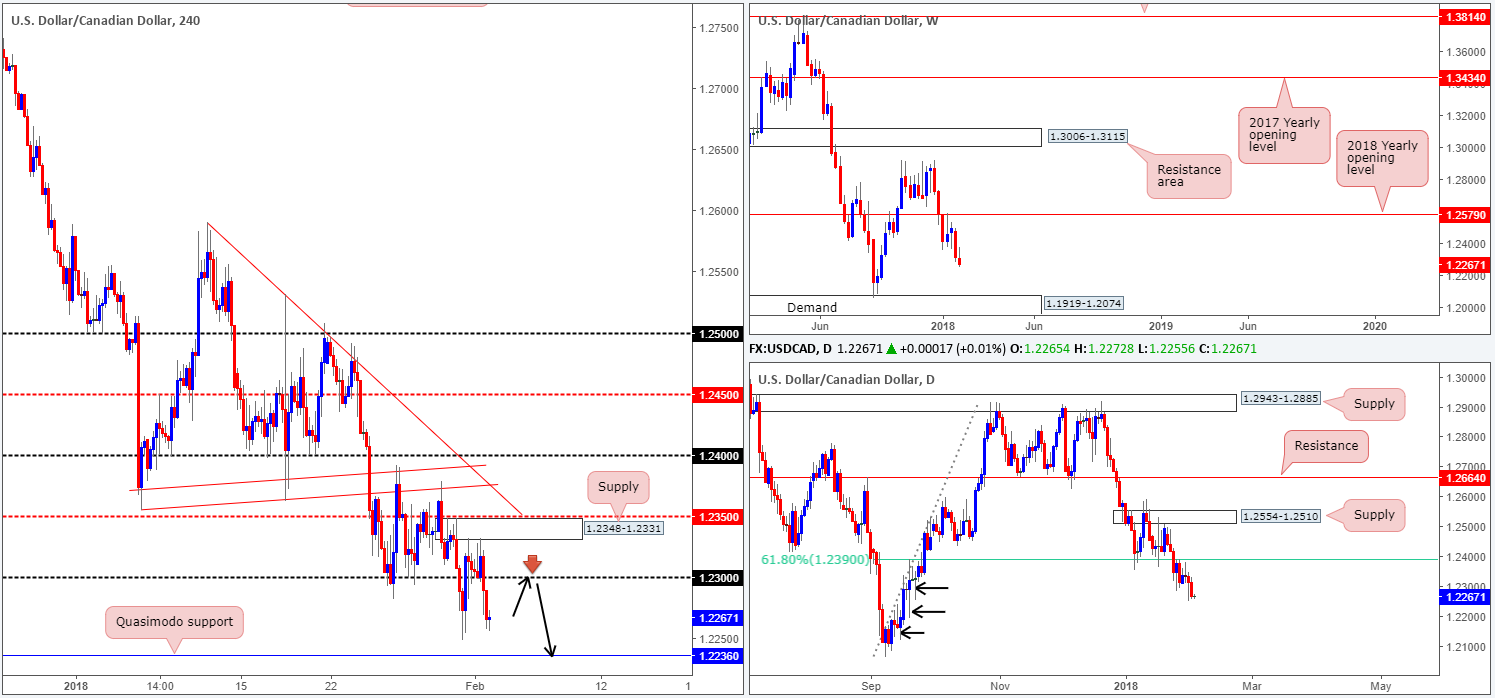
USD/CAD:
In recent trading, we saw the H4 supply area at 1.2348-1.2331 elbow its way into the spotlight. Selling from this zone was enough to overwhelm buyers around the 1.23 handle, and bring the unit to lows of 1.2257. To the downside, the next area on the radar is a H4 Quasimodo support at 1.2236.
Turning the focus over to the weekly timeframe, downside appears relatively free. With little weekly support in sight until we reach the weekly demand base at 1.1919-1.2074, further selling in the coming weeks is a real possibility. Daily price, as you can see, remains FIRMLY below 1.2390: a daily 61.8% Fib support-turned resistance. Below 1.2390 there’s little support worthy of mention, in our opinion. Note the clear daily buying tails marked with black arrows at 1.2253, 1.2194 and 1.2118. These, to us, resemble consumption of unfilled buy orders.
Potential trading zones:
Our bias, at least medium/long term, remains short. This is largely because of where price is located on the bigger picture. Therefore, a retest seen to the underside of 1.23 today that holds firm and prints a reasonably sound H4 rotation candle, is, in our technical view, enough to consider a short, targeting the noted H4 Quasimodo support as an initial take-profit zone (see black arrows).
Data points to consider: US job’s figures at 1.30pm; US revised UoM consumer sentiment at 3pm; FOMC member Williams speaks at 7.30pm GMT.
Areas worthy of attention:
Supports: 1.2236; 1.1919-1.2074.
Resistances: 1.23 handle; 1.2348-1.2331; 1.2390.
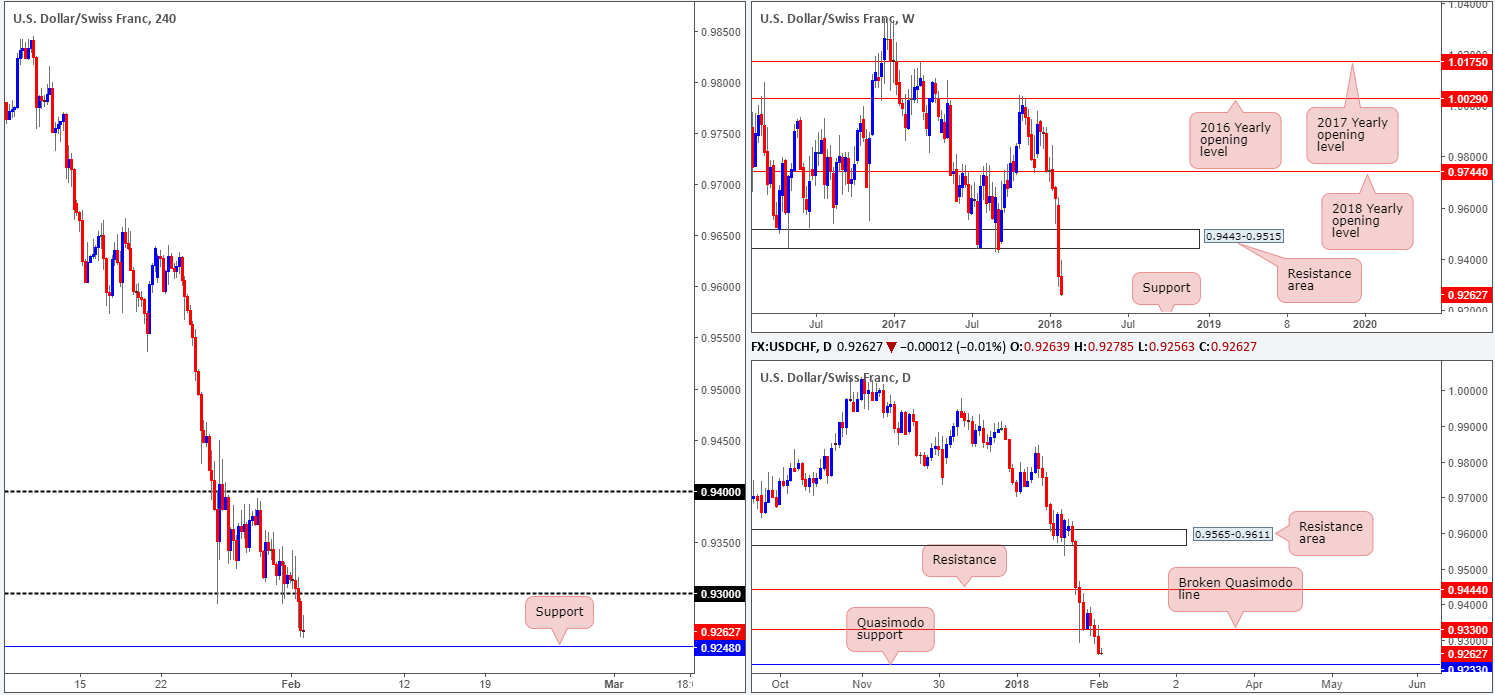
USD/CHF:
As can be seen on the weekly timeframe this morning, the weekly candles are in free fall right now! After cranking its way through a weekly support area at 0.9443-0.9515 last week (now acting resistance zone), the path south appears relatively free as far down as the weekly support level coming in at 0.9163 (not seen on the screen).
Sliding down to the daily structure, we can see that yesterday’s bout of selling helped position daily price within striking distance of a daily Quasimodo support at 0.9233. Before price reaches this line, nevertheless, support on the H4 timeframe seen at 0.9248 will need to be engulfed.
Potential trading zones:
Overall, we remain biased to the downside in this market.
With that being the case, we would not consider a long from either the current H4 support or daily Quasimodo line as valid buy zones at this time. Downside pressure is just too strong!
Should the buyers make a play before connecting with H4/daily structure, however, and manage to retest the recently broken 0.93 handle as resistance, a short from here could be something to consider. To avoid any fakeout that may take place around this number (common act), you might want to consider waiting for a full or near-full-bodied H4 bearish candle to take shape, before pulling the trigger. The first take-profit angle from this point would be H4 support mentioned above at 0.9248.
Data points to consider: US job’s figures at 1.30pm; US revised UoM consumer sentiment at 3pm; FOMC member Williams speaks at 7.30pm GMT.
Areas worthy of attention:
Supports: 0.9233; 0.9248; 0.9163.
Resistances: 0.93 handle; 0.9443-0.9515.
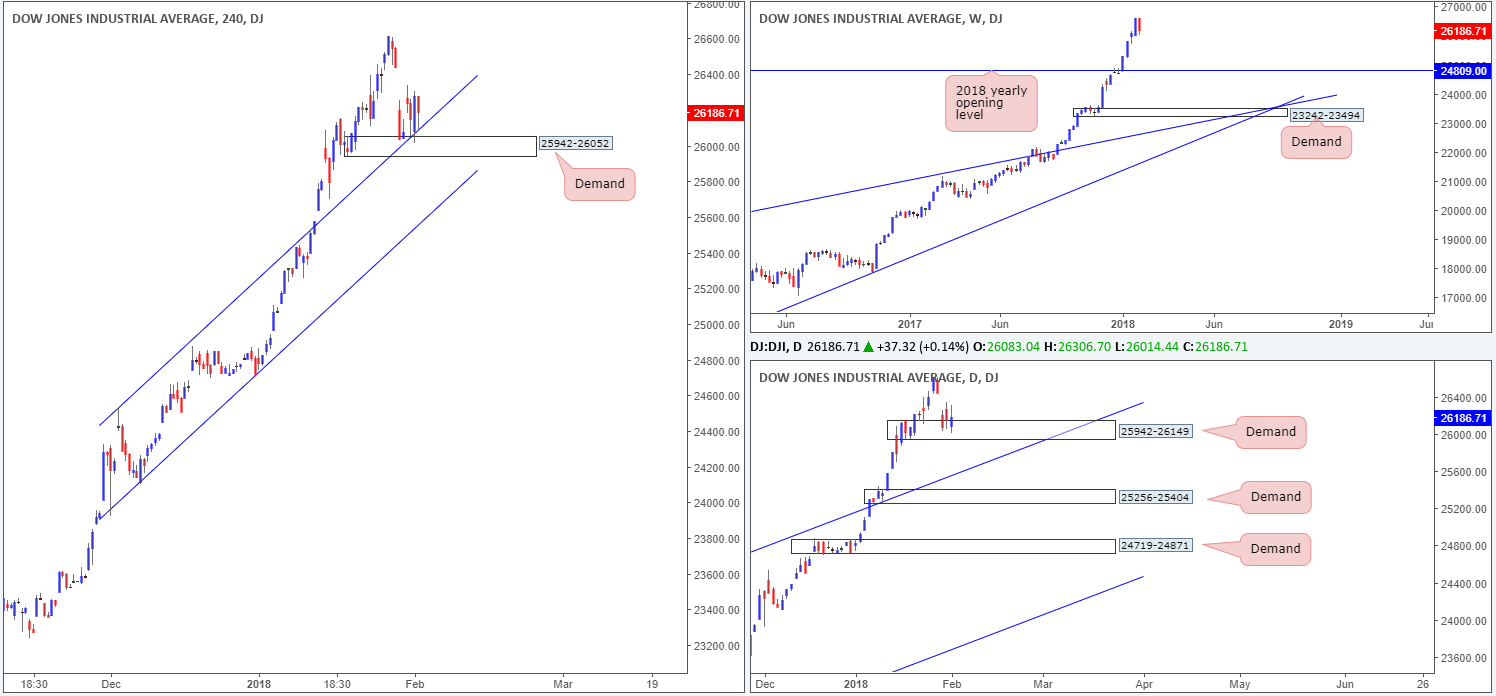
DOW 30:
It was a somewhat mixed day for US equity indexes on Thursday.
The Dow Jones Industrial Average managed to chalk up a marginal gain, up 0.14%.
H4 demand at 25942-26052, along with its converging H4 channel resistance-turned support taken from the high 24535, remains intact as H4 price continues to utilize the top edge of this base as support.
Also worth remembering here is that these H4 barriers are seen positioned within the lower limits of daily demand at 25942-26149. While H4 bulls have yet to register anything noteworthy from this area, we believe it is only a matter of time until we see the buyers make an appearance.
Potential trading zones:
Given the current position of price, a rotation to the upside is still very likely to take place. Stop-loss orders would be best positioned beneath the current H4 demand area. Ultimately, a healthy bid from current price would fill Tuesday’s gap and possibly push on to fresh record highs.
Data points to consider: US job’s figures at 1.30pm; US revised UoM consumer sentiment at 3pm; FOMC member Williams speaks at 7.30pm GMT.
Areas worthy of attention:
Supports: 25942-26052; H4 channel support; 25942-26149.
Resistances: …
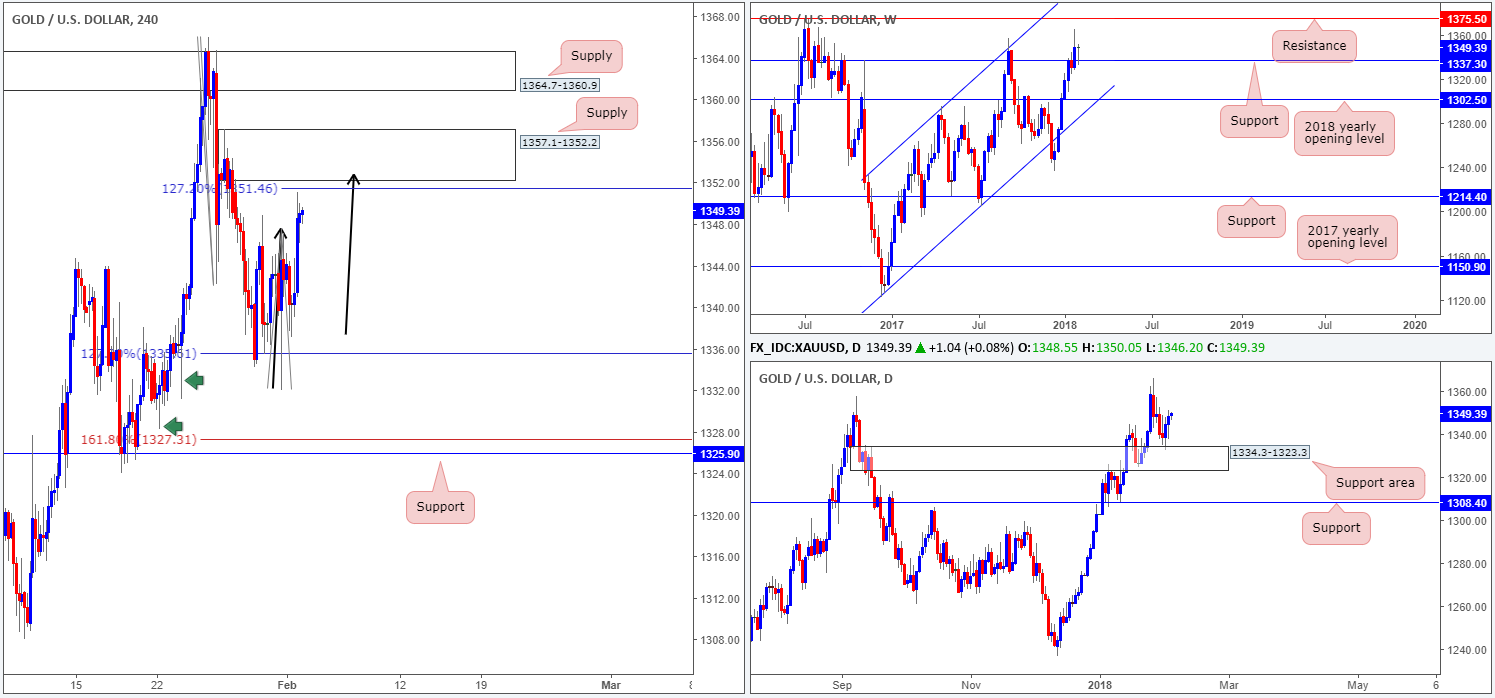
GOLD:
The yellow metal is, as you can see on the weekly timeframe, currently standing tall on a weekly support barrier coming in at 1337.3. Continued bidding from this point has the weekly resistance at 1375.5 to target.
Bolstering the current weekly support level is a daily support area seen at 1334.3-1323.3, which has held ground for two consecutive trading days thus far.
In a similar fashion to the EUR/USD, a correlated market with the XAU/USD, the H4 candles have begun basing just ahead of a H4 AB=CD 127.2% Fib ext. point at 1351.4/H4 supply base at 1357.1-1352.2. Together, these two H4 structures form robust confluence, in our book. However, selling from here is precarious given that both weekly and daily price currently exhibit bullish intentions (see above).
Potential trading zones:
Although the H4 AB=CD formation and nearby H4 supply area are tempting zones to short, weekly buying pressure may impede downside from here. Therefore, should you trade the H4 zones short, active trade management is needed – be prepared to close the trade out if bulls show signs of activity.
Areas worthy of attention:
Supports: 1337.3; 1334.3-1323.3.
Resistances: 1357.1-1352.2.
This site has been designed for informational and educational purposes only and does not constitute an offer to sell nor a solicitation of an offer to buy any products which may be referenced upon the site. The services and information provided through this site are for personal, non-commercial, educational use and display. IC Markets does not provide personal trading advice through this site and does not represent that the products or services discussed are suitable for any trader. Traders are advised not to rely on any information contained in the site in the process of making a fully informed decision.
This site may include market analysis. All ideas, opinions, and/or forecasts, expressed or implied herein, information, charts or examples contained in the lessons, are for informational and educational purposes only and should not be construed as a recommendation to invest, trade, and/or speculate in the markets. Any trades, and/or speculations made in light of the ideas, opinions, and/or forecasts, expressed or implied herein, are committed at your own risk, financial or otherwise.
The use of the site is agreement that the site is for informational and educational purposes only and does not constitute advice in any form in the furtherance of any trade or trading decisions.
The accuracy, completeness and timeliness of the information contained on this site cannot be guaranteed. IC Markets does not warranty, guarantee or make any representations, or assume any liability with regard to financial results based on the use of the information in the site.
News, views, opinions, recommendations and other information obtained from sources outside of www.icmarkets.com.au, used in this site are believed to be reliable, but we cannot guarantee their accuracy or completeness. All such information is subject to change at any time without notice. IC Markets assumes no responsibility for the content of any linked site. The fact that such links may exist does not indicate approval or endorsement of any material contained on any linked site.
IC Markets is not liable for any harm caused by the transmission, through accessing the services or information on this site, of a computer virus, or other computer code or programming device that might be used to access, delete, damage, disable, disrupt or otherwise impede in any manner, the operation of the site or of any user’s software, hardware, data or property.


