EUR/USD:
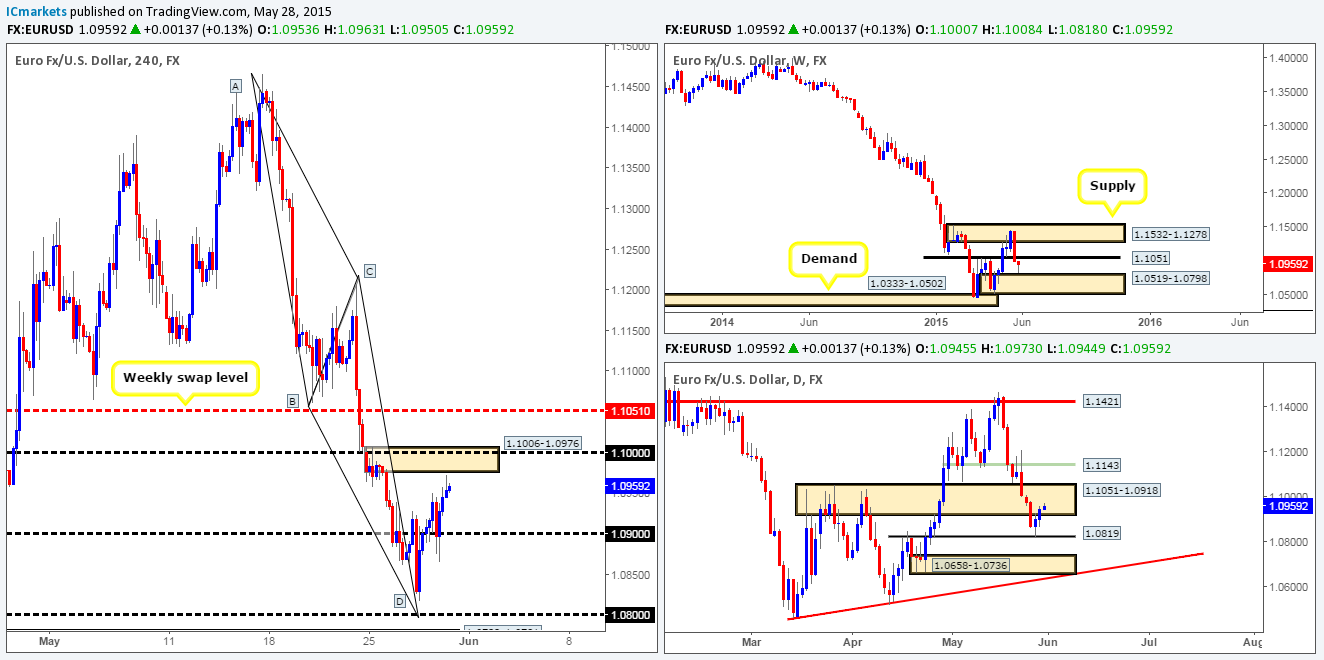
Weekly view: The weekly timeframe shows us that relatively strong buying interest came into the market twenty or so pips from above a weekly demand area seen at 1.0519-1.0798. If the buyers remain in control here, we might see price shake hands with a weekly swap level coming in at 1.1051.
Daily view: From the daily scale, we can see that the rebound from the daily swap level 1.0819 extended higher during yesterday’s session, consequently driving the Euro pair deeper into a daily swap zone positioned at 1.1051-1.0918.
4hr view: The 4hr timeframe reveals that price broke above and retested 1.0900 during the course of yesterday’s sessions. The retest was confirmed with two healthy buying tails seen at 1.0875 and 1.0865, which as you can see pushed this pair up to just below a 4hr supply area seen at 1.1006-1.0976.
This area of 4hr supply is quite significant in our opinion, since it is where pro money likely made the decision to initially push below the daily swap area 1.1051-1.0918. Does this mean a reaction will likely be seen from here? We definitely believe it is possible. How much of a reaction though is very difficult to judge at this point. The reason we say this is simply because only 50 or so pips above this barrier sits a weekly swap level at 1.1051.
There are two ways in which we can handle this situation, well three if you include not trading. The first is watching how price reacts once/if it enters the limits of the 4hr supply area, if the you see resistance holding firm on the lower timeframes, it could be worth shorting this market. The second is to wait for this area to be broken, and enter short at the 1.1051 region. It will be trader dependent whether he/she waits for lower timeframe confirmation here or simply sets a pending sell order. We favor the former though since you never really know how strong a level is, or how deep a fakeout will be.
Levels to watch/live orders:
- Buys: Flat (Predicative stop-loss orders seen at: N/A).
- Sells: 1.0006-1.0976 [Tentative – confirmation required] (Predicative stop-loss orders seen at: 1.1012) 1.1051 [Tentative – confirmation required] (Predicative stop-loss orders seen at: dependent on where one confirms this level).
GBP/USD:
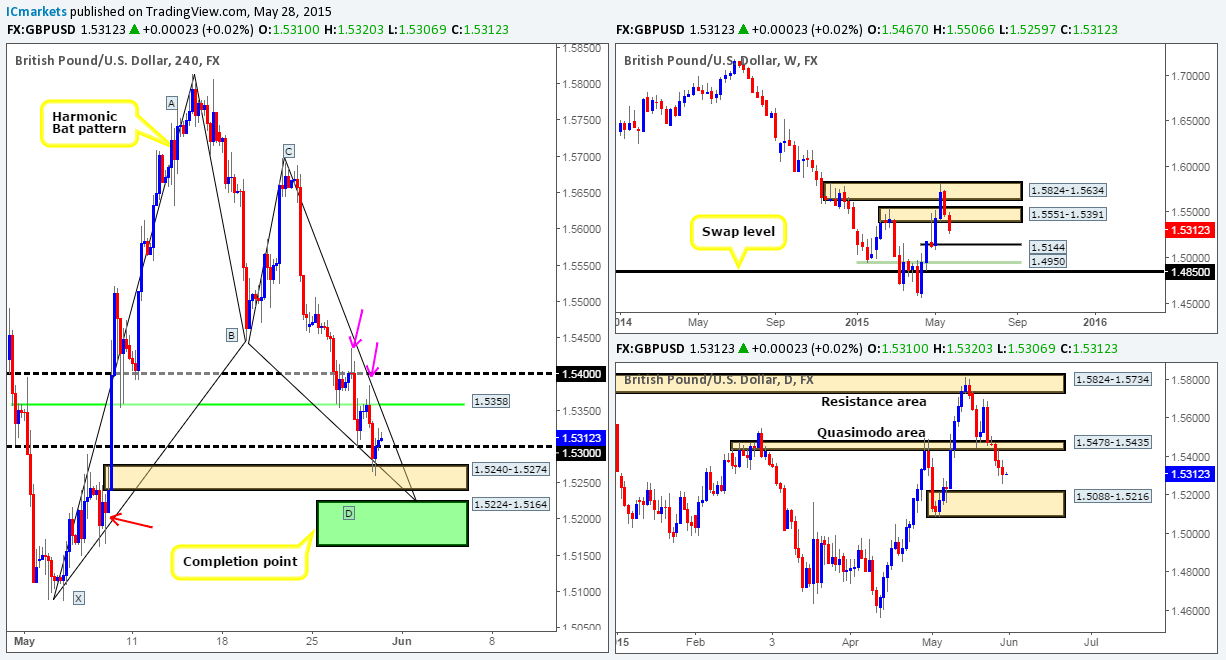
Weekly view: The weekly timeframe shows that price recently pushed below a weekly swap area coming in at 1.5551-1.5391. This has potentially opened the gates for further selling down to 1.5144 – a recent level where serious weekly buyers came into the market.
Daily view: Following the retest of the recently broken daily Quasimodo area at 1.5478-1.5435, price has continued to weaken. Providing that the sellers remain strong here, we see very little reason why price will not cross swords with the daily demand zone seen just below at 1.5088-1.5216 (surrounds the weekly buy level 1.5144).
4hr view: Throughout the course of yesterday’s sessions, the GBP/USD aggressively sold off from 1.5358. This move, as you can see took out the 1.5300 level and attacked a small, yet clearly resilient 4hr demand area coming in at 1.5240-1.5274.
Although this 4hr demand zone is holding the firm at the moment, we believe this will be a short-lived rally for the following reasons:
- Both the weekly and daily timeframes show there is still room to move south until we hit demand (see above).
- There is a 4hr Harmonic Bat completion area seen in green just below at 1.5224-1.5164 (located around the upper limits of the aforementioned daily demand area) that is just begging to see some action. This Harmonic zone not only lines up with the round number 1.5200, but also converges just beautifully with 4hr demand seen marked with a red arrow at 1.5162-1.5191.
- And finally, take a note of the symmetry we’ve seen on this pair recently – a clear three-drive approach appears to be forming (the first two drives are seen marked with pink arrows at 1.5436/1.5384).
All we need to see now is a sell off similar to the first and second drives (completing the three-drive pattern), and price will likely tag the upper limit of our 4hr Harmonic reversal zone, where at which point our team will enter long with a relatively heavy position at 1.5228.
Levels to watch/ live orders:
- Buys: 1.5228 (Predicative stop-loss orders seen at: 1.5140).
- Sells: Flat (Predicative stop-loss orders seen at: N/A).
AUD/USD:
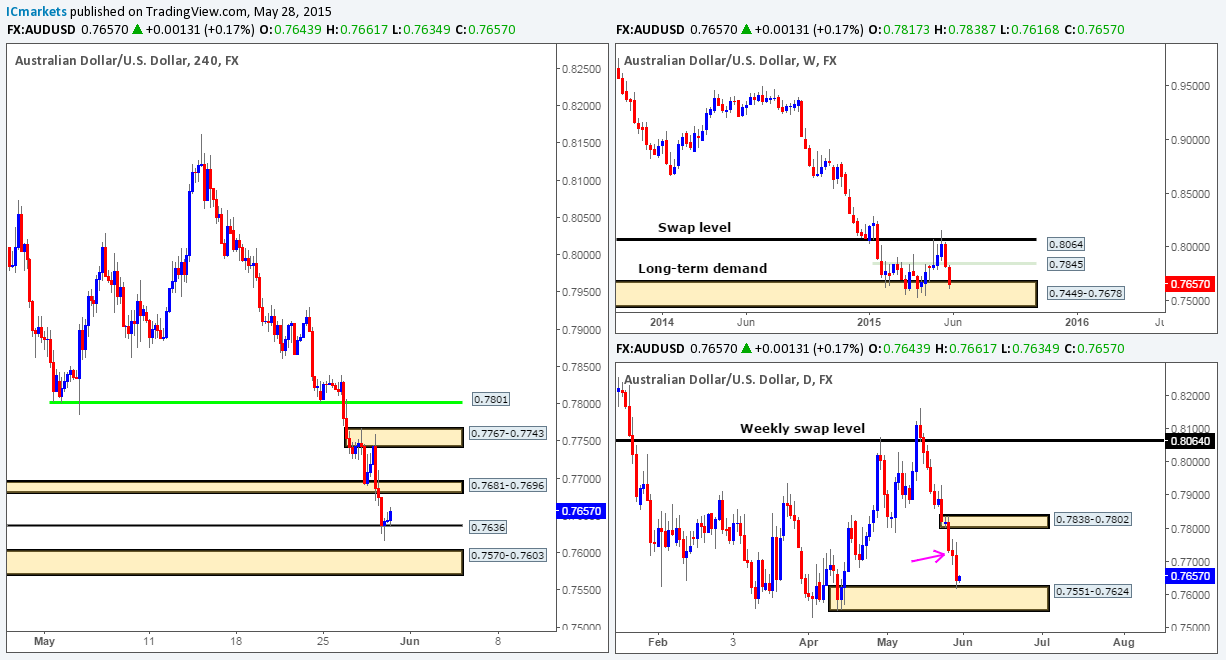
Weekly view: The weekly timeframe shows the Aussie pair has now entered the jaws of a long-term daily demand area seen at 0.7449-0.7678. Judging by the previous reaction seen a few months earlier at this zone, things could once again get messy here.
Daily view: From the pits of the daily scale, we can see that price has touched base with a relatively strong looking daily demand zone at 0.7551-0.7624. Assuming that buying interest comes into the market here, areas to keep an eye on for downward pressure come in at 0.7767-0.7734 (pink arrow), and the small daily supply area sitting just above it at 0.7838-0.7802.
4hr view: During the course of yesterday’s sessions, price heavily sold off from the small 4hr supply area seen at 0.7767-0.7743, which only really saw any interest from the buy side once the market reached a small 4hr swap level coming in at 0.7636. Although this number is holding relatively well at the moment, we would have no intention of buying from here. The reason being is simply because just below this hurdle lurks a beautiful 4hr demand area at 0.7570-0.7603. Why this area and not this 4hr swap level? Well simply put, we tend to look for areas located deep within higher timeframe zones rather than on the limits (this 4hr demand area, as you may already see, is positioned deep within the aforementioned daily demand zone), since from our experience they have the higher probability of seeing a decent move. In addition to this, however, this 4hr demand zone lines up beautifully with the psychological threshold 0.7600, and if you scroll back to the 15/04/15 where the 4hr demand zone formed, you’ll likely notice how strong the momentum from this area was! It was incredibly violent, indicating there may still be unfilled buy orders remaining with this zone.
Therefore, with all the above taken into consideration, we have placed a pending buy order at 0.7605, with a stop set just below at 0.7565.
Levels to watch/ live orders:
- Buys: 0.7605 (Predicative stop-loss orders seen at: 0.7565).
- Sells: Flat (Predicative stop-loss orders seen at: N/A).
USD/JPY:
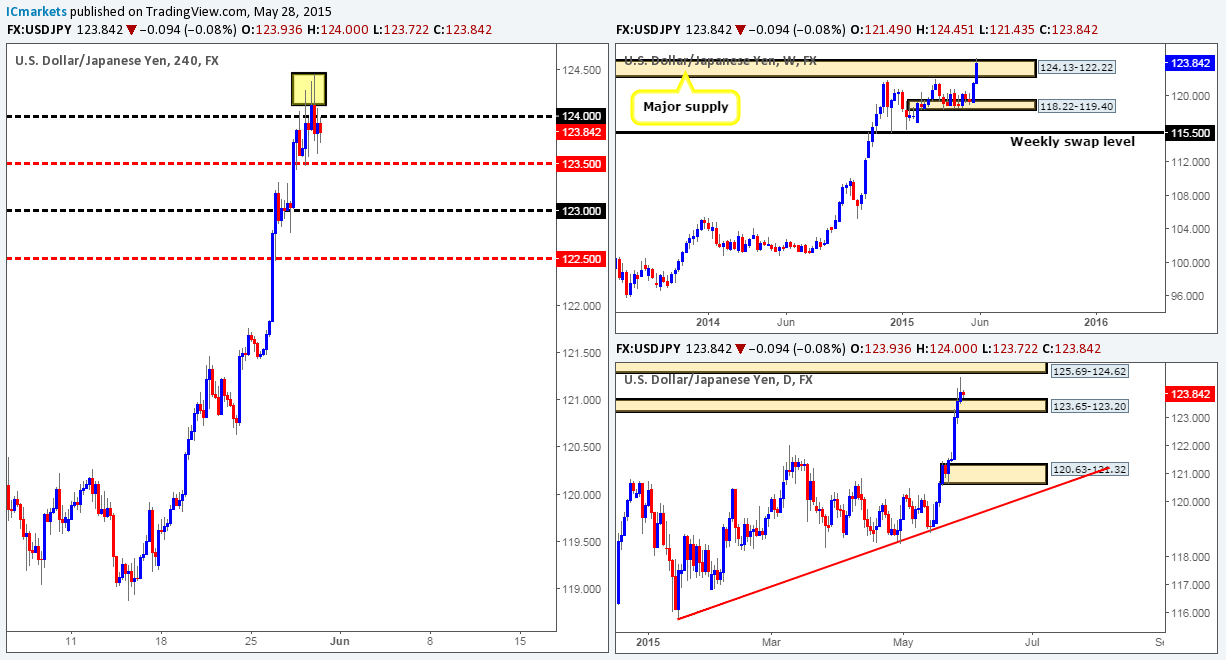
Weekly view: The recent surge in prices this week has, as you can probably see, pierced above a major weekly supply area coming in at 124.13-122.22. The question we now need answering is, was this a fakeout or simply a continuation move?
Daily view: From this viewpoint, we can see that the recent break above the weekly supply area saw price come within touching distance of hitting a daily resistance area at 125.69-124.62. For us to be convinced the spike above the weekly supply zone was a fakeout to go lower, we would need to see the recently broken daily supply (now demand) area at 123.65-123.20 taken out. If this level holds firm, however, this may suggest the USD/JPY is heading higher next week.
4hr view: Thursday’s sessions show that price attempted to trade above 124.00 but failed – check out the very obvious selling tails seen within the yellow box (124.13/124.45) just above this number. Current action also shows that price is now respecting 124.00 as resistance at the moment. If this level continues to hold into the more liquid sessions today, we could possibly see this pair sell off back down to challenge 123.50 today.
At this point in time, we personally believe this is a risky pair to trade. On the one hand, a group of traders may say to buy, but by doing so, you could potentially be buying into seriously strong sellers from weekly supply at 124.13-122.22, and also round number resistance 124.00. On the other hand, another group may say sell – by shorting, however, you run the risk of selling into possible buying pressure from the daily swap area 123.65-123.20. Therefore, opting to stand on the side lines may very well be the best position to take in this market.
Levels to watch/ live orders:
- Buys: Flat (Predicative stop-loss orders seen at: N/A).
- Sells: Flat (Predicative stop-loss orders seen at: N/A).
USD/CAD:
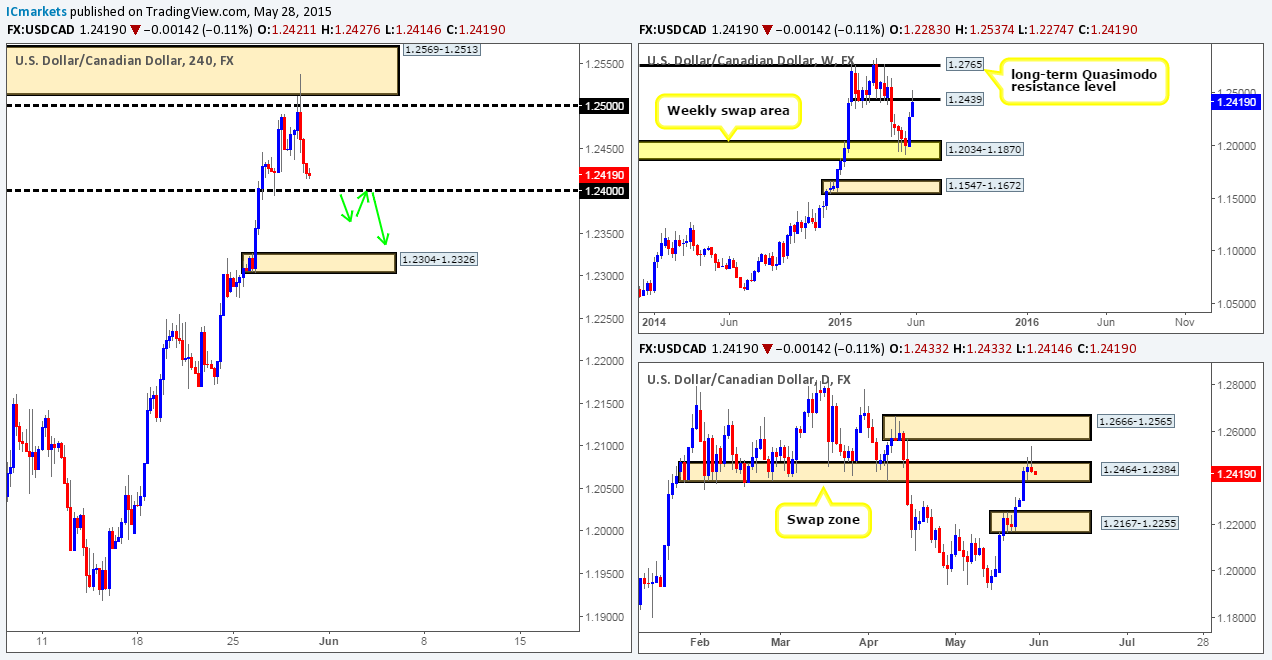
Weekly view: Last week’s rebound from the weekly swap area at 1.2034-1.1870 has so far seen the market extend further north, which as a result has forced price to punch into a weekly swap level seen at 1.2439.
Daily view: The daily timeframe shows that a bearish pin-bar candle was printed during the course of yesterday’s session around a daily swap area coming in at 1.2464-1.2384.
4hr view: For those of you who read our previous report on this pair, you may recall us mentioning that we set a pending sell order just below 4hr supply (1.2569-1.2513) at 1.2509 yesterday. As you can see, our order has now been filled and the position is sitting nicely in the green.
That being the case, all eyes are now on the psychological hurdle 1.2400 at the moment. Ultimately, we would like to see this number consumed today; as this would give us the confidence to move our stop to breakeven, and leave the position live over the weekend. In addition, a break below this number would also likely clear the path south down towards 4hr demand at 1.2304-1.2326, which is where we intend to liquidate our full position. 1.2400 could also be an ideal place to enter short if you missed the first entry at 1.2509 – that said though, we would only enter short if price retested this level as resistance (as per the green arrows) and showed some form of lower timeframe selling signal.
Levels to watch/ live orders:
- Buys: Flat (Predicative stop-loss orders seen at: N/A).
- Sells: 1.2509 [Live] (Predicative stop-loss orders seen at: 1.2574).
USD/CHF:
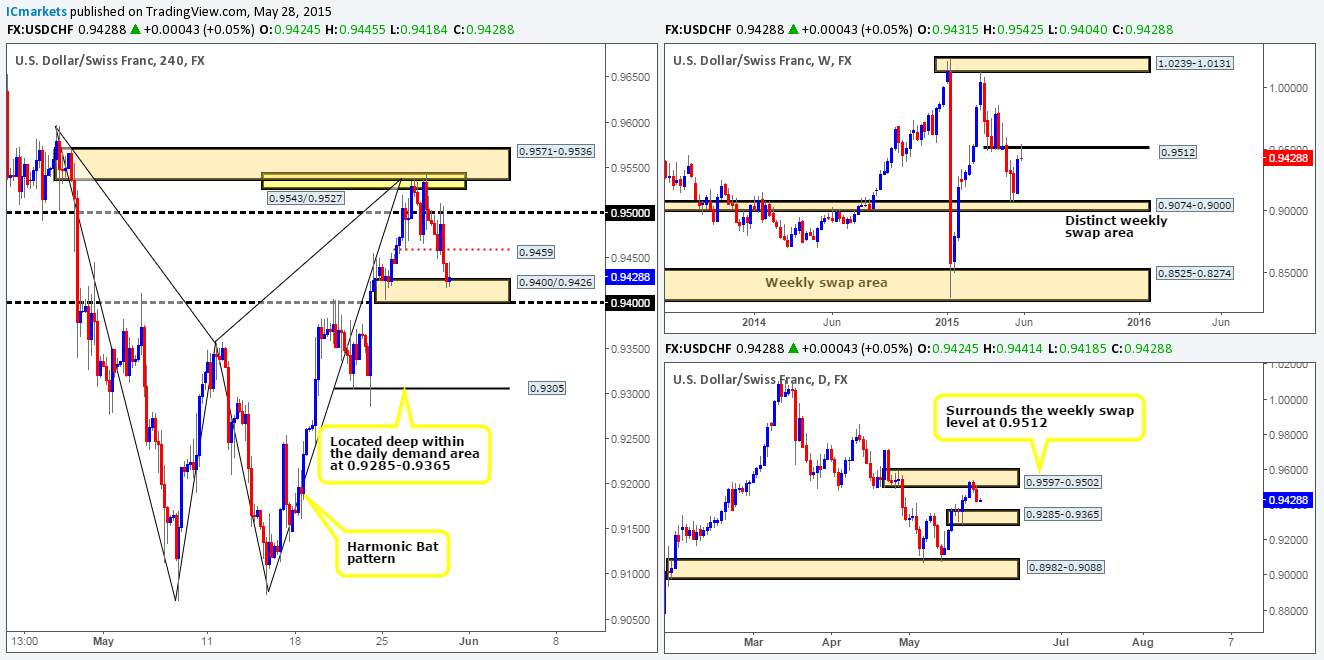
Weekly view: From this angle, we can see that price is currently respecting the weekly swap level 0.9512 as market resistance.
Daily view: On the daily timeframe, price recently sold off from a daily supply area coming in at 0.9597-0.9502 (encapsulates the aforementioned weekly swap level). Assuming that the sellers remain strong today, we could potentially see a continuation move into the jaws of the daily demand area at 0.9285-0.9365.
4hr view: During the course of yesterday’s sessions, price retested 0.9500 for a second time, causing this pair to aggressively sell off down towards a small 4hr buy area at 0.9400/0.9426.
Taking into consideration the higher timeframe structure (see above), we are not holding out much hope for aforementioned 4hr buy area. In fact, the most we see price rallying from here is up to the 0.9459 mark. Therefore, once, or indeed if In this 4hr buy zone is taken out today, the river south should be ripple free down to the 4hr Quasimodo support level 0.9305 (located deep within the aforementioned daily demand area). That being the case, should price retest this 4hr buy area as supply, and show supporting lower timeframe strength, we’ll very likely enter short, targeting 0.9320.
Levels to watch/ live orders:
- Buys: Flat (Predicative stop-loss orders seen at: N/A).
- Sells: Flat (Predicative stop-loss orders seen at: N/A).
US 30:
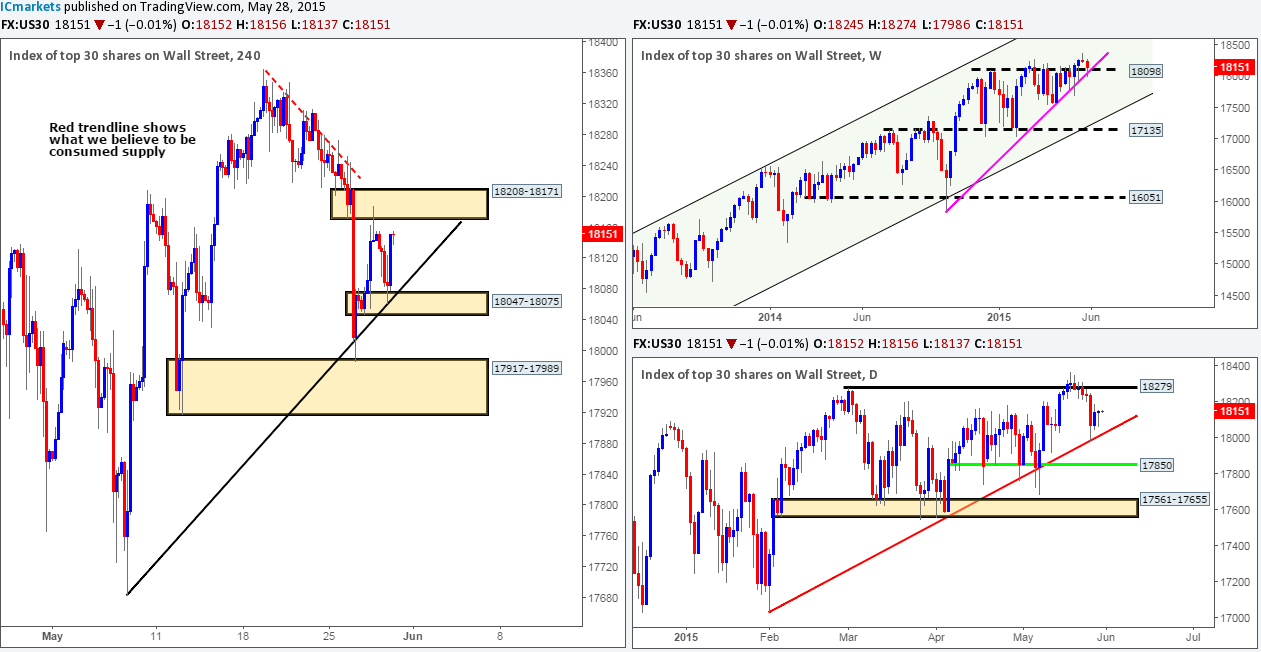
Weekly view: The weekly timeframe shows that price is currently respecting the 18098 barrier as support, which also converges just beautifully with the weekly trendline extended from the low 15849.
Daily view: Following Tuesday’s rebound off of the daily trendline support taken from the low 17033, price has shown an increase in value, but nothing to really get excited about at this point.
4hr view: In the thick of yesterday’s sessions, price sold off from the 4hr supply area seen at 18208-18171. Consequent to this, we saw price hit and rebound from a 4hr demand area at 18047-18075, which boasts additional support from a 4hr trendline extended from the low 17683.
Considering the market’s overall position on the higher timeframes (see above) at the moment, our team is naturally favoring a move higher. However, under the current circumstances, entering long on this index may not be such a good idea until a clean break above the aforementioned 4hr supply area is seen. Above this supply, however, is nothing but consumed sellers as far as we can see. The wicks you see poking above the red trendline was likely the work of pro money spiking north to fill any unfilled sell orders to continue shorting this market, thus once/if price reaches this area, the market should slice through this congested zone like a hot knife through butter.
So, what we’re ideally looking for today is a break above and retest of the 4hr supply zone. This will be our cue to begin zooming down to the lower timeframes and check to see if we have corresponding lower timeframe confirming price action. If so, we are going to enter long and target at least 18340.
Levels to watch/ live orders:
- Buys: Flat (Predicative stop-loss orders seen at: N/A).
- Sells: Flat (Predicative stop-loss orders seen at: N/A).
XAU/USD (Gold)
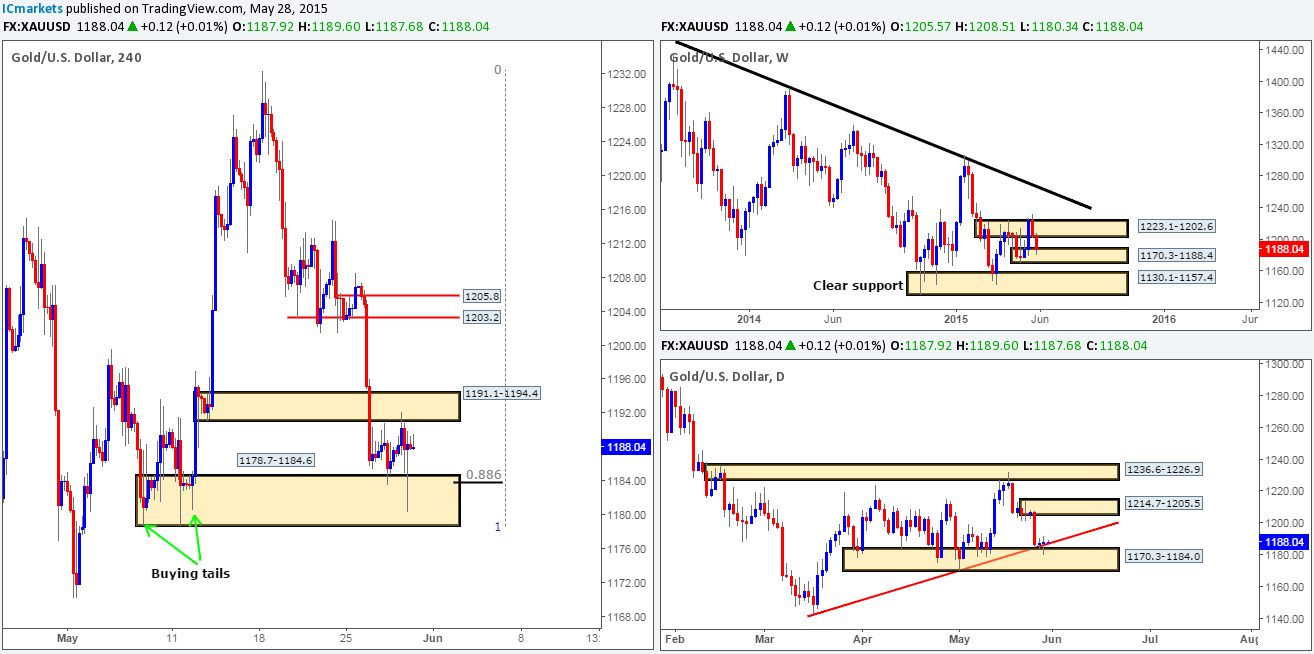
Weekly view: Following last week’s fakeout above the weekly supply area seen at 1223.1-1202.6, the gold market has so far continued to sell off, consequently driving head first into a small weekly demand area at 1170.3-1188.4.
Daily view: The daily timeframe shows that price is currently tackling the top side of a daily buy area at 1170.3-1184.0, which, as you can see also converges nicely with a daily trendline taken from the low 1142.5.
4hr view: The current situation on the 4hr timeframe reveals that gold has now entered into a phase of consolidation between the 4hr buy zone coming in at 1178.7-1184.6 (located just within the daily buy area at 1170.3-1184.0) and a 4hr demand area (now supply) at 1191.1-1194.4. Essentially, what we’re looking for price to do is break above this current range area (since let’s not forget that price is located around demand on both the weekly and daily timeframes).This move would, in effect, be our cue to begin watching for price to retest this area as demand. Should this occur, we’d then look for lower timeframe price action to reinforce our higher timeframe expectation before risking capital on this idea.
However, in the event that price remains range bound today, we’re going to be keeping a close eye on how price behaves around its limits. In the event that we see lower timeframe buying/selling strength come into the market, we may consider a small intraday trade depending on the time of day.
Levels to watch/ live orders:
- Buys: 1178.7-1184.6 [Tentative – confirmation required] (Predicative stop-loss orders seen at: 1178.1).
- Sells: 1191.1-1194.4 [Tentative – confirmation required] (Predicative stop-loss orders seen at: 1195.1).


