A note on lower timeframe confirming price action…
Waiting for lower timeframe confirmation is our main tool to confirm strength within higher timeframe zones, and has really been the key to our trading success. It takes a little time to understand the subtle nuances, however, as each trade is never the same, but once you master the rhythm so to speak, you will be saved from countless unnecessary losing trades. The following is a list of what we look for:
- A break/retest of supply or demand dependent on which way you’re trading.
- A trendline break/retest.
- Buying/selling tails/wicks – essentially we look for a cluster of very obvious spikes off of lower timeframe support and resistance levels within the higher timeframe zone.
- Candlestick patterns. We tend to stick with pin bars and engulfing bars as these have proven to be the most effective.
We search for lower timeframe confirmation between the M15 and H1 timeframes, since most of our higher-timeframe areas begin with the H4. Stops are usually placed 5-10 pips beyond confirming structures.
EUR/USD:
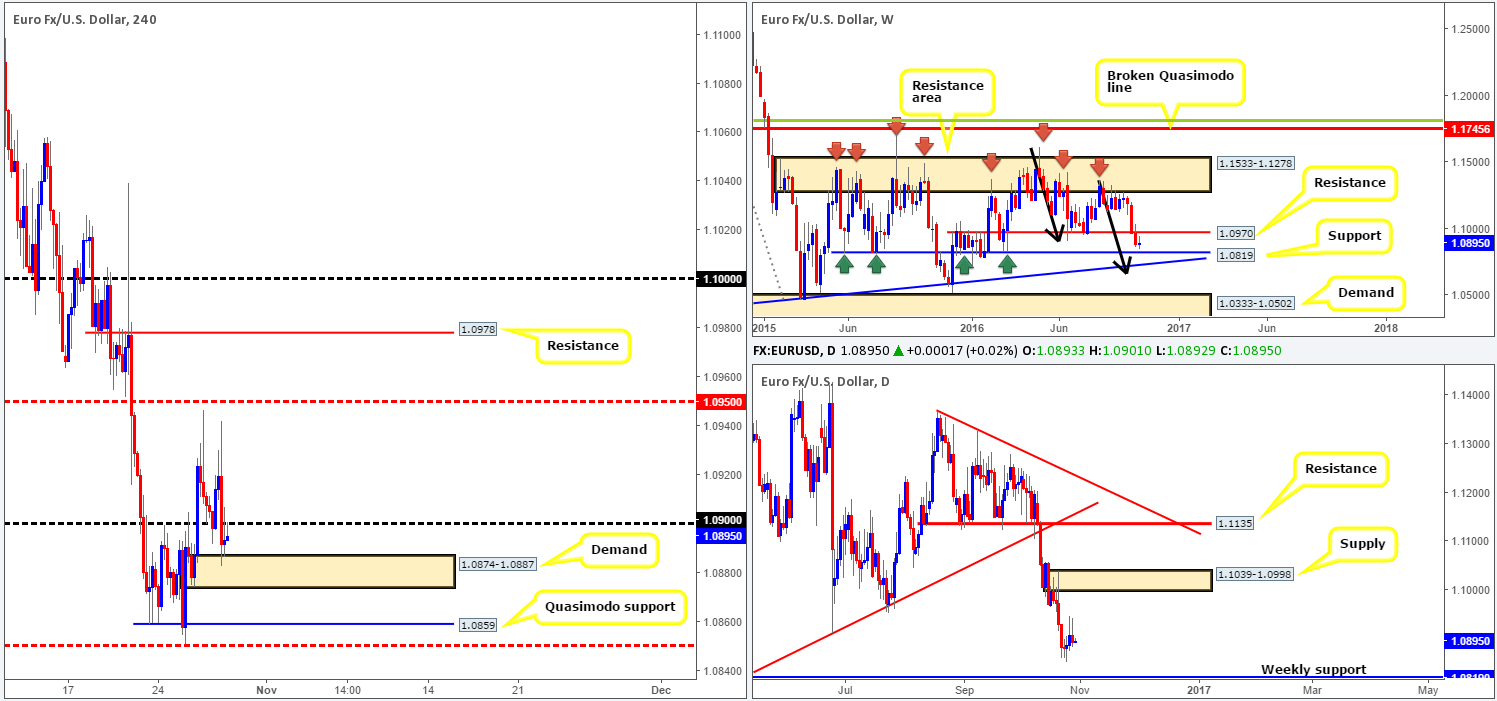
During the course of yesterday’s sessions, the shared currency caught a fresh bid from the 1.09 handle and managed to clock highs of 1.0942. It was here, the US open, that we saw sellers step in and drive price below 1.09 to test an active H4 demand base at 1.0874-1.0887. Although this area remains intact for the time being, it appears vulnerable given that the pair has also found resistance from the underside of 1.09.
In support of the major breaking below the current H4 demand, daily candlesticks recently chalked up two back-to-back bearish selling wicks, which show room to extend down to a weekly support seen at 1.0819.
Our suggestions: By and large, our desk has absolutely no interest in buying the EUR today. We feel that a push below the current H4 demand is possible as Europe gets under way. According to the higher timeframes, the next downside target is the aforementioned weekly support. However, before we reach this point, the H4 Quasimodo support at 1.0859 is likely to facilitate a BOUNCE back up to the underside of the H4 demand. If you’re interested in this level, there’s little room to wait for confirmation. Therefore, an entry at market, with stops placed below 1.0850, targeting 1.0874 is how we plan to approach this level. The risk/reward is not great, we grant you, but the trade is high probability.
We have a relatively quiet docket today with only the US advance GDP being released at 12.30pm GMT. Nonetheless, this report is considered a high-impacting event, so remain vigilant during this time.
Levels to watch/live orders:
- Buys: 1.0860 ([pending order] stop loss: 1.0848).
- Sells: Flat (stop loss: N/A).
GBP/USD:
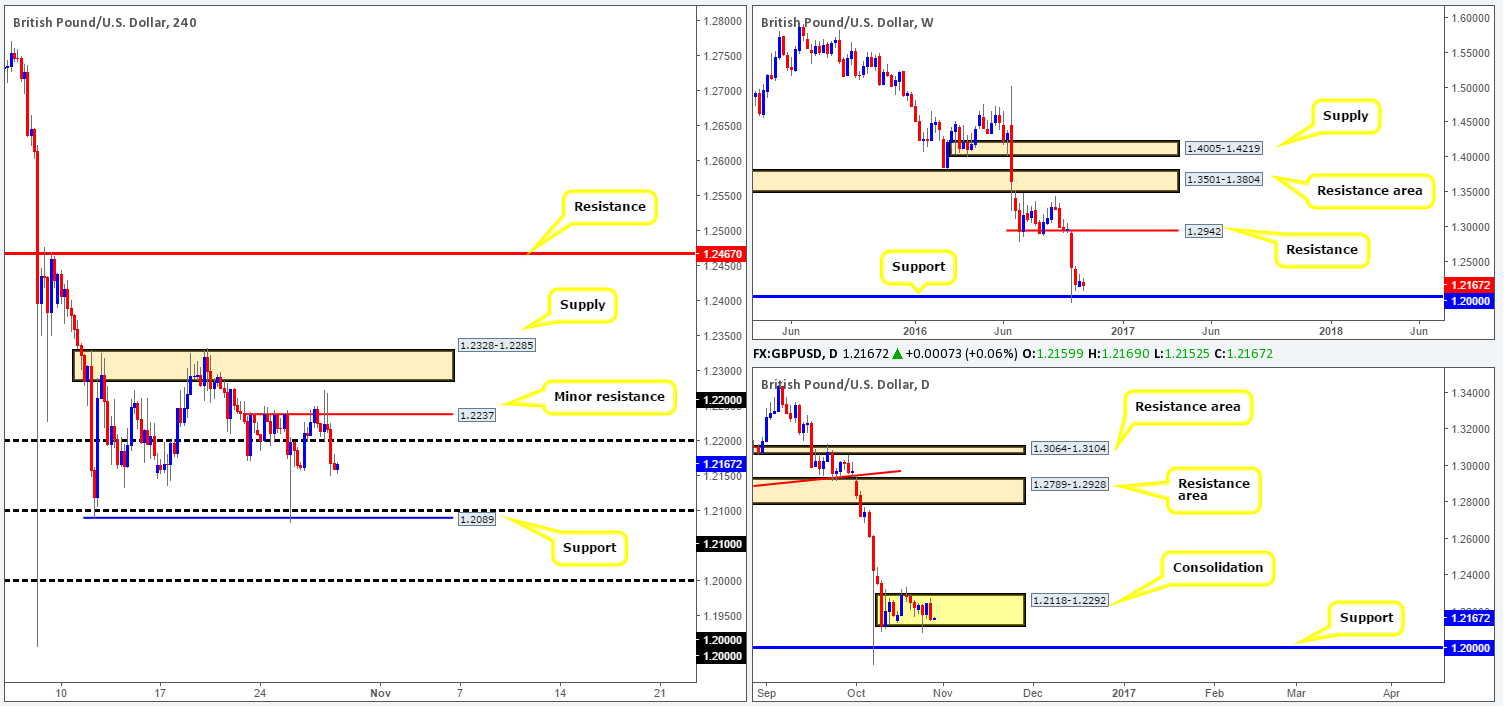
The impact of yesterday’s UK GDP data drove prices to highs of 1.2271. As you can see from the H4 chart, the buyers were unable to sustain gains beyond this point. This resulted in the pair printing two back-to-back bearish selling wicks around a minor resistance coming in at 1.2237, and ultimately pushing below the 1.22 handle going into the US segment. From our point of view, there’s little active demand seen to the left of current price. Therefore, the pair could look to extend its losses today and head towards the 1.21 handle (also comprising of a support seen just below it at 1.2089).
Looking at this from a different angle, however, support could materialize around the 1.2118 neighborhood, given that this number represents the lower edge of a daily consolidation zone. Up on the weekly chart, the path south appears clear for a dive down to the 1.20 support, which, as we have mentioned numerous times in past reports, also signifies the top edge of a monthly demand area: http://fxtop.com/en/historical-exchange-rates-graph-zoom.php?C1=GBP&C2=USD&A=1&DD1=07&MM1=10&YYYY1=1960&DD2=14&MM2=10&YYYY2=2016&LARGE=1&LANG=en&VAR=0&MM1M=0&MM3M=0&MM1Y=0
Our suggestions: While a continuation move south is highly likely today, we see no resistance at current price to base a short trade from. Therefore, the best we feel we can do in this situation is see if the H4 candles retest the underside of 1.22 and then, dependent on how the lower timeframe action behaves (see the top of this report for lower timeframe entry techniques), maybe consider a sell from here targeting 1.21.
Economic data to keep an eye on today is the US advance GDP report being released at 12.30pm GMT. A high-impacting event which is surely to cause ripples in this market, so remain on your toes during this time.
Levels to watch/live orders:
- Buys: Flat (stop loss: N/A).
- Sells: 1.22 region ([lower timeframe confirmation required] (stop loss: dependent on where one confirms this area).
AUD/USD:
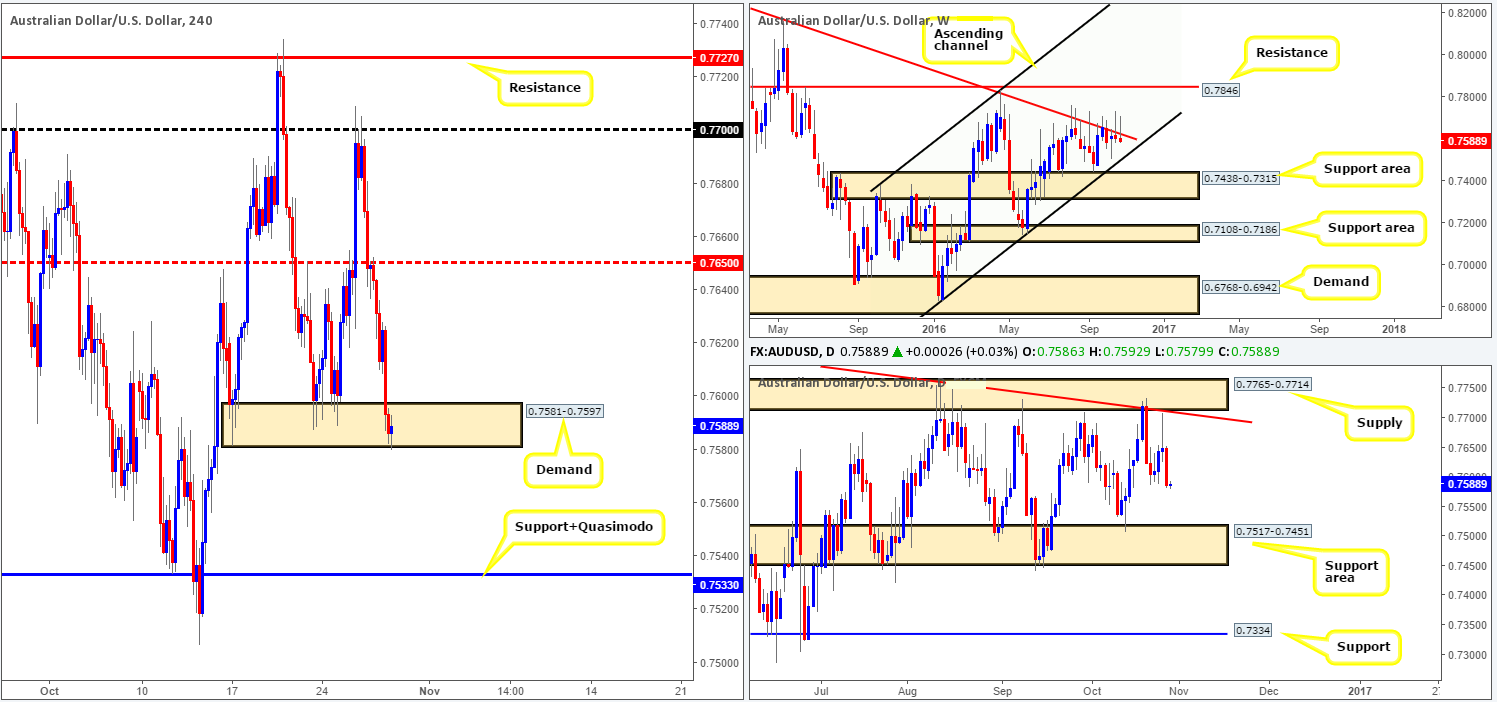
For those who read our previous report on the Aussie pair you may recall our team highlighting the possibility of a selloff from the underside of the H4 mid-way resistance 0.7650. As you can see, this came to fruition and even printed a beautiful-looking H4 bearish candle prior to the move lower. Unfortunately, we missed this trade! Well done to any of our readers who managed to lock in some green pips here!
Moving forward, we can see that the commodity currency is now teasing the lower edge of a H4 demand base at 0.7581-0.7597. Despite this area holding form on two separate occasions in the past week, we feel this zone may be on the verge of giving way. Furthermore, both the weekly and daily charts, at this point in time, appear to support further selling. Weekly action is close to printing its second consecutive selling wick, while daily price shows room to extend lower down to a support area coming in at 0.7517-0.7451.
Our suggestions: Watch for price to close below the current H4 demand. Should this come into view, wait for a retest to the underside of this zone followed up by a H4 bearish close. Once this has been satisfied, a short from here is, at least in our opinion, valid down to the H4 support/Quasimodo at 0.7533 (sits directly above a daily support area at 0.7517-0.7451).
As far as economic data goes today, investors will likely focus their attention the US advance GDP report being released at 12.30pm GMT.
Levels to watch/live orders:
- Buys: Flat (stop loss: N/A).
- Sells: Watch for a close below the H4 demand at 0.7581-0.7597 and then look to trade any retest seen thereafter (H4 bearish close required – stop loss: ideally beyond the trigger candle).
USD/JPY:
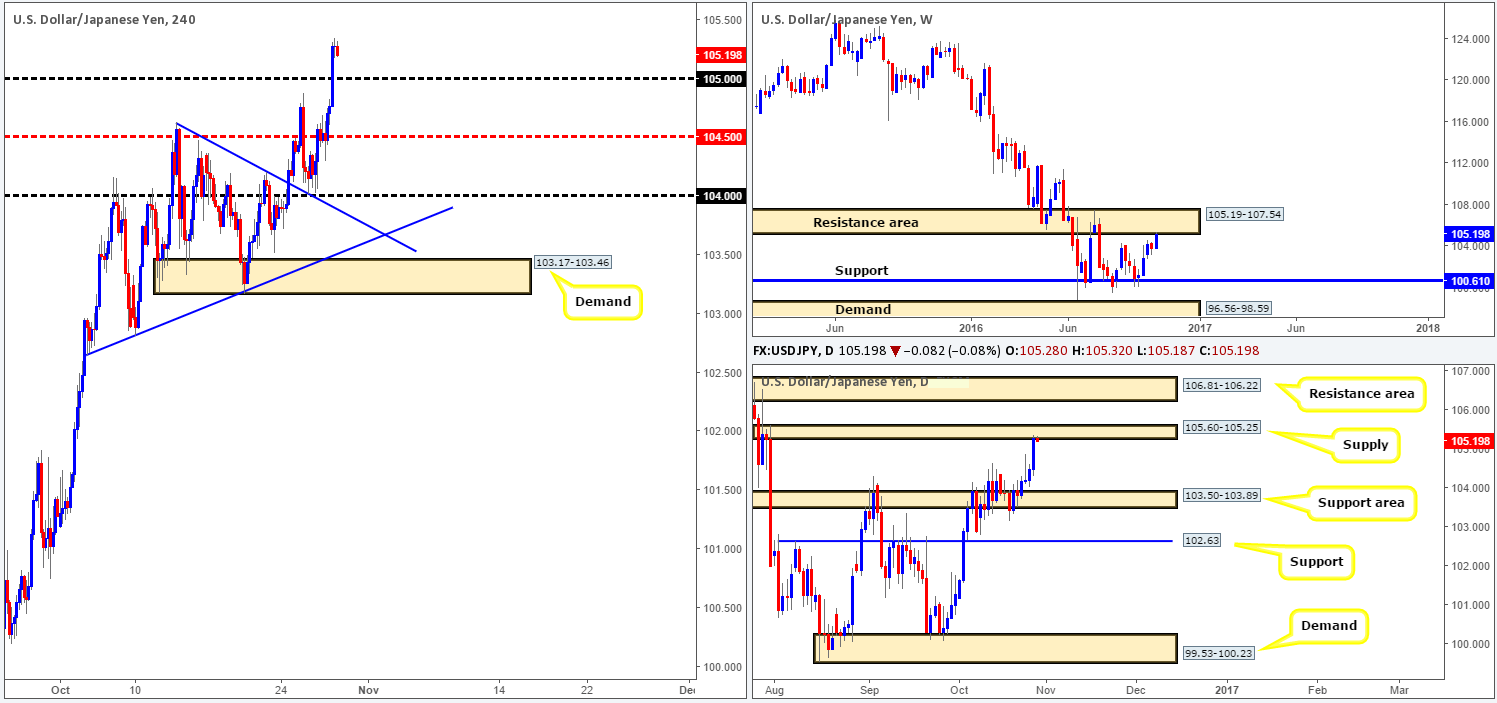
Kicking this morning’s report off with a look at the weekly chart shows that price recently connected with the underside of a resistance area coming in at 105.19-107.54. Bearing in mind that this barrier stretches as far back as 2014, we feel the buyers will have their work cut out for them if they intend on pushing things higher from here. In conjunction with the weekly chart, the daily candles also recently shook hands with a supply zone carved from 105.60-105.25, which happens to sit within the lower limits of the above said weekly resistance zone.
With the dollar surging higher across the board yesterday, this saw the H4 break through the 105 handle and clock a high of 105.34 by the day’s end. As we mentioned in yesterday’s report, we were looking to short between the 105.25/1.05 region, on the condition that a H4 bearish close was seen. As you can see, the bears showed little interest here so we passed.
Our suggestions: We’re sure most will agree, at least from a technical (structural) standpoint that this pair is overbought right now. Back-to-back higher-timeframe supplies coupled with a close below the 105 handle would, in our book, be enough to confirm lower prices are on the cards. However, in regards to entry, our team will be looking for price to retest the underside of 105, along with a H4 bearish close. Only then will our team be clear for entry. This may not come into view today considering we only have the US advance GDP report at 12.30pm GMT on the docket, but will be something to look forward to next week.
Levels to watch/live orders:
- Buys: Flat (stop loss: N/A).
- Sells: Watch for a close below the 105 handle and then look to trade any retest seen thereafter (H4 bearish close required – stop loss: ideally beyond the trigger candle).
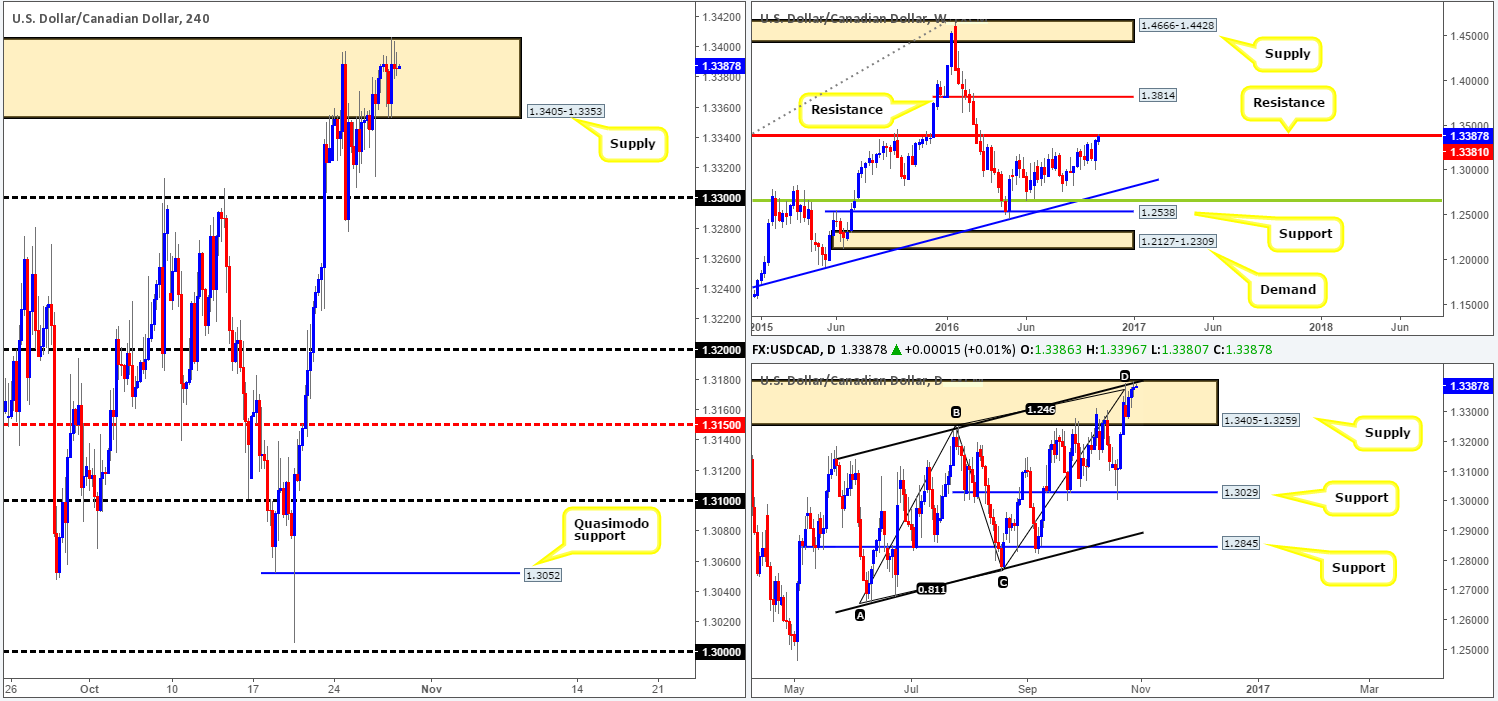
USD/CAD:
(Trade update: Stop was hit at 1.3407 for a loss).
The US dollar rose to a high of 1.3406 against the Canadian dollar yesterday, consequently piercing through the top edge of both a daily supply at 1.3405-1.3259 and its partner supply on the H4 at 1.3405-1.3353. Regardless of this, we still feel this market is overbought. Not only is the pair trading around a weekly resistance level at 1.3381, but it is also touching gloves with a daily AB=CD completion point around the 1.3376ish range and a channel resistance taken from the high 1.3241 (positioned within the current daily supply area). Bullish momentum has definitely slowed during the past couple of days, and we believe a selloff is just around the corner.
Our suggestions: Despite being stopped out in our first attempt to short this market, our team is confident, given the daily and weekly confluence in play that a sell will very likely pay off. With that being the case, we have entered into another short position from 1.3384, with stops set above at 1.3410. Ultimately, we’re looking for price to reach 1.33, and possibly beyond down to 1.32.
We’ll look to tighten stops (hopefully to a breakeven point) around 12.30pm GMT today given the release of the US advance GDP report.
Levels to watch/live orders:
- Buys: Flat (stop loss: N/A).
- Sells: 1.3384 ([live] stop loss: 1.3410).
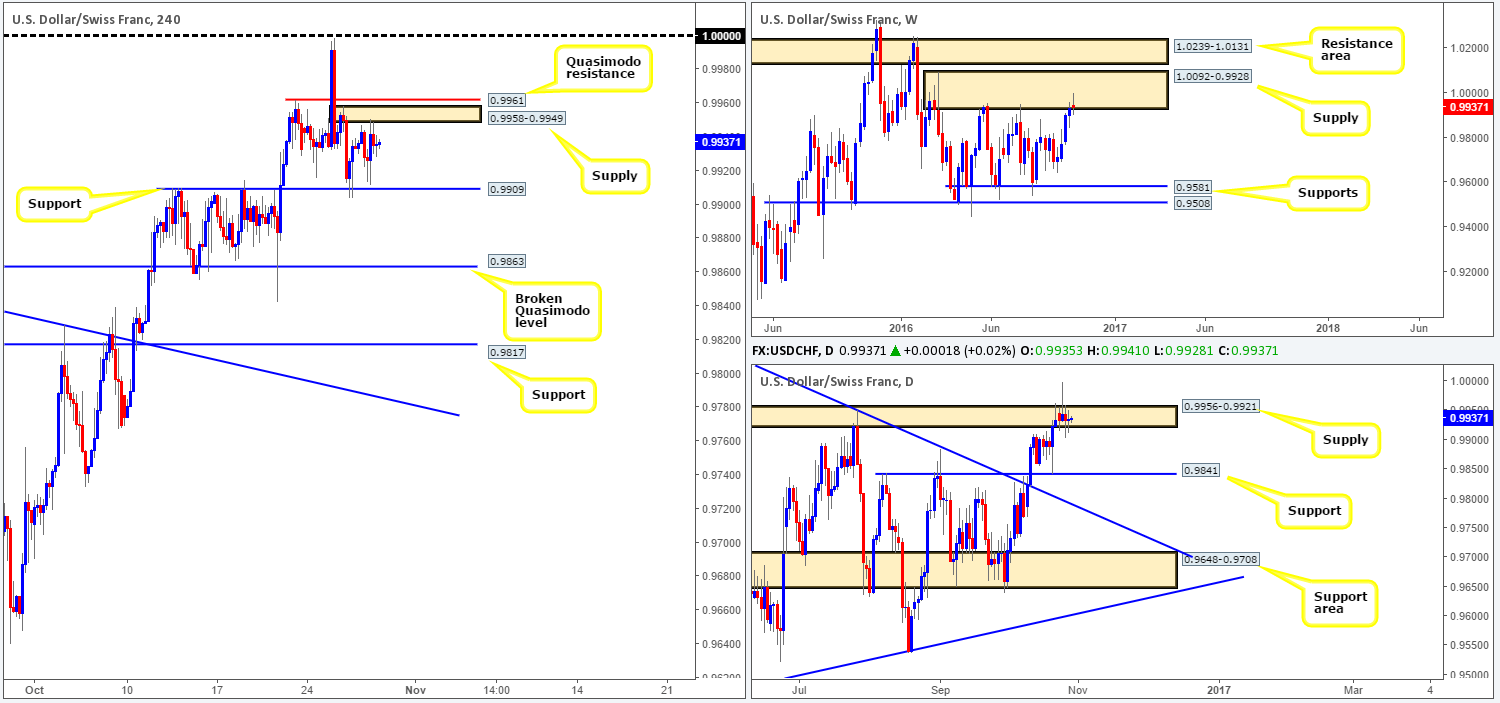
USD/CHF:
The USD/CHF pair, as you can see, remains locked between a H4 support at 0.9909 and a H4 supply drawn from 0.9958-0.9949. Looking over to the bigger picture, however, the weekly candles are seen trading from within a supply area at 1.0092-0.9928. On a similar note, daily action also continues to occupy a supply area seen at 0.9956-0.9921.
Our suggestions: In light of the higher-timeframe supplies, one could look to sell from the current H4 supply, but take into consideration that this area is likely to be faked up to the nearby H4 Quasimodo resistance at 0.9961. Conversely, conservative traders may wait for a decisive close beyond the 0.9909 level. This would likely free the runway south down to 0.9863: a H4 broken Quasimodo line – located just above a daily support at 0.9841 which is the next downside target on the daily timeframe. Following a close below 0.9909, our desk would look to short on a retest to the underside of this number (H4 bearish close required).
The calendar is rather light today, with only the US advance GDP report at 12.30pm GMT to contend with. In that this is considered a market-moving event, we would not advise entering into any positions thirty minutes pre/post this release.
Levels to watch/live orders:
- Buys: Flat (stop loss: N/A).
- Sells: 0.9958-0.9949 ([H4 bearish close required] stop loss: ideally beyond the trigger candle). Watch for a close below the H4 support at 0.9909 and then look to trade any retest seen thereafter (H4 bearish close required – stop loss: ideally beyond the trigger candle).
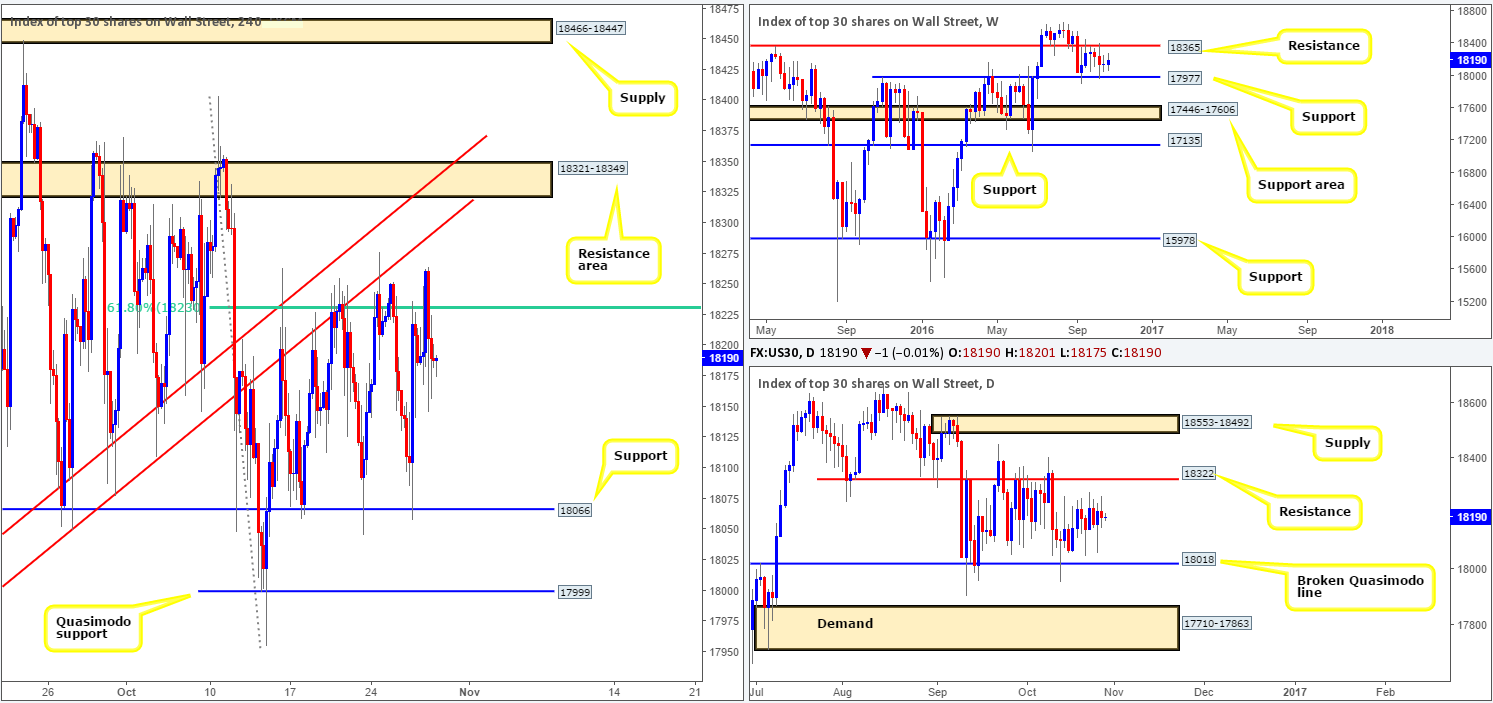
DOW 30:
Since the beginning of the week, this has been a rather monotonous market to cover. We continue to see the DOW consolidate on all three of the timeframes we follow. The weekly remains capped between resistance at 18365 and support at 17977. Down on the daily picture, the candles have been ranging amidst resistance at 18322 and a broken Quasimodo line at 18018 since mid-Sept. Stepping over to the H4 chart, from mid-Oct equities have been fixed between a H4 61.8% Fib resistance level at 18230 (bolstered by a trendline resistance chalked up from the low 17959) and a H4 support registered at 18066.
Our suggestions: Given how well respected the H4 range limits have been over the past couple of weeks, traders may want to consider trading within this box (we would not advise entering from these lines, however, until a reasonably sized H4 candle has taken shape to show possible intent).
For us personally, as we have mentioned multiple times in previous reports, we are not interested in trading here. Instead, the only areas we have interest in at the moment is the H4 Quasimodo support at 17999 and the H4 resistance area at 18321-18349. The Quasimodo is attractive because it fuses with nearby weekly support at 17977 and also the daily broken Quasimodo line at 18018.The resistance zone, nonetheless, is equally attractive since it houses the daily resistance level at 18322 and is located just below weekly resistance at 18365.
To avoid being stopped out by one of those dreaded whipsaws; we’d recommend waiting for a H4 close prior to risking capital at these areas.
Levels to watch/live orders:
- Buys: 17999 ([H4 bullish close required] stop loss: ideally beyond the trigger candle).
- Sells: 18321-18349 ([H4 bearish close required] stop loss: ideally beyond the trigger candle).
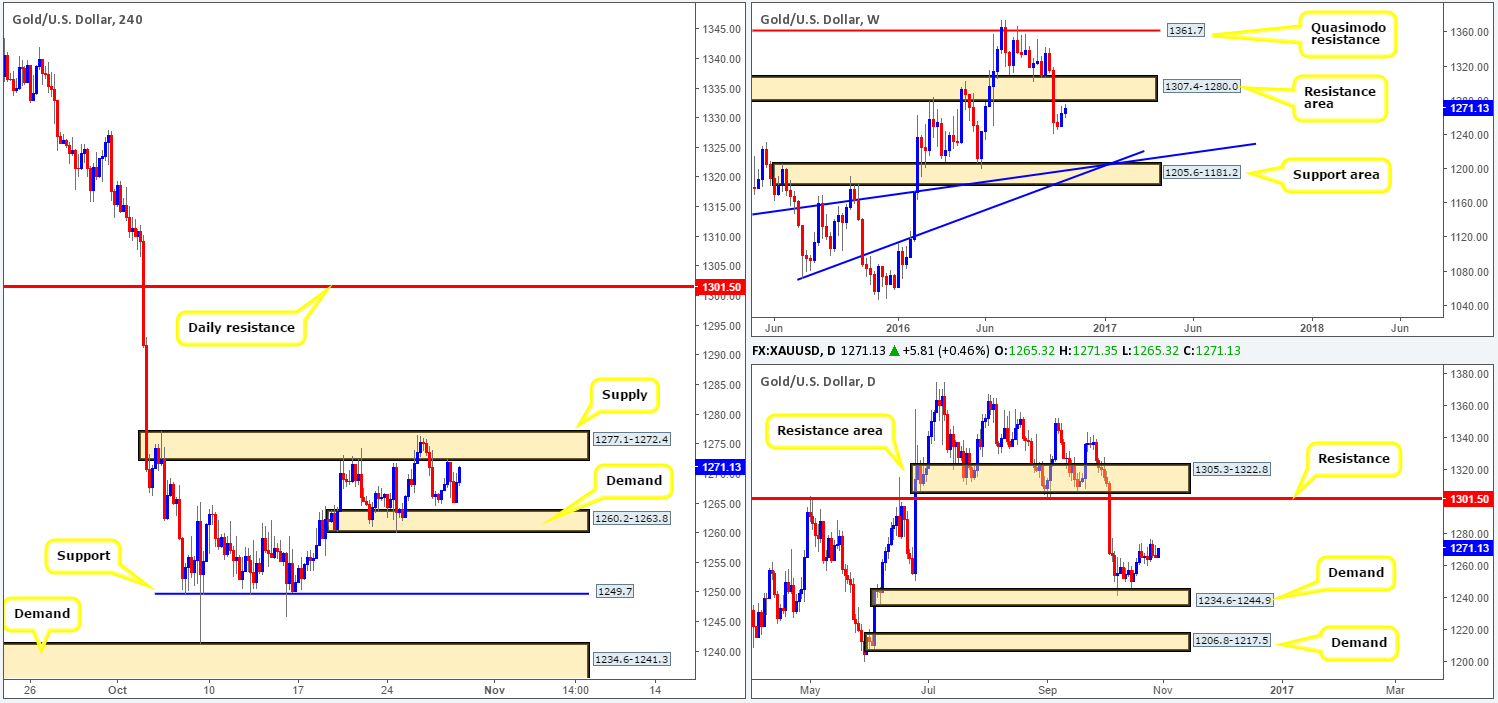
GOLD:
The gold market was relatively quiet yesterday. Although price did in fact decline in value, the overall structure of this unit remains unchanged. As was noted in Thursday’s report, our team now considers the H4 timeframe to have entered into a phase of consolidation between the supply at 1277.1-1272.4 and demand carved from 1260.2-1263.8. A violation of this demand area would likely stimulate a decline back down to the 1249.7 region: a H4 support. Meanwhile, if the current supply area is engulfed, daily resistance at 1301.5 is likely the next target on the hit list.
Following on from above, the higher-timeframe picture shows that weekly action recently came close to testing the underside of a resistance area drawn from 1307.4-1280.0. Looking down to the daily chart, however, gold still appears to be trading in no-man’s-land at the moment between the aforementioned daily resistance level and a daily demand zone coming in at 1234.6-1244.9.
Our suggestions: On account of the above points our desk is still interested in seeing a break above the current H4 supply barrier. The reason being, as we highlighted in yesterday’s report, is that beyond this area, the pathway north on the H4 is clear up to the aforementioned daily resistance. As such, should price retest this boundary as demand (after a close higher) followed by a reasonably sized H4 bull candle, one could look to go long from here targeting the daily level. However, do remain aware that by entering long from here, even with the confirmation of a H4 bull candle, you’re effectively buying directly into a weekly resistance area.
Should a close be seen below the current H4 demand on the other hand, we may, depending on if the H4 candles retest the underside of this area as supply, look to short from here (H4 bearish close required), given how close price recently came to testing the weekly resistance area mentioned above.
Levels to watch/live orders:
- Buys: Watch for a close above the H4 supply at 1277.1-1272.4 and then look to trade any retest seen thereafter (H4 bullish close required – stop loss: ideally beyond the trigger candle).
- Sells: Watch for a close below the H4 demand at 1260.2-1263.8 and then look to trade any retest seen thereafter (H4 bearish close required – stop loss: ideally beyond the trigger candle).