Waiting for lower timeframe confirmation is our main tool to confirm strength within higher timeframe zones, and has really been the key to our trading success. It takes a little time to understand the subtle nuances, however, as each trade is never the same, but once you master the rhythm so to speak, you will be saved from countless unnecessary losing trades. The following is a list of what we look for:
- A break/retest of supply or demand dependent on which way you’re trading.
- A trendline break/retest.
- Buying/selling tails/wicks – essentially we look for a cluster of very obvious spikes off of lower timeframe support and resistance levels within the higher timeframe zone.
- Candlestick patterns. We tend to stick with pin bars and engulfing bars as these have proven to be the most effective.
We typically search for lower-timeframe confirmation between the M15 and H1 timeframes, since most of our higher-timeframe areas begin with the H4. Stops are usually placed 3-5 pips beyond confirming structures.
EUR/USD:
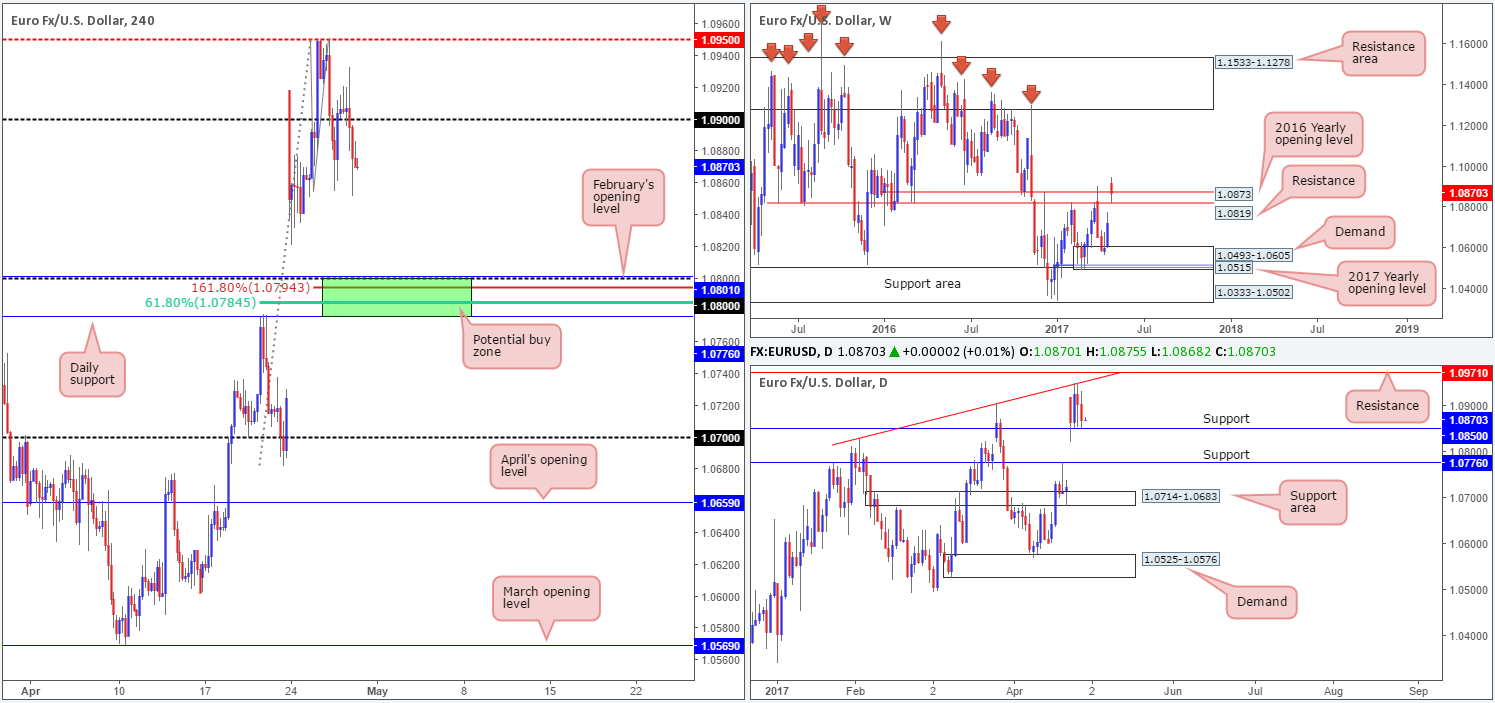
Kicking this morning’s report off with a quick look-see at the weekly chart shows that the pair remains hovering above the 2016 yearly opening level at 1.0873/ resistance at 1.0819. However, it might be worth waiting for the weekly candle to close shop before presuming that these said resistances are consumed. Down on the daily candles we can see that price has spent last two days easing from a trendline resistance extended from the high 1.0828. Consequent to this, the unit is now positioned within inches of support coming in at 1.0850.
After failing to sustain gains beyond the 1.09 handle yesterday, H4 bears clocked a low of 1.0851. While a bounce from this region could be seen given the aforementioned daily support in play at the moment, the 1.08 handle also looks a reasonable possibility for a bounce.
Our suggestions: Why the 1.08 boundary? Well, It converges beautifully with February’s opening level at 1.0801, a H4 AB=CD 161.8% Fib at 1.0794 taken from the high 1.0949 and a H4 61.8% Fib retracement at 1.0784 drawn from the low 1.0682. What’s more, notice a daily support is seen just below it at 1.0776 (the next support below the current daily level mentioned above). So, while price could obviously ignore 1.08 today and rally from the current daily support, we feel the 1.08 level quite simply has more to offer and is worth the wait.
Data points to consider: US Advance GDP figures at 1.30pm, FOMC member Brainard speaks at 6.15 pm, closely followed by FOMC member Harker who speaks 7.30pm GMT+1.
Levels to watch/live orders:
- Buys: 1.0776/1.08 ([dependent on the time of day, a long from here is possible without the need for additional confirmation] stop loss: 1.0773).
- Sells: Flat (stop loss: N/A).
GBP/USD:
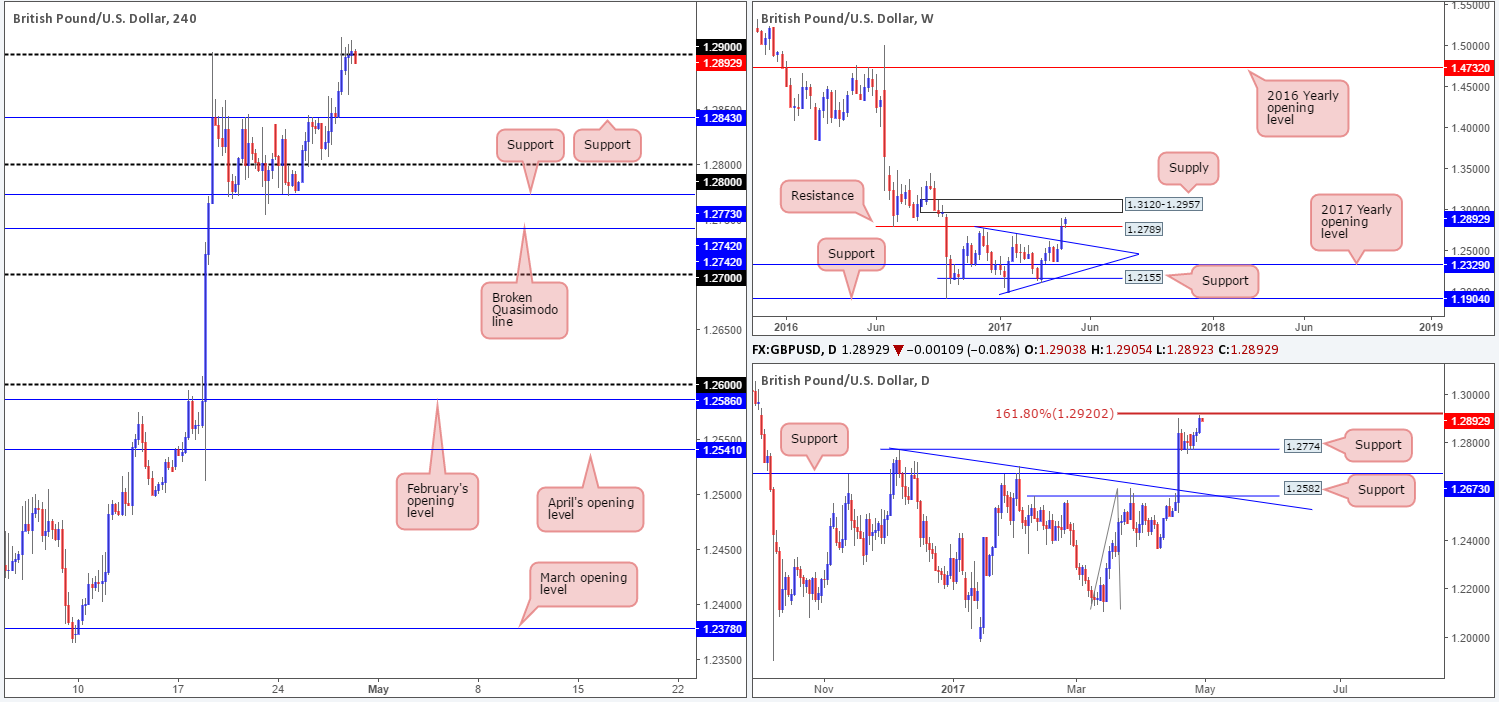
Following a H4 consolidation between 1.2844/1.2776 that lasted a good few days, H4 bulls finally rose up and took charge yesterday, marching up to the 1.29 handle. Closely supporting this psychological band is a daily AB=CD 161.8% Fib extension seen at 1.2920 (Taken from the low 1.2108). Also noteworthy is weekly action. Following the prior week’s (marginal) close beyond resistance at 1.2789, the bulls look poised to extend north up to supply drawn from 1.3120-1.2957.
With the above notes in mind, where does this leave us? Well, shorting from 1.09 today is a possibility with stops placed above the 1.2920 reigon. This, of course, could be considered a risky move though given where weekly price looks to be headed. As such, the team has decided to side step the short from 1.29 and wait to see if price can reach the H4 mid-level resistance at 1.2950 owing to how close this level is located to the above said weekly supply.
Our suggestions: Wait and see if H4 price shakes hands with 1.2950. Should this come to fruition, we’d then require a reasonably sized H4 bear candle to form (preferably a full-bodied candle) to confirm sellers are active.
Data points to consider: UK Prelim GDP figures at 9.30am. US Advance GDP figures at 1.30pm, FOMC member Brainard speaks at 6.15 pm, closely followed by FOMC member Harker who speaks 7.30pm GMT+1.
Levels to watch/live orders:
- Buys: Flat (stop loss: N/A).
- Sells: 1.2950 region ([waiting for a reasonably sized H4 bear candle to form before pulling the trigger is advised] stop loss: ideally beyond the candle’s wick).
AUD/USD:
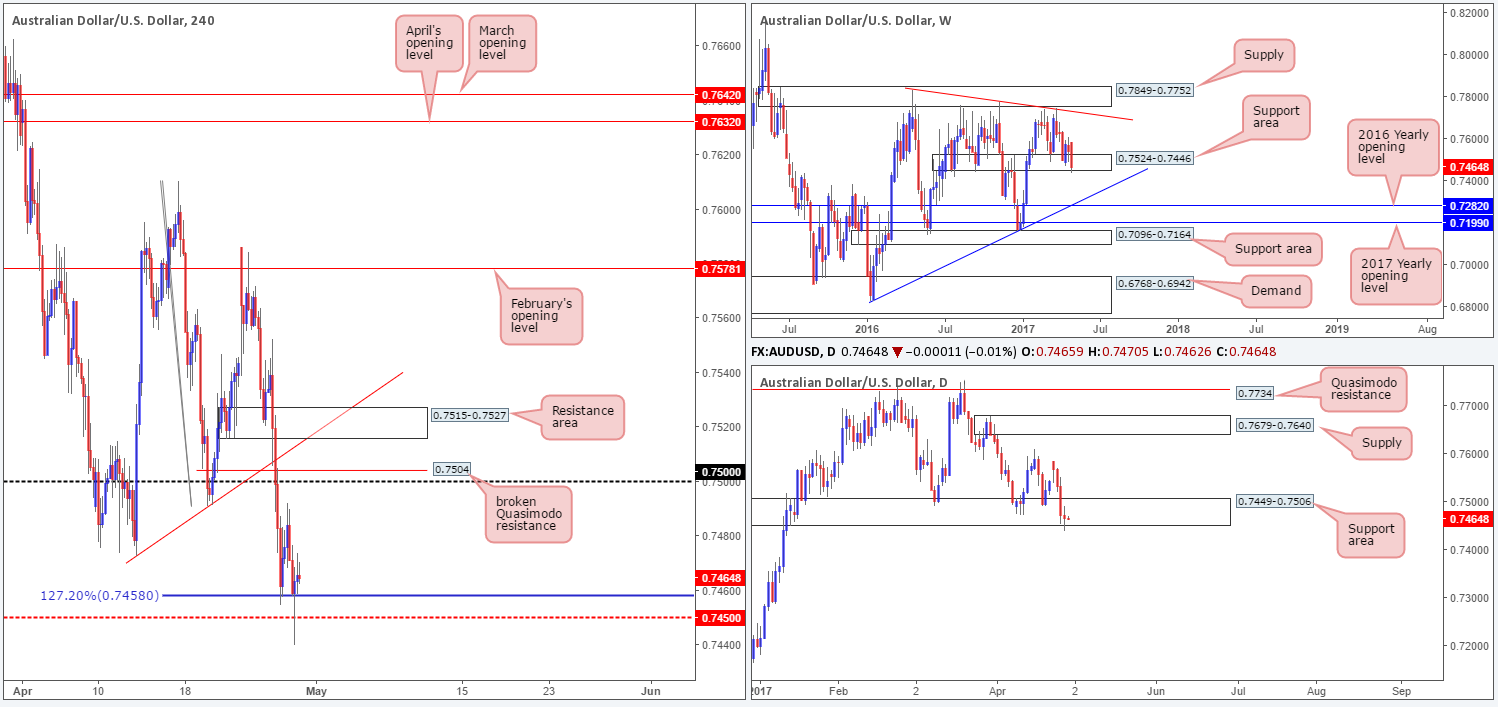
During the course of yesterday’s sessions, the H4 candles aggressively whipsawed through both the AB=CD 127.2% Fib ext. at 0.7458 and nearby mid-level support at 0.7450. At this stage, nevertheless, the odds of price breaching these two levels today are high. Our reasoning lies within the higher-timeframe structures. Check out the weekly chart. The bulls initially attempted to rotate from the support area seen at 0.7524-0.7446, but has thus far been unsuccessful. This has left price trading within the lower limits of this zone. Also of interest is the daily chart. Yesterday’s movement chalked up a clear-cut indecision candle around the bottom edge of a support area at 0.7449-0.7506 (seen lodged within the current weekly support area).
Our suggestions: The weakness seen from the bid-side of this market at the moment makes us reluctant to take longs. On that note, we would, should a decisive H4 close be seen beyond 0.7450, look to trade short on any retest (if it’s accompanied by a full-bodied H4 bearish candle that is) seen to the underside of this number, targeting 0.7400 as an initial take-profit target.
Data points to consider: US Advance GDP figures at 1.30pm, FOMC member Brainard speaks at 6.15 pm, closely followed by FOMC member Harker who speaks 7.30pm GMT+1.
Levels to watch/live orders:
- Buys: Flat (stop loss: N/A).
- Sells: Watch for price to engulf 0.7450 and then look to trade any retest seen thereafter ([waiting for a H4 full-bodied bear candle to form following the retest is advised] stop loss: ideally beyond the candle’s wick).
USD/JPY:
Over the past couple of days, the H4 candles have experienced a considerable amount of choppy action between April’s opening level at 111.41 and the 111 handle. Directly above this range is a supply seen at 112.19-111.95, whereas beyond 111 is a mid-level support seen at 110.50. Aiding the bears at the moment is a weekly resistance area at 111.44-110.10 and a daily resistance area drawn from 111.35-112.37.
Our suggestions: Given the higher-timeframe structures currently in motion, the overall tone is biased to the downside, in our opinion. Because of this, we’re looking for a H4 close to print below 111 today. This – coupled with a retest that’s followed up with a H4 bearish rejection (preferably a full-bodied candle) would be enough evidence to short down to at least the H4 mid-level support at 110.50.
Data points to consider: US Advance GDP figures at 1.30pm, FOMC member Brainard speaks at 6.15 pm, closely followed by FOMC member Harker who speaks 7.30pm GMT+1.

Levels to watch/live orders:
- Buys: Flat (stop loss: N/A).
- Sells: Watch for price to engulf the 111 handle and then look to trade any retest seen thereafter ([waiting for a H4 full-bodied bear candle to form following the retest is advised] stop loss: ideally beyond the candle’s wick).
USD/CAD:
In recent sessions, we saw the H4 candles surpass the 1.36 handle and touch gloves with a H4 mid-level resistance at 1.3650/resistance pegged at 1.3662. Despite the current resistances in play right now, the higher timeframes strongly suggest further buying may be on the cards. Over on the weekly timeframe, price is not only seen respecting the 2017 yearly opening level at 1.3434 as support, it also recently broke above a well-defined double-top formation seen around the 1.3588 neighborhood (green circle). In addition to this, the recent break of daily supply at 1.3598-1.3559 (now acting support area), in our view, confirms the weekly bull’s strength. The next upside target seen beyond here comes in at 1.3859-1.3700: a supply zone which happens to house the 2016 yearly opening level at 1.3814 (the weekly timeframe’s next upside target) within.
Our suggestions: In essence, our desk is looking for H4 price to close above the current H4 resistances. A long on any retest of these levels is valid up to the 1.37 band. It is here we’d advise tightening your position. Not only because it is a psychological level, but also due to it denoting the lower edge of the current daily supply. Ultimately though, we would be looking to take full profit around the 1.38 region, essentially marking the 2016 yearly opening line.
Data points to consider: US Advance GDP figures at 1.30pm, FOMC member Brainard speaks at 6.15 pm, closely followed by FOMC member Harker who speaks 7.30pm. Canadian GDP numbers at 1.30pm GMT+1.

Levels to watch/live orders:
- Buys: Watch for price to engulf 1.3662 and then look to trade any retest seen thereafter ([waiting for a H4 full-bodied bull candle to form following the retest is advised] stop loss: ideally beyond the candle’s tail).
- Sells: Flat (stop loss: N/A).
USD/CHF:
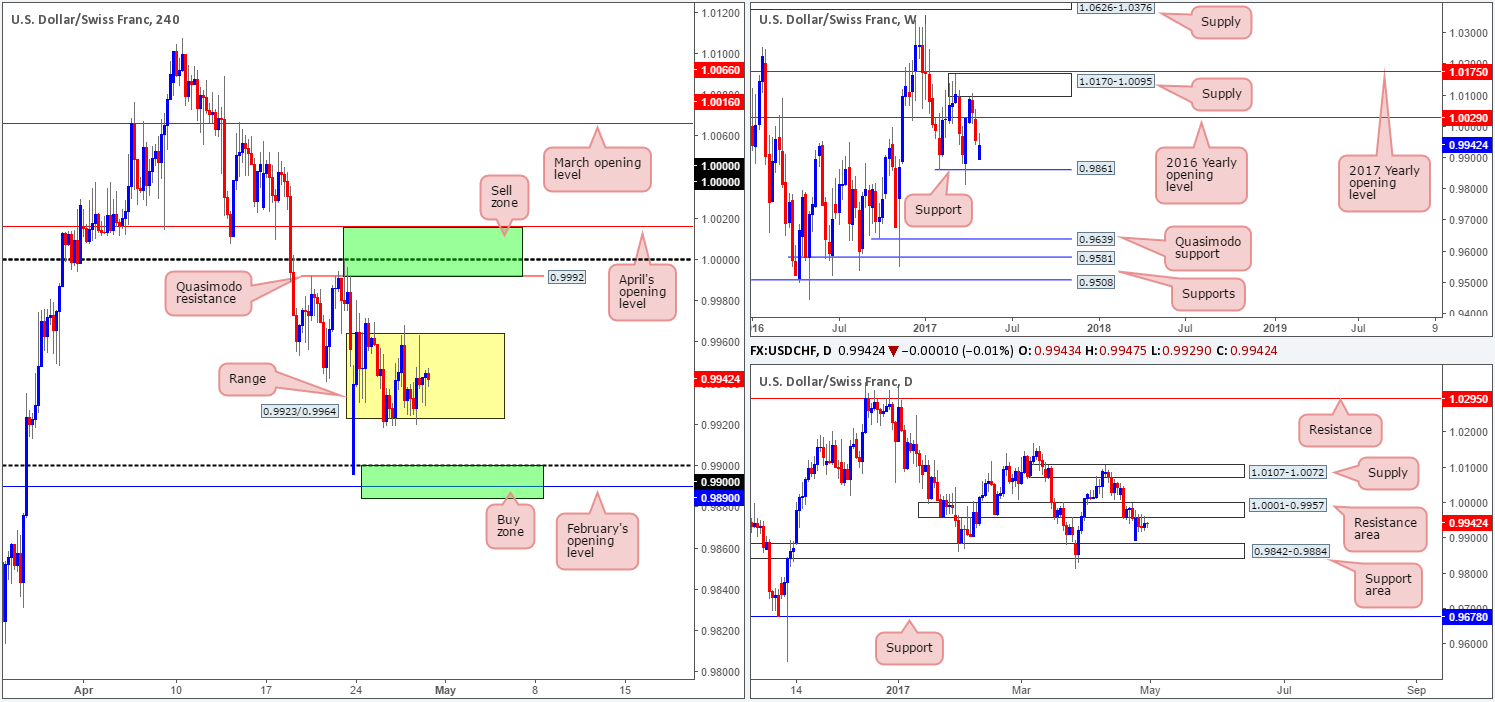
For the past few days, the H4 candles have been busy chiseling out a consolidation between 0.9923/0.9964. Above this range, we can see a H4 Quasimodo resistance level coming in at 0.9992, closely followed by parity (1.0000) and then April’s opening level at 1.0016. To the downside, however, there’s the 0.99 handle, which is shadowed closely by February’s opening line at 0.9890. Over on the daily chart, the pair remains capped by a resistance area seen at 1.0001-0.9957. Assuming that the bears remain in control here, the Swissy may eventually pay a visit to the support area penciled in at 0.9842-0.9884.
Our suggestions: As far as we can see, there’s equal opportunity to trade this pair both long and short today. For shorts, we have the 1.0016/0.9992 region, and for longs there’s the 0.9884/0.99 base. Both zones, as you can probably see, boast daily structure. The only grumble we would have if we were to take a long from the said area is the fact that weekly price could potentially push the market through our H4 buy zone to shake hands with support at 0.9861.
Data points to consider: US Advance GDP figures at 1.30pm, FOMC member Brainard speaks at 6.15 pm, closely followed by FOMC member Harker who speaks 7.30pm. SNB Chairman Jordan speaks at 9am GMT+1.
Levels to watch/live orders:
- Buys: 0.9884/0.99 ([waiting for a reasonably sized H4 bull candle to form before pulling the trigger is advised] stop loss: ideally beyond the candle’s tail).
- Sells: 1.0016/0.9922 ([waiting for a reasonably sized H4 bear candle to form before pulling the trigger is advised] stop loss: ideally beyond the candle’s wick).
DOW 30:
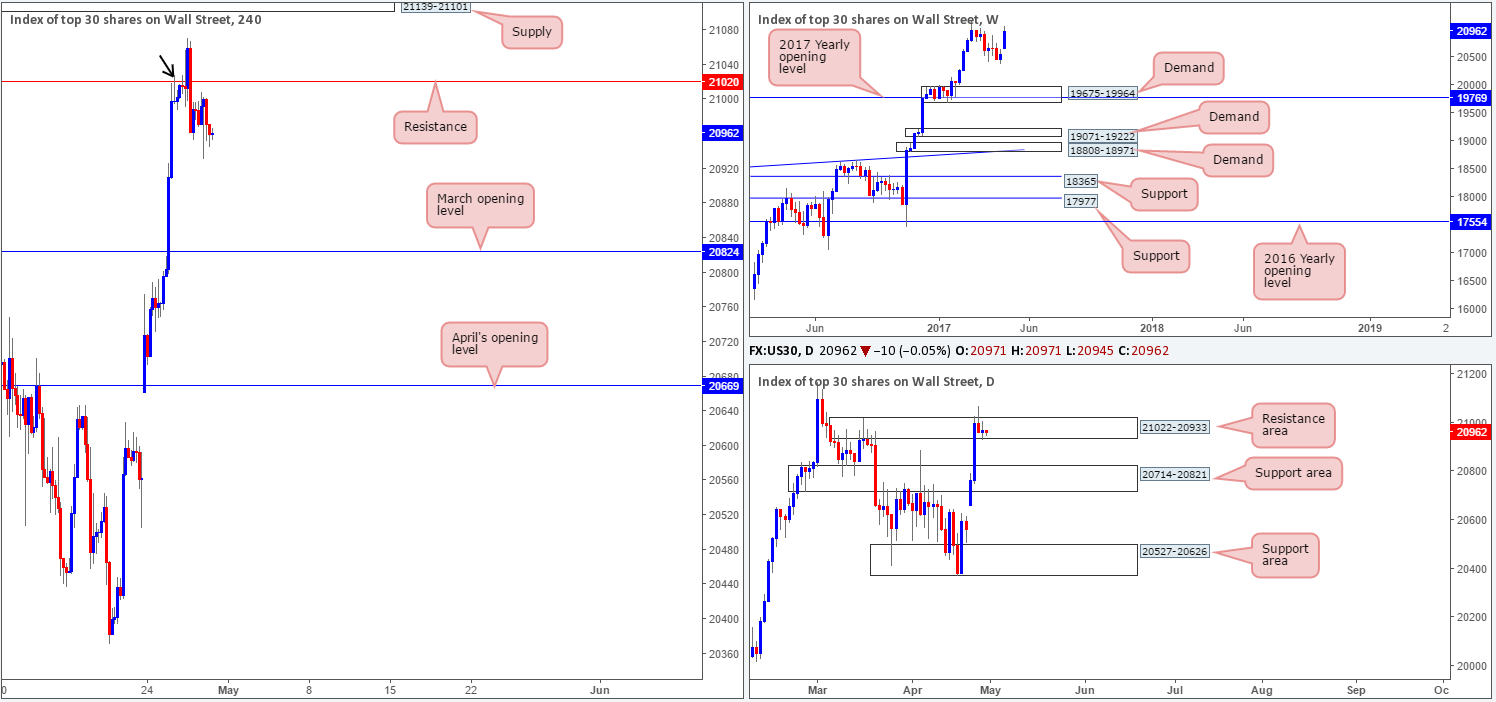
As can be seen from the daily timeframe this morning, the candles are struggling to breach the resistance area coming in at 21022-20933. This, we believe, is all that’s stopping the DOW from reaching fresh record highs! A decisive close above here would very likely seal the deal. Right now though, it seems the bears are in control. With little support seen over on the H4 timeframe until we reach March’s opening level at 20824, there’s a chance that we may see more pressure come in from the bears!
Our suggestions: Based on the above notes, a short from the H4 resistance at 21020 could be an option considering that it merges closely with 21028: a H4 Quasimodo resistance level seen marked with a black arrow. However, taking into account that the broader focus on this index remains north, waiting for a H4 bearish rejection candle to form off 21020 (preferably a full-bodied candle) before committing to a short is advised. This, of course, by no means guarantees a winning trade, but what it will do is show seller intent off a high-probability resistance level.
Data points to consider: US Advance GDP figures at 1.30pm, FOMC member Brainard speaks at 6.15 pm, closely followed by FOMC member Harker who speaks 7.30pm GMT+1.
Levels to watch/live orders:
- Buys: Flat (stop loss: N/A).
- Sells: 21020 region ([waiting for a reasonably sized H4 bear candle to form before pulling the trigger is advised] stop loss: ideally beyond the candle’s wick).
GOLD:
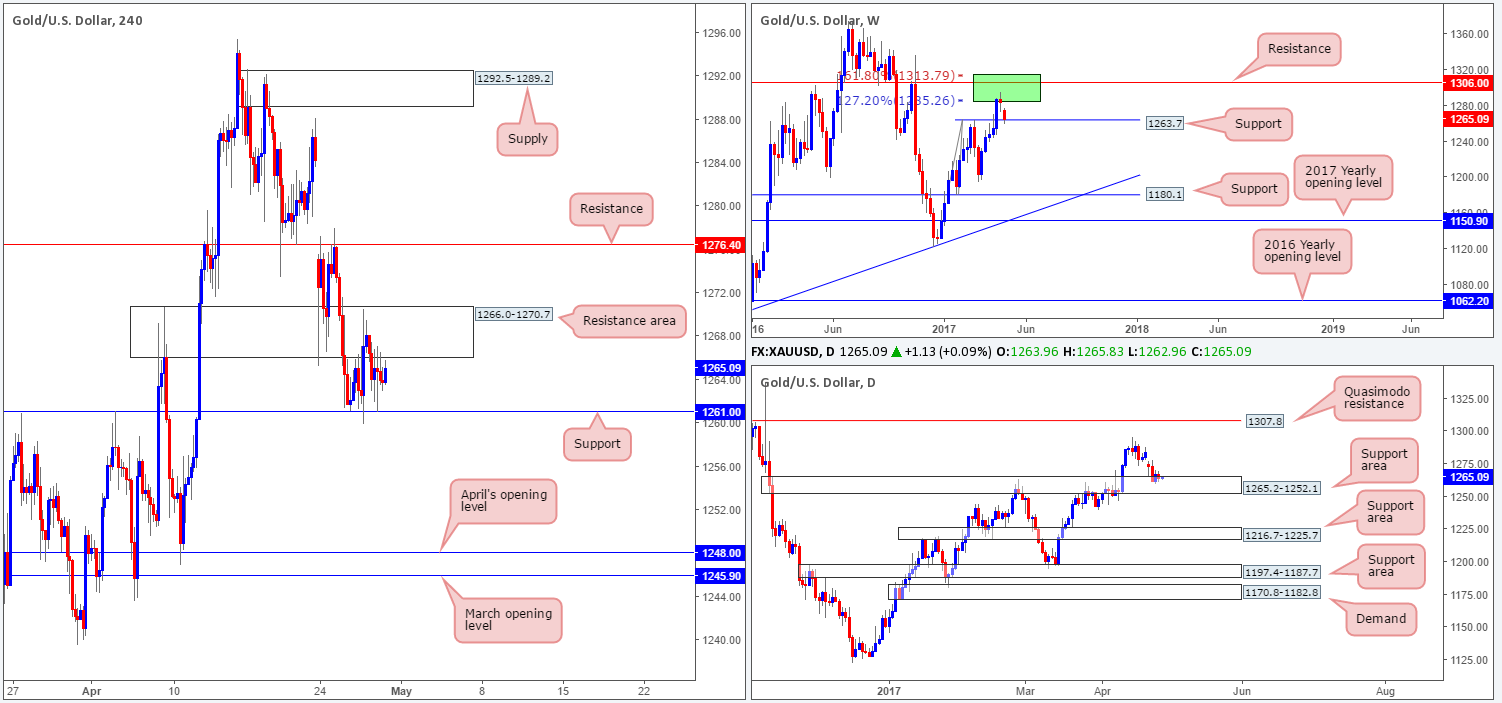
The yellow metal, as you can see, remains capped by the H4 resistance area at 1266.0-1270.7 and H4 support level at 1261.0. This is quite something considering that we have a daily support area at 1265.2-1252.1 and a weekly support level at 1263.7 both in play at the moment! Although shorts look tempting beyond the current H4 support level down to April’s opening level at 1248.0, we just would not feel comfortable selling here knowing what’s lurking beneath us on the higher timeframes! Unfortunately, even with a decisive push to the upside, H4 buyers will have to almost immediately contend with resistance marked at 1276.4.
Our suggestions: Neither a long nor short seems attractive at this time. It appears we’re trapped from both ends! With this being the case, remaining on the sidelines may very well be the better path to take today.
Levels to watch/live orders:
- Buys: Flat (stop loss: N/A).
- Sells: Flat (stop loss: N/A).


