A note on lower timeframe confirming price action…
Waiting for lower timeframe confirmation is our main tool to confirm strength within higher timeframe zones, and has really been the key to our trading success. It takes a little time to understand the subtle nuances, however, as each trade is never the same, but once you master the rhythm so to speak, you will be saved from countless unnecessary losing trades. The following is a list of what we look for:
- A break/retest of supply or demand dependent on which way you’re trading.
- A trendline break/retest.
- Buying/selling tails – essentially we look for a cluster of very obvious spikes off of lower timeframe support and resistance levels within the higher timeframe zone.
- Candlestick patterns. We tend to only stick with pin bars and engulfing bars as these have proven to be the most effective.
For us, lower timeframe confirmation starts on the M15 and finishes up on the H1, since most of our higher timeframe areas begin with the H4. Stops usually placed 5-10 pips beyond your confirming structures.
EUR/USD:
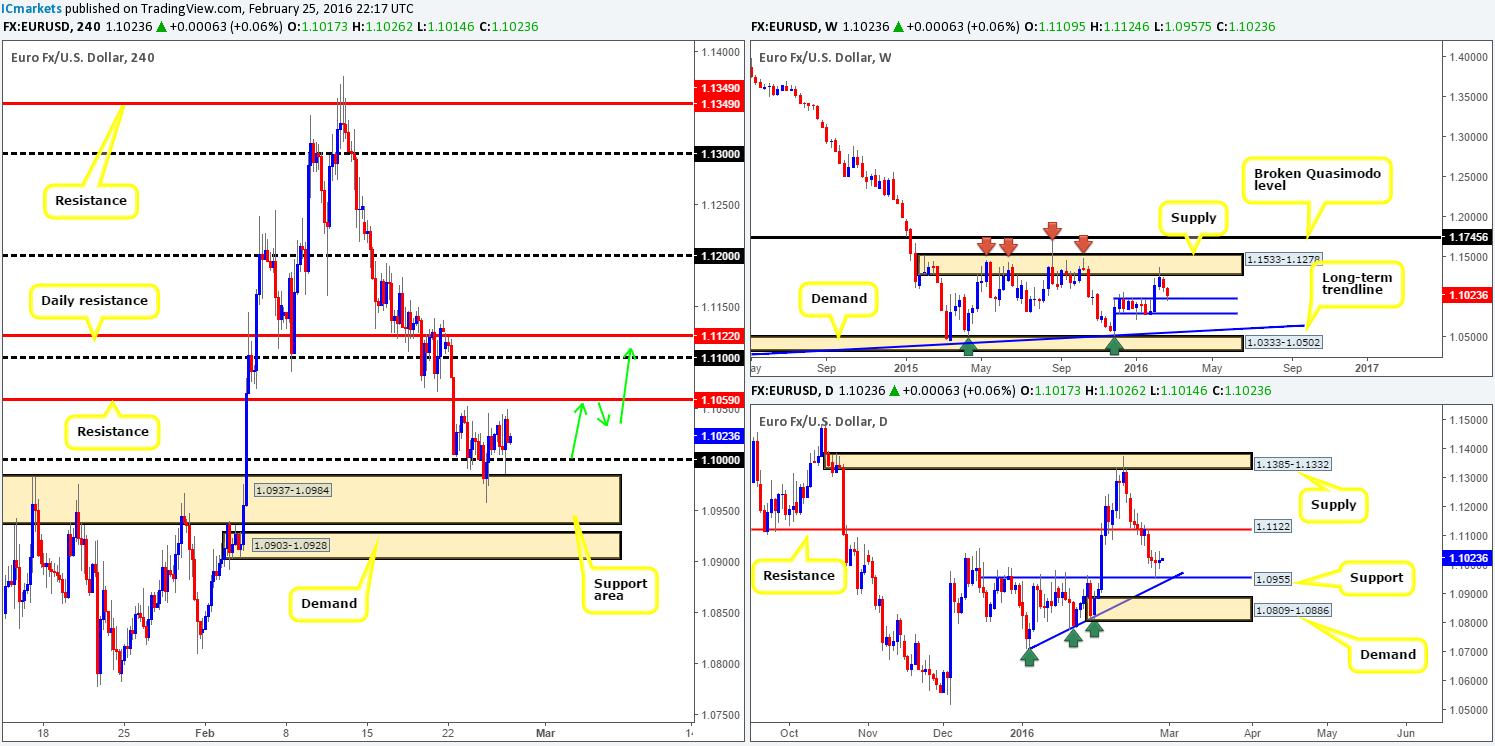
As can be seen from the weekly chart this morning, price remains bid above support penciled in at 1.0983. The next upside target from this line falls in at supply drawn from 1.1533-1.1278, whilst a break below current support has the 1.0796 region to target. Looking down to the daily chart, price printed its third indecision candle yesterday following Wednesday’s bounce off support seen at 1.0955. Should buyers make an appearance here today, resistance at 1.1122 will likely be their first port of call. Meanwhile, a break lower would place the strong demand base at 1.0809-1.0886 in the firing range.
In our previous report (http://www.icmarkets.com/blog/thursday-25th-february-daily-technical-outlook-and-review/) we mentioned that we’d like to see price retest the 1.1000 figure and hold for a possible buy trade. Unfortunately, price moved too fast to secure an entry here. However, judging by where current price is trading (1.0223 region) at the moment, and the fact that the market is bouncing from higher timeframe support (see above), we feel we may get a second stab at buying from 1.1000 today should it remain stable. From here, the first take-profit target comes in around H4 resistance at 1.1059, followed closely by the 1.1100 figure, and then daily resistance just above it drawn from 1.1122 (as per the green arrows).
Levels to watch/live orders:
- Buys: 1.1000 [Tentative – confirmation required] (Stop loss: dependent on where one confirms this level).
- Sells: Flat (Stop loss: N/A).
GBP/USD:
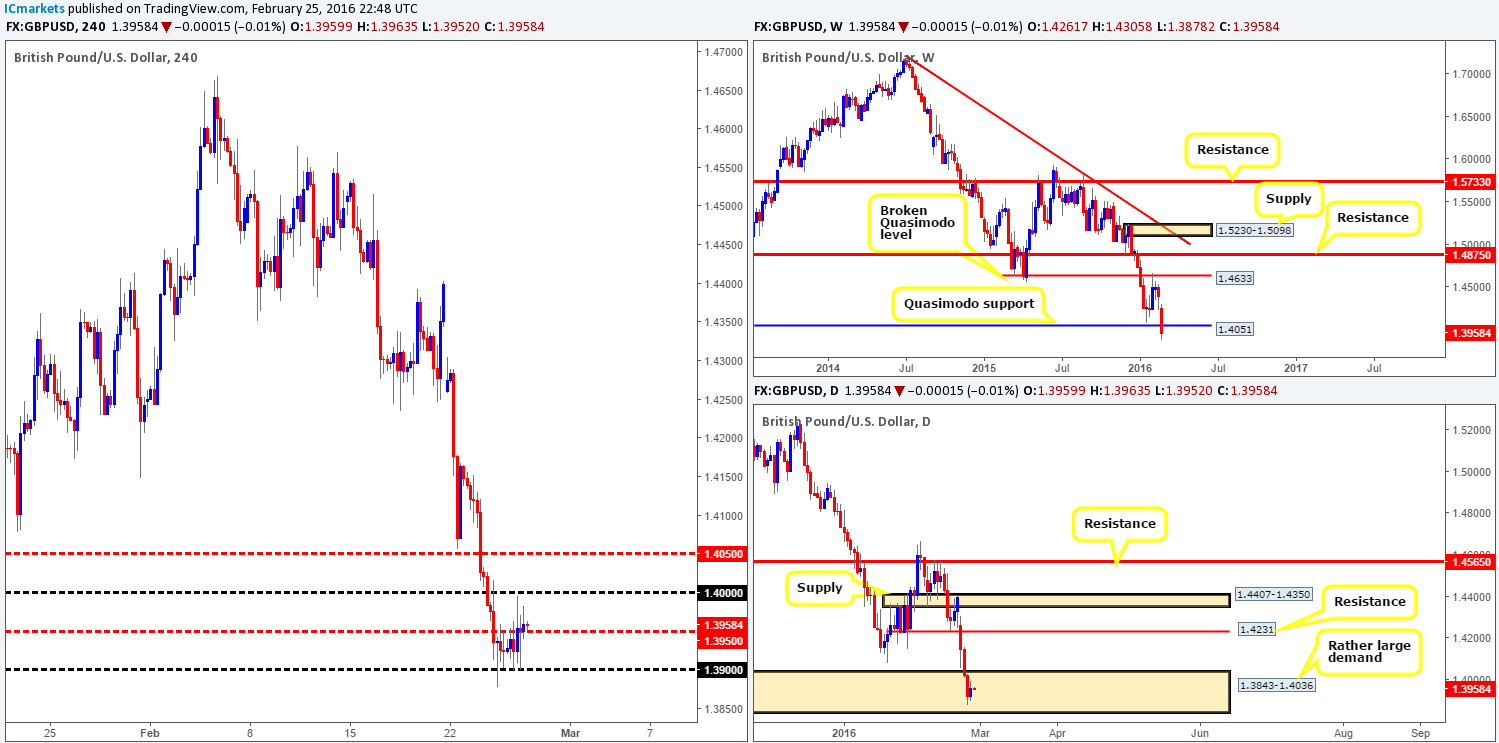
Psychological support 1.3900 continued to bolster this market yesterday, allowing price to dart up to the 1.4000 region mid-way through London trading and then pullback to mid-level support 1.3950 going into the U.S. session.
From a technical standpoint, buying, or even selling this pair is a tricky thing to do right now in our opinion. On the one hand, 1.3950 is providing support at the moment, along with daily action trading from within demand at 1.3843-1.4036. However, bear in mind that the weekly Quasimodo support at 1.4051 is currently under attack and not faring too well at the moment. What is more, buying this unit would place one against the predominant bearish trend.
We really believe trading is about acting in one’s own best interest, and buying or selling this pair, at least from where we’re standing, is not something we’d be comfortable with. Therefore, we’re going to remain on the sidelines today and watch the action from safety.
Levels to watch/live orders:
- Buys: Flat (Stop loss: N/A).
- Sells: Flat (Stop loss: N/A).
AUD/USD:
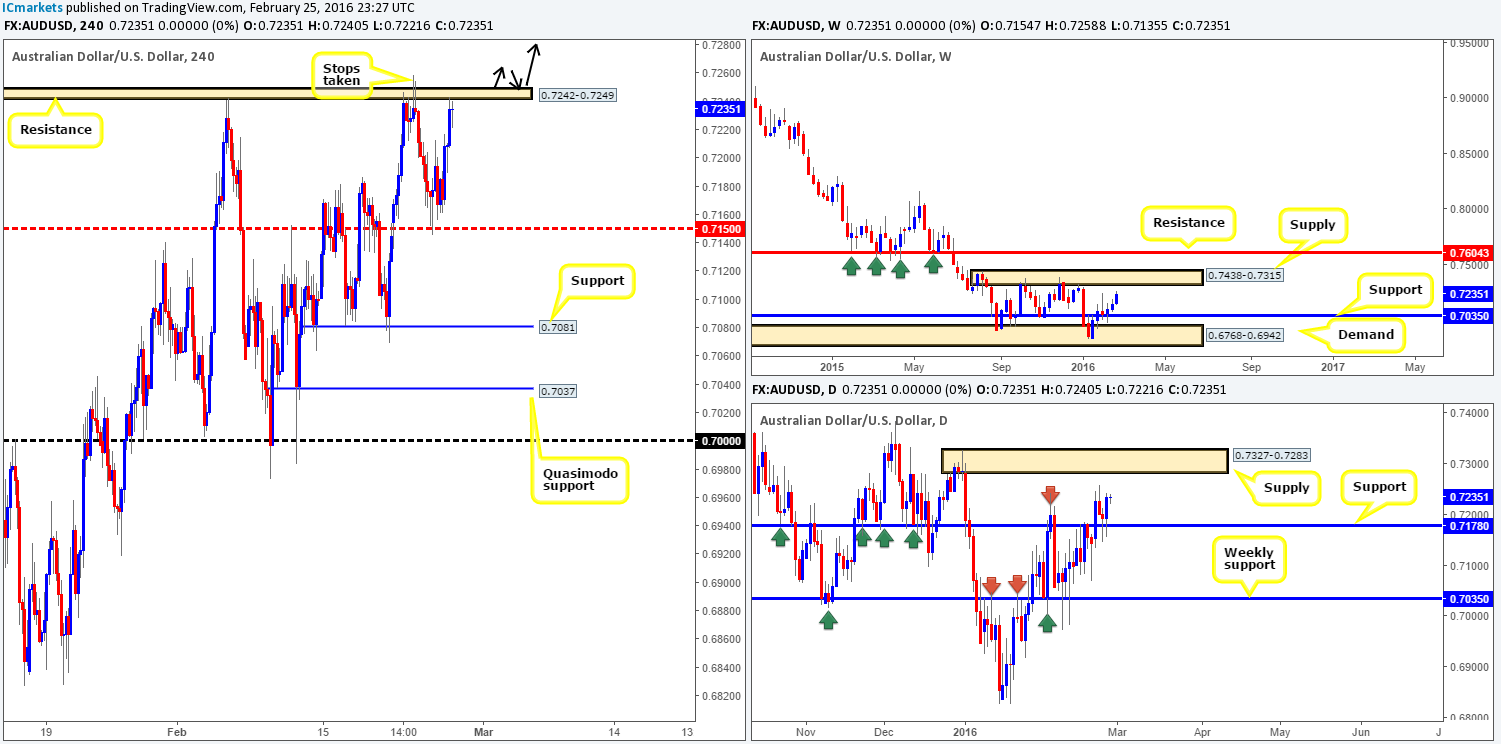
Beginning with the weekly timeframe this morning, we can see that there’s room for the commodity currency to advance up to supply drawn from 0.7438-0.7315, which has capped upside since August 2015. Climbing down into the daily chart, support at 0.7178 continues to be seen reinforcing this market, which may be enough to entice buyers to bring prices up to supply painted at 0.7327-0.7283. Moving down to the H4 chart, yesterday’s rally brought this market into the jaws of a weak-looking resistance area at 0.7242-0.7249. The reason for believing this zone to be weak comes from the stop run seen on Tuesday.
Although both the weekly and daily charts suggest further buying is on the horizon, there is not much space seen to trade on the H4 at present. Even with a close above and retest of the current resistance area (see black arrows), this would leave us with a mere thirty or so pips to play with until reaching the underside of daily supply at 0.7283. For a small intraday trade, this would be fine as long as one manages to get in with a relatively small stop of around 10-15 pips. Any more than this and your risk/reward would become less favorable.
Levels to watch/live orders:
- Buys: Watch for offers to be consumed around 0.7242-0.7249 and look to trade any retest seen thereafter (lower timeframe confirmation required).
- Sells: Flat (Stop loss: N/A).
USD/JPY:
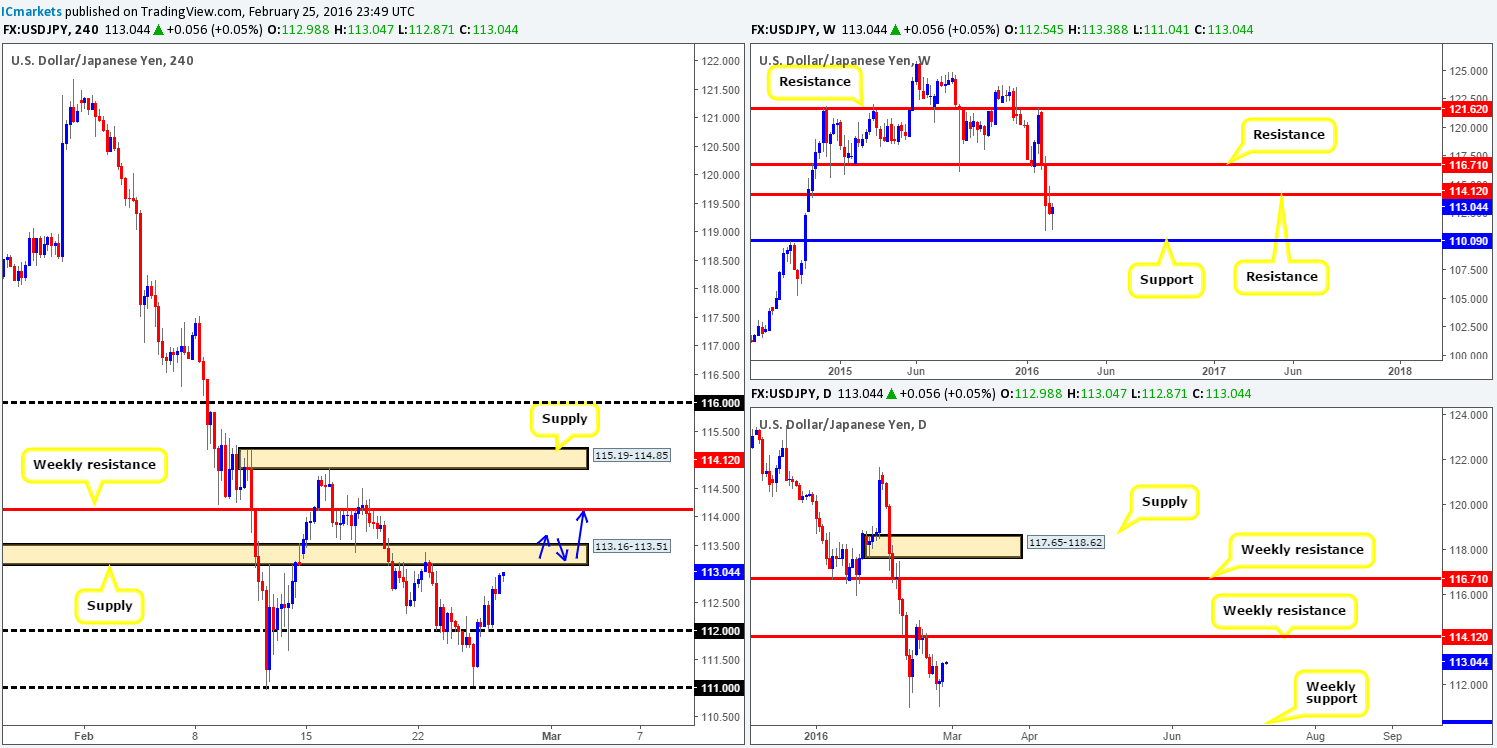
As can be seen from the daily chart, the bounce from the Feb 11th low 110.96 clearly renewed buying interest in this market yesterday. This could, as long as the buyers remain in the driving seat, force this pair to retest weekly resistance drawn from 114.12.
In our previous report (http://www.icmarkets.com/blog/thursday-25th-february-daily-technical-outlook-and-review/), we discussed two possible trade scenarios: One was to wait for price to close below psychological support 111.00 and look to trade the retest of this number down to weekly support at 110.09. The second was to wait for a close above and retest the 112.00 figure for a buy trade up to H4 supply at 113.16-113.51, followed closely by the aforementioned weekly resistance. We are kicking ourselves today as the latter played out perfectly with nice confirmation of buying strength seen on the M15 chart, and we missed it! Well done to any of our readers who took advantage of this move!
Once, or indeed if, price reaches the aforementioned H4 supply zone today, we will not be looking to short as the market may try to tag in offers at the weekly resistance level mentioned above. Instead, we’ll be watching for price to slightly close above this H4 area and retest it as demand. This would effectively be our cue to begin watching the lower timeframe action for an intraday buy up to the 114.00 region (see blue arrows).
Levels to watch/live orders:
- Buys: Watch for offers to be consumed around 113.16-113.51 and look to trade any retest seen thereafter (lower timeframe confirmation required).
- Sells: Flat (Stop loss: N/A).
USD/CAD:
Mid-way through London trading yesterday the USD/CAD took a rather brutal blow to the mid-section, as prices declined almost 200 pips in one fell swoop. Both 1.3700 and 1.3600 were wiped out during this assault, allowing price to close the day deep within H4 demand penciled in at 1.3516-1.3561.
Considering that the H4 approach is an ok-looking AB=CD bull pattern (see green arrows), and the fact that the H4 demand is also bolstered by a strong daily trendline extended from the low 1.1919, there is a good chance that this market will bounce from here today. Despite this, we still require the lower timeframes to confirm buying strength from this demand zone before risking capital on this idea for two reasons. Firstly, the weekly chart shows room to move lower down towards support visible at 1.3381. Secondly, a fakeout below the current demand zone to psychological support 1.3500 is possible, since this would take out a truckload of stops which could be used as liquidity for buying. Therefore, 1.3500 should also be on you watch list for a possible buy zone today!
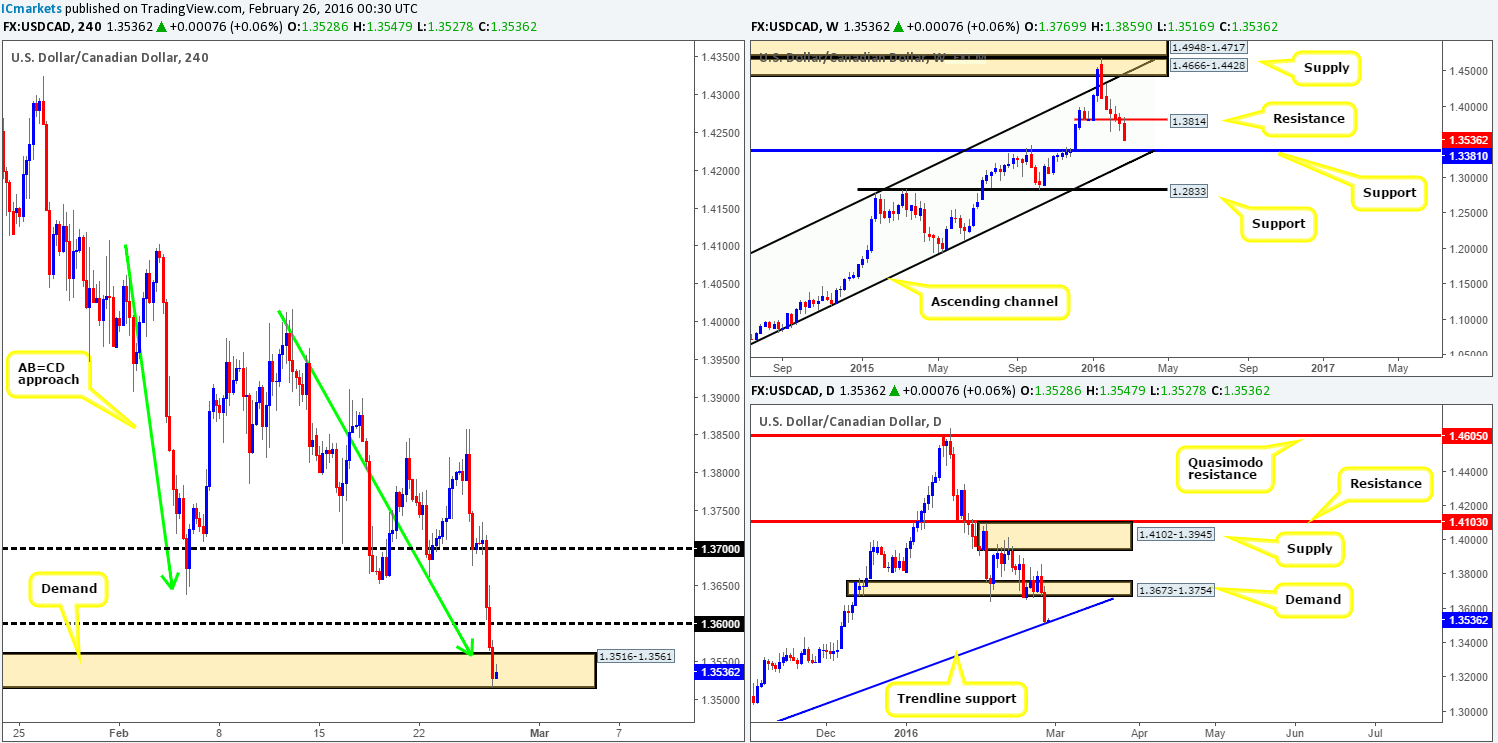
Levels to watch/live orders:
- Buys: 1.3516-1.3561 [Tentative – confirmation required] (Stop loss: dependent on where one confirms this area). 1.3500 [Tentative – confirmation required] (Stop loss: dependent on where one confirms this level).
- Sells: Flat (Stop loss: N/A).
USD/CHF:
During the course of yesterday’s sessions, H4 action aggressively whipsawed through psychological resistance 0.9900, which saw prices wrap up the day once again retesting the underside of 0.9900. As we can all see, selling interest is still clearly present around this region which could drag prices back down to H4 support at 0.9857 today. Be that as it may, we are not really interested in this H4 level as the more attractive area sits just below at 0.9800/0.9822 – a psychological support number coupled with a daily support level. In addition to this, on the H4 chart, the daily level is almost invisible with no converging H4 demand to give away its presence (unless of course one looks to the daily chart). Therefore, lot of breakout sellers from below the H4 support would likely get burned here if they focus purely on one timeframe.
Although there is an extremely high chance of a bounce from the 0.9800/0.9822 region, we will not be placing pending orders here since a fakeout through the zone is highly likely. Waiting for price to confirm stability before risking capital is, at least in our opinion, the best course of action to take.
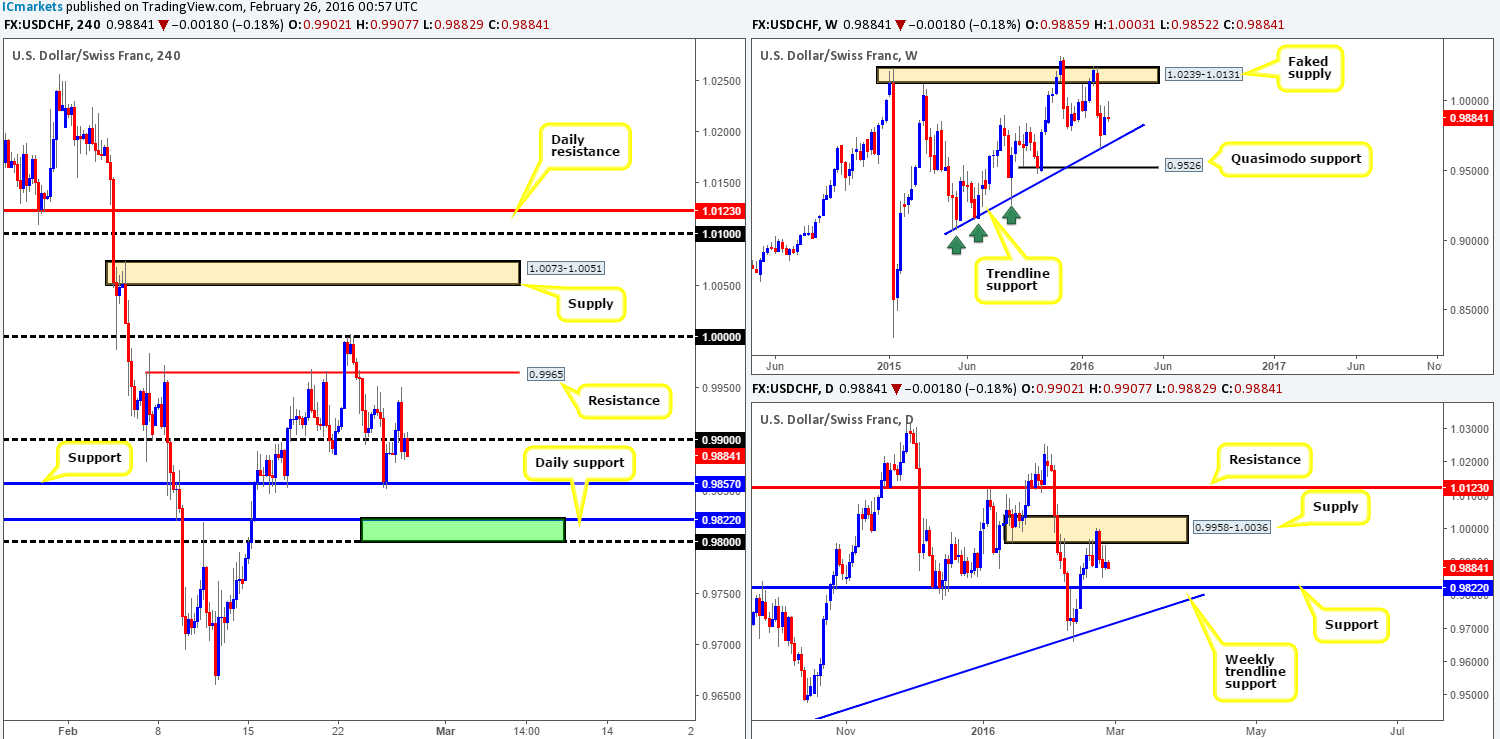
Levels to watch/live orders:
- Buys: 0.9800/0.9822 [Tentative – confirmation required] (Stop loss: dependent on where one confirms this area).
- Sells: Flat (Stop loss: N/A).
DOW 30:
In recent sessions, the DOW market found support around the 16470 mark and continued bouncing from this region until the U.S. opened its doors for business, which followed with price catapulting itself above a H4 Quasimodo resistance level at 16593.
As we mentioned in yesterday’s report, a close above this line would effectively be a cue to begin watching for price to retest this barrier as support for a potential buy trade up to H4 supply at 17009-16905. Reason being is the weekly chart shows a clear path north up to a minor weekly resistance at 16935, which is encapsulated by the aforementioned H4 supply. Additionally, a daily close above the daily resistance area (now support) at 16625-16435 was seen yesterday, which in our estimation, adds more weight to a continuation move up to the minor weekly resistance level.
Therefore, ALL eyes will be on the 16593 level for confirmed longs today (see green arrows). Waiting for confirmation here before taking action is our more preferred entry here, as it will likely save us from an unnecessary loss due to a fake lower which is likely to take place before the bulls step in.
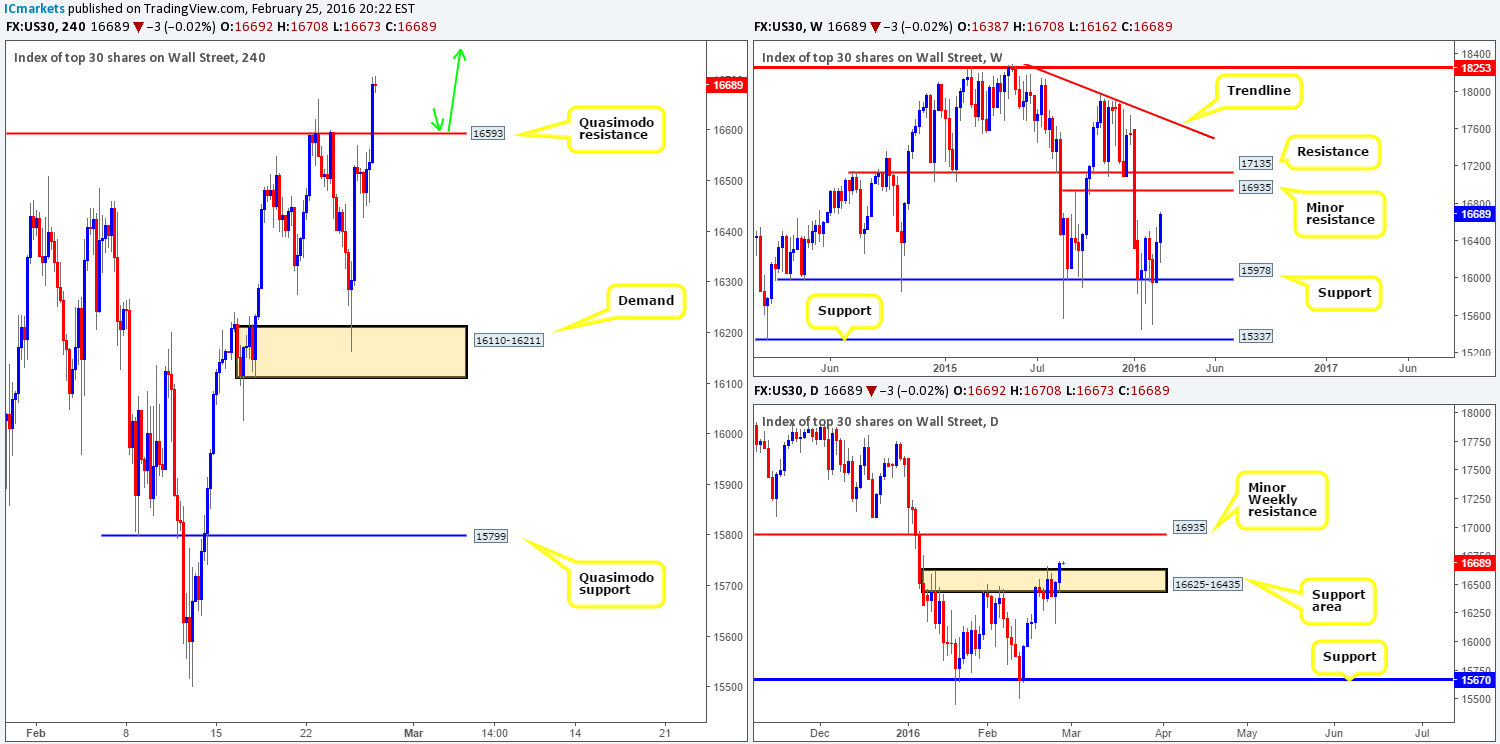
Levels to watch/live orders:
- Buys: 16593 [Tentative – confirmation required] (Stop loss: dependent on where one confirms this level).
- Sells: Flat (Stop loss: N/A).
XAU/USD: (Gold)
Yesterday’s action in the Gold market was relatively mellow in comparison to past days. Although the yellow metal recorded a small increase in value, price fell into a tight consolidation between 1241.1/1232.8. Given this rather lackluster performance, Thursday’s outlook for this unit remains valid:
Weekly flow continues to be bid from the weekly demand at 1205.6-1181.2, which boasts a broken weekly wedge resistance (now support) taken from the high 1485.3. From here, there’s little in the way of resistance until price crosses paths with supply taken from 1307.4-1280.0. Branching lower to the daily chart, Gold continues to loiter mid-range between demand at 1181.4-1200.7 and supply overhead at 1273.9-1260.2. A break above this supply will land one within touching distance of the weekly supply area mentioned above, whilst a break below places weekly support 1157.4 back in view.
Given that price is trading from a weekly buy zone right now, we still favor the buy-side of this market for the time being. That being the case, all eyes will be on the following H4 areas today:
- The demand at 1200.6-1207.8, which sits on top of the daily demand mentioned above at 1181.4-1200.7.
- On the assumption that the above area caves in, the next buy zone can be seen at 1181.4-1187.4 – another demand which happens to be positioned within the extreme of the above said daily demand.
Both areas are high-probability in our opinion. The higher of the two may see a small fakeout, however, since this area has already been visited, so we’d advise waiting for the lower timeframes to confirm this zone before risking capital. The lower of the two demands is also open to a fakeout due to the broken H4 Quasimodo line lurking just below it at 1179.3. One could trade this zone at market if they are fine with placing their stops below this Quasimodo line. If not, it might be best to go with the safe option and trade only upon pinning down a lower timeframe buy set up.
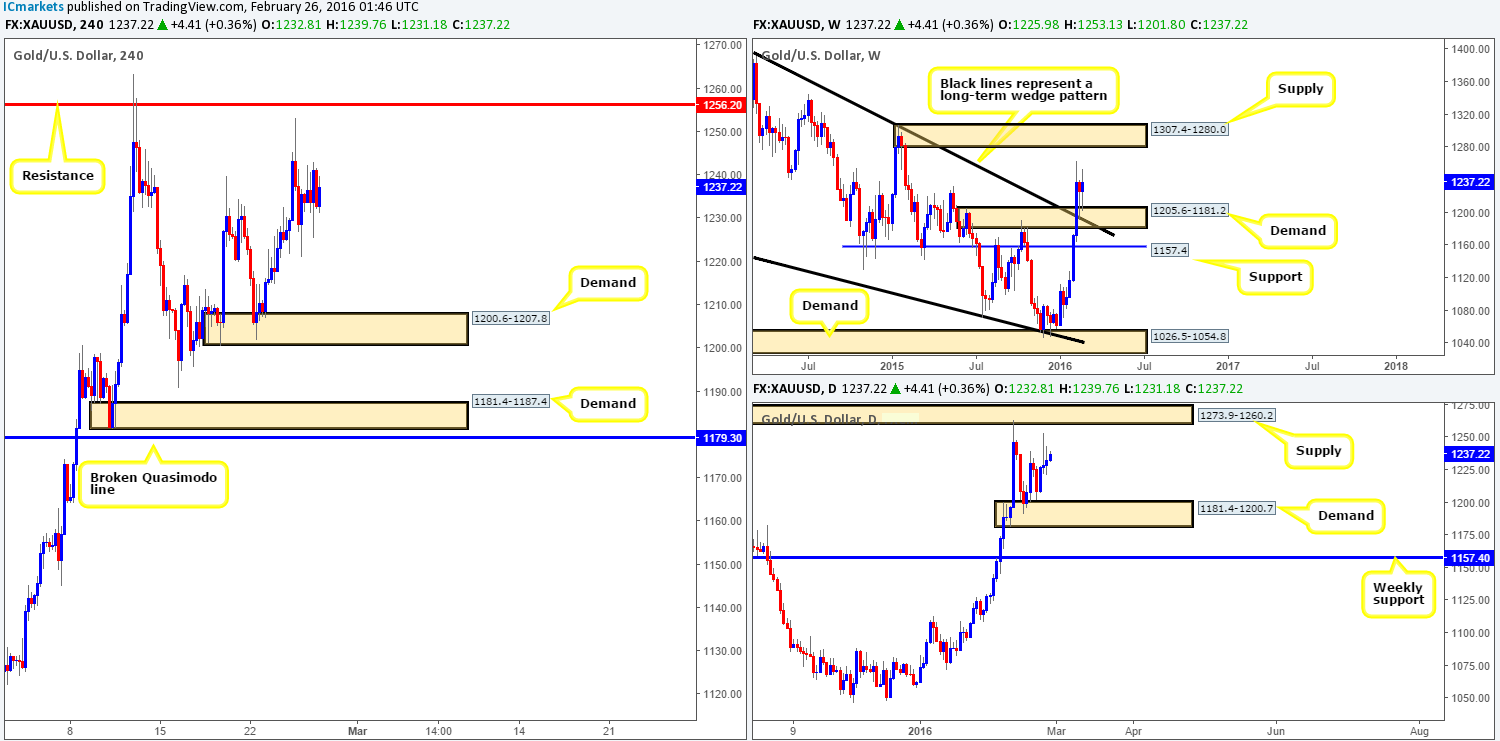
Levels to watch/live orders:
- Buys: 1200.6-1207.8 [Tentative – confirmation required] (Stop loss: dependent on where one confirms this area). 1181.4-1187.4 [Tentative – confirmation required] (Stop loss: dependent on where one confirms this area).
- Sells: Flat (Stop loss: N/A).


