Waiting for lower timeframe confirmation is our main tool to confirm strength within higher timeframe zones, and has really been the key to our trading success. It takes a little time to understand the subtle nuances, however, as each trade is never the same, but once you master the rhythm so to speak, you will be saved from countless unnecessary losing trades. The following is a list of what we look for:
- A break/retest of supply or demand dependent on which way you’re trading.
- A trendline break/retest.
- Buying/selling tails/wicks – essentially we look for a cluster of very obvious spikes off of lower timeframe support and resistance levels within the higher timeframe zone.
- Candlestick patterns. We tend to stick with pin bars and engulfing bars as these have proven to be the most effective.
We typically search for lower-timeframe confirmation between the M15 and H1 timeframes, since most of our higher-timeframe areas begin with the H4. Stops are usually placed 1-3 pips beyond confirming structures.
EUR/USD:
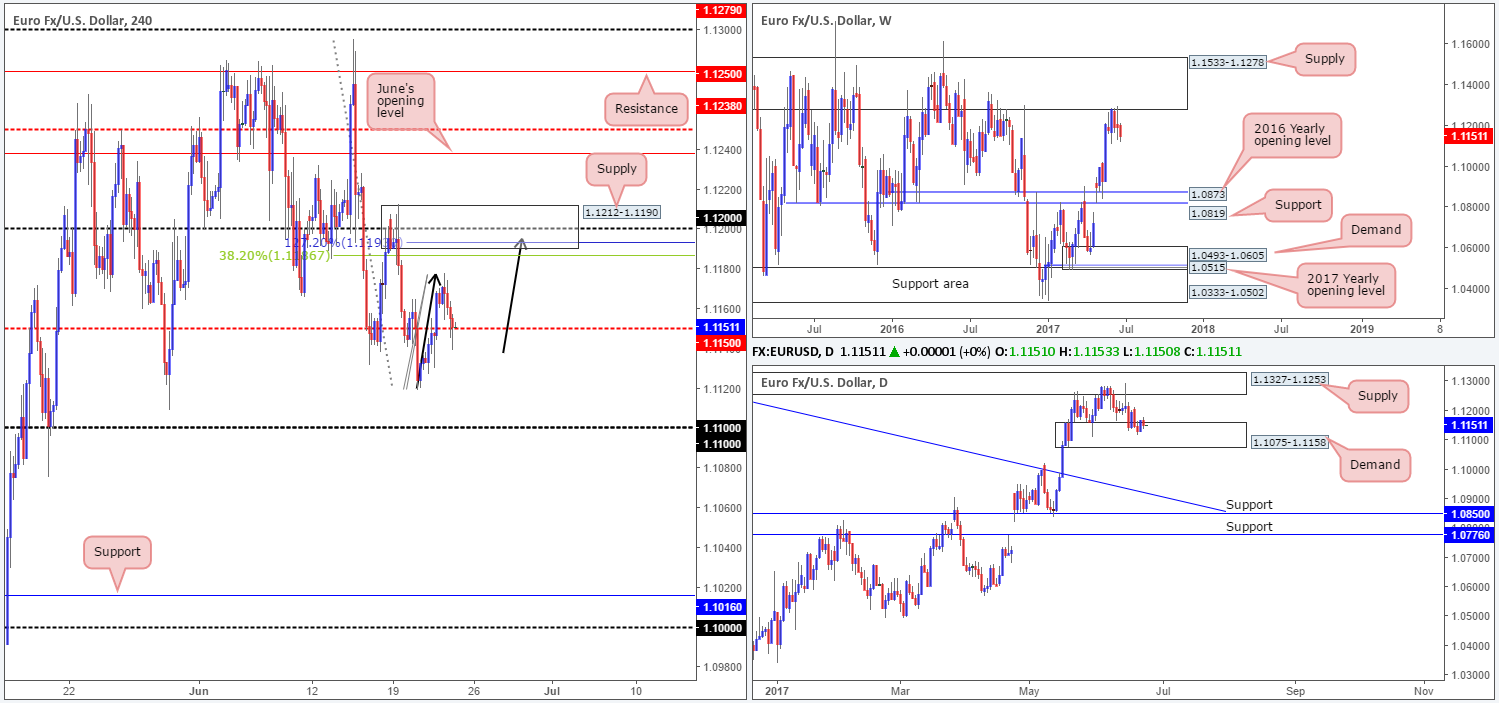
For the most part it was a relatively quiet session on Thursday. The H4 candles failed to sustain gains beyond the 1.1170 mark, and concluded the day printing a bullish buying tail off the mid-level support at 1.1150. According to the daily timeframe, which happens to be trading within the walls of a demand area coming in at 1.1075-1.1158, 1.1150 may well hold as support today and force the unit to challenge the 1.12 neighborhood.
Should our analysis be correct, and price does indeed rally to connect with 1.12, our team would be interested in shorting from this region. 1.12 is encapsulated by a H4 supply noted at 1.1212-1.1190, as well as being positioned a few pips above a H4 AB=CD 127.2% ext. at 1.1193 taken from the low 1.1119 and is also located nearby a H4 38.2% Fib resistance planted at 1.1186 extended from the high 1.1295. In addition to this, we also see weekly sellers continue to reflect a strong bearish stance from the underside of a major weekly supply at 1.1533-1.1278.
Our suggestions: The question is, would we be comfortable selling knowing that price is coming from daily demand? For us personally, we’d need to see additional confirmation present itself. A reasonably sized H4 bearish candle, preferably a full-bodied candle, would be ideal. The first take-profit target from here would be the 1.1150 line.
Data points to consider: Eurozone manufacturing between 8-9am. US New home sales at 3pm, followed by FOMC member Powell speaking at 7.15pm GMT+1.
Levels to watch/live orders:
- Buys: Flat (stop loss: N/A).
- Sells: 1.12 region ([waiting for a reasonably sized H4 bear candle – preferably a full-bodied candle – to form before pulling the trigger is advised] stop loss: ideally beyond the candle’s wick).
GBP/USD:
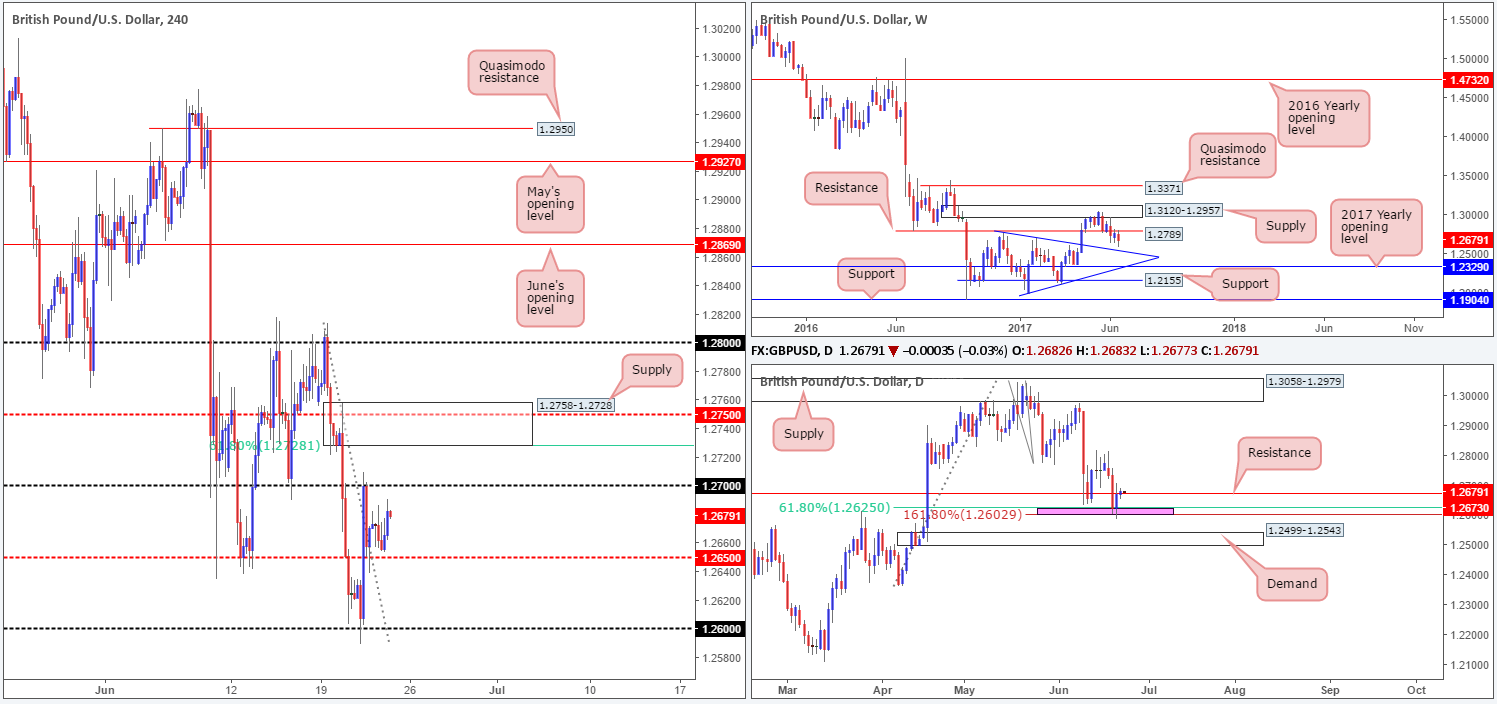
In a similar fashion to the EUR/USD, the GBP/USD was also relatively subdued on Thursday, ranging all of 37 pips on the day. Daily action, as you can see, remains teasing the resistance level pegged at 1.2673. Weekly price on the other hand, still shows room to extend down to a trendline support taken from the high 1.2774 that happens to intersect with a daily demand seen below the two daily Fib levels (area marked in pink at 1.2602/1.2625) at 1.2499-1.2543.
Our suggestions: Consequent to yesterday’s lackluster performance, our outlook remains unchanged:
While a great deal of traders will be eyeing the 1.27 handle for shorts today, we’re looking at the H4 supply seen above at 1.2758-1.2728. Not only does it hold a H4 mid-level resistance level at 1.2750, it also boasts a 61.8% H4 Fib resistance at 1.2728 taken from the high 1.2814. Furthermore, the stops planted above 1.27 will help provide the big boys liquidity to sell into! An ideal setup would be for a H4 selling wick to pierce through 1.27 (taking out the stops), attack the underside of the said H4 supply and then close back below 1.27. This would, for us, permit a short entry, targeting 1.2650 as an initial take-profit level.
Data points to consider: US New home sales at 3pm, followed by FOMC member Powell speaking at 7.15pm GMT+1.
Levels to watch/live orders:
- Buys: Flat (stop loss: N/A).
- Sells: 1.2758-1.2728 ([waiting for a reasonably sized H4 bear candle – preferably a full-bodied candle – to form before pulling the trigger is advised] stop loss: ideally beyond the candle’s wick).
AUD/USD:
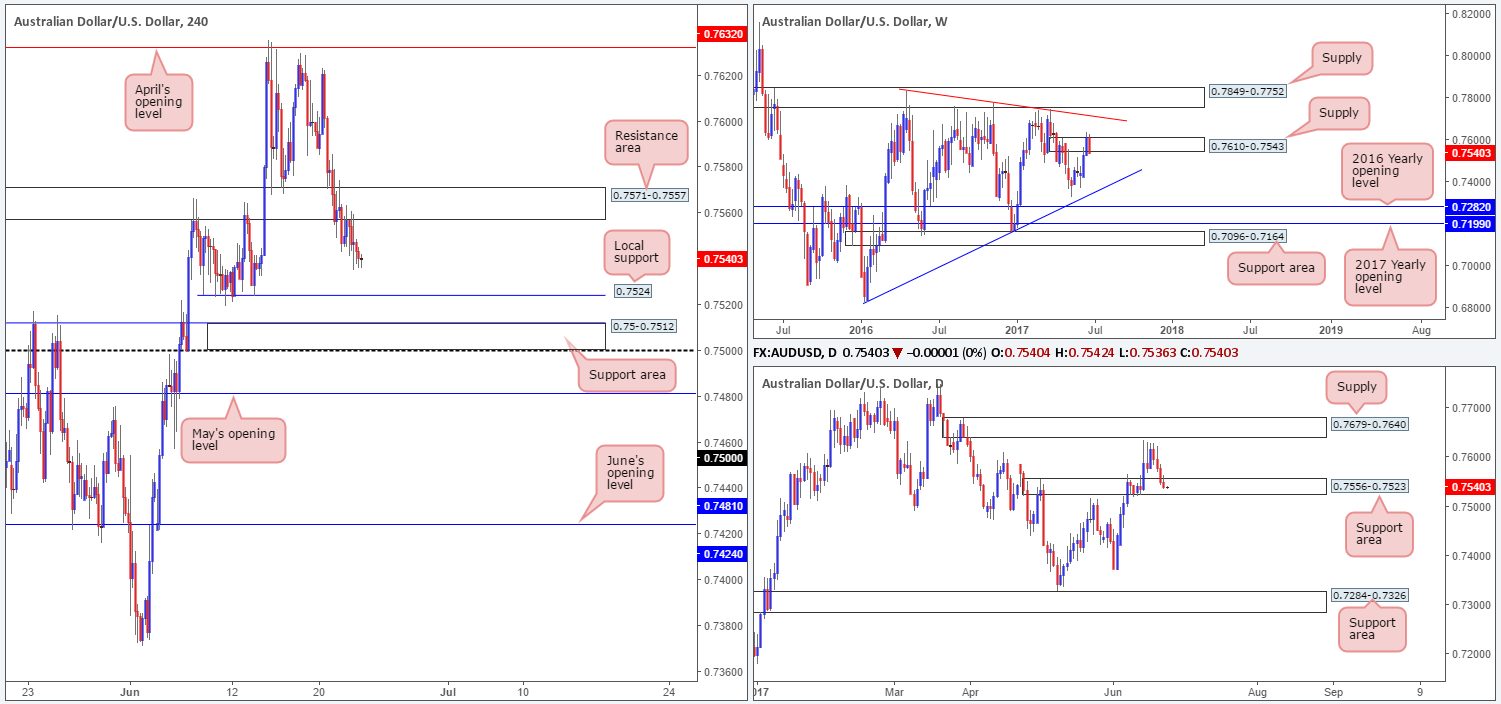
AUD/USD bears, as you can see, continued to press lower in recent trading, consequently recording a fourth consecutive daily bearish candle. The upshot to this was the H4 resistance area at 0.7571-0.7557 was confirmed as a valid zone, the weekly supply at 0.7610-0.7543 was very likely victim of a fakeout last week and the current daily support area at 0.7556-0.7523 may give way in today’s segment.
Although the above signals shorts may be the best bet, we are not comfortable with the current daily support area! What’s more, there’s not a great deal of room for the H4 candles to trade lower given the next hurdle below sits at 0.7524: a local H4 support, shadowed closely by a H4 support area at 0.75-0.7512.
Our suggestions: Right now, our desk does not see a lot to hang our hat on at the moment. As such, remaining flat until more conducive price action presents itself is the route we’ve chosen to take.
Data points to consider: US New home sales at 3pm, followed by FOMC member Powell speaking at 7.15pm GMT+1.
Levels to watch/live orders:
- Buys: Flat (stop loss: N/A).
- Sells: Flat (stop loss: N/A).
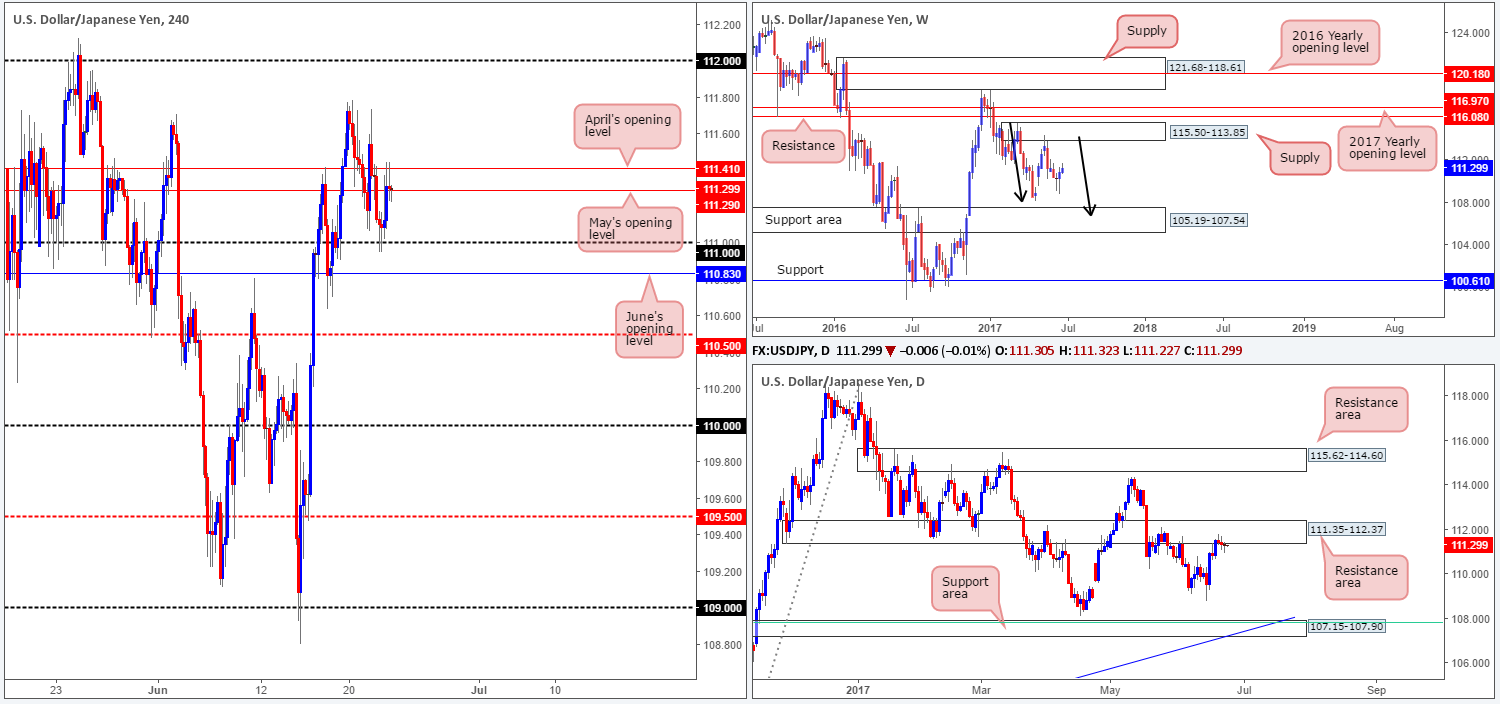
USD/JPY:
The USD/JPY ran into a strong pocket of bids around the 111 handle amid Thursday’s sessions, resulting in the unit gravitating up to April/May’s opening levels at 111.41/111.29, which for now is holding firm. Technically speaking, a decisive close above these monthly levels is unlikely. Our reasoning lies within the higher-timeframe structure. On the weekly timeframe, we still feel that bears remain in a relatively strong position after pushing aggressively lower from supply registered at 115.50-113.85. We know there’s a lot of ground to cover here, but this move could possibly result in further downside taking shape in the form of a weekly AB=CD correction (see black arrows) that terminates within a weekly support area marked at 105.19-107.54 (stretches all the way back to early 2014). Additionally, daily flow remains trading around the underside of a resistance area at 111.35-112.37.
Our suggestions: Does the above justify a short position from 111.41/111.29? Not necessarily. Generally, we like to see space for price to stretch its legs when we enter into a trade. In this scenario, the nearby 111 handle, followed closely by June’s opening level at 110.83 could throw a spanner in the works and halt selling, potentially placing one in drawdown. Without clear room to run, we’re going to pass on shorting 111.41/111.29 today.
Data points to consider: US New home sales at 3pm, followed by FOMC member Powell speaking at 7.15pm GMT+1.
Levels to watch/live orders:
- Buys: Flat (stop loss: N/A).
- Sells: Flat (stop loss: N/A).
USD/CAD:
Kicking this morning’s analysis off with a look at the weekly timeframe, we can see that demand at 1.3223-1.3395 is holding on by a thin thread at the moment. In the event that the bears remain dominant here, odds are that the demand base pegged below at 1.3006-1.3115, which happens to intersect with a trendline support extended from the high 1.1278, will see some action. The story on the daily chart, however, continues to be bolstered by a support level penciled in at 1.3212. A decisive push below this line could lead to a move being seen down to demand at 1.3050-1.3103 (housed within the weekly demand mentioned above at 1.3006-1.3115).
Earlier in the week, the 1.32 boundary seen on the H4 chart was a prime location to hunt for long opportunities. However, we do not believe this to be the case right now. Buyers situated at the current daily support are likely weakened, and on top of this, we have a very fragile-looking weekly demand in play at the moment (see above).
Our suggestions: With the above notes in mind, our desk will be watching for H4 price to close below 1.32 today. This – coupled with a retest and a reasonably sized H4 bearish candle would, in our opinion, be enough to consider selling this pair, targeting the top edge of the weekly demand at 1.3115.
Data points to consider: US New home sales at 3pm, followed by FOMC member Powell speaking at 7.15pm. Canadian inflation figures at 1.30pm GMT+1.

Levels to watch/live orders:
- Buys: Flat (Stop loss: N/A).
- Sells: Watch for H4 price to engulf 1.32 and then look to trade any retest seen thereafter ([waiting for a reasonably sized H4 bear candle to form following the retest is advised] stop loss: ideally beyond the candle’s wick).
USD/CHF:
Since the 15th June, the H4 candles have been consolidating between the 0.97 handle and the 0.9774/0.9750 area (comprised of a H4 resistance level at 0.9774, a H4 trendline resistance etched from the low 0.9691 and a H4 mid-level resistance drawn from 0.9750). Over on the daily chart, price is currently trading between a weekly Quasimodo support level at 0.9639 and a daily supply base coming in at 0.9825-0.9786.
Our suggestions: Unless you fancy trying your luck at trading the current H4 range edges today, which holds absolutely no connection to the higher timeframes, we believe it may be best to remain flat today. Typically, our team requires two things to trade: H4 confluence and higher-timeframe convergence. Without both, we rarely execute a trade.
Data points to consider: US New home sales at 3pm, followed by FOMC member Powell speaking at 7.15pm GMT+1.

Levels to watch/live orders:
- Buys: Flat (stop loss: N/A).
- Sells: Flat (stop loss: N/A).
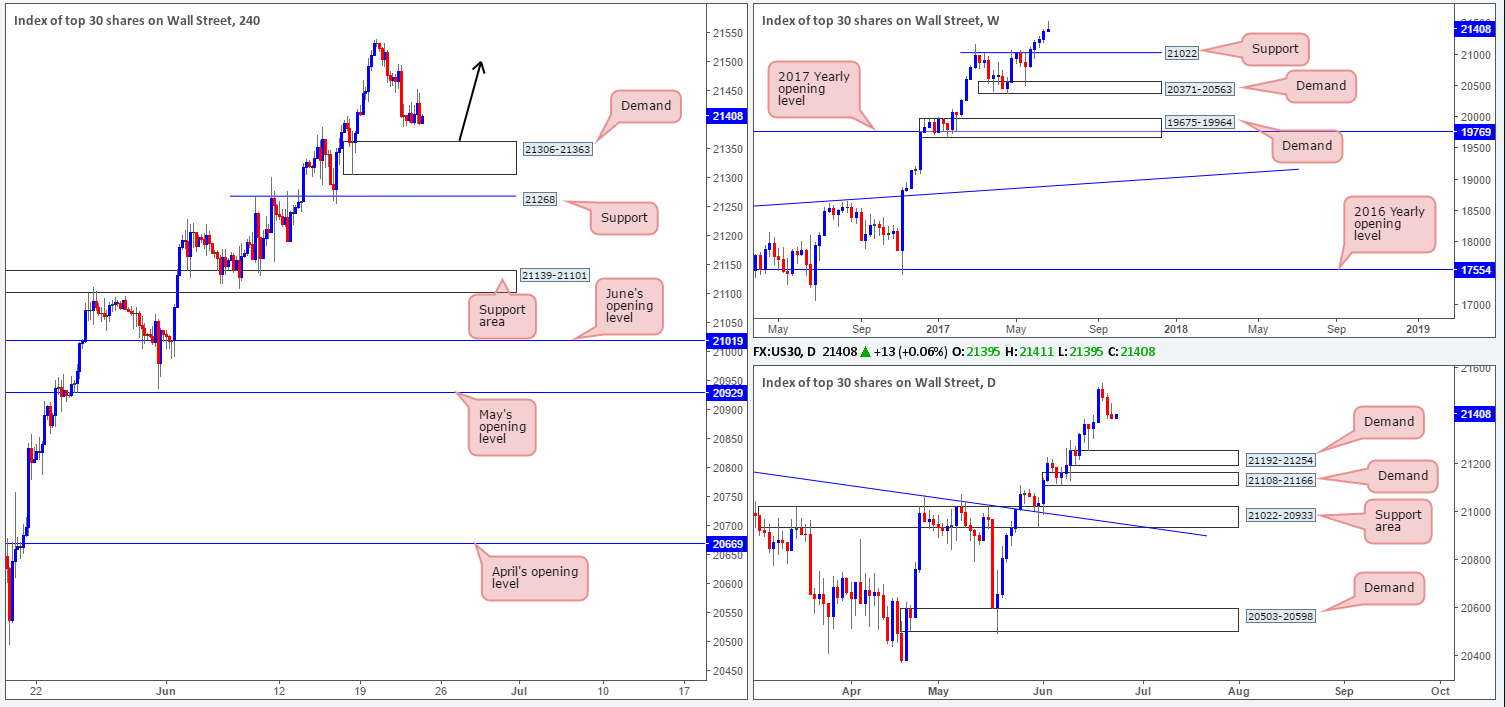
DOW 30:
US equities saw little change during yesterday’s trading, as the unit remains hovering just ahead of a H4 demand drawn from 21306-21363. For those who follow our analysis on a regular basis, you may recall that our desk is currently long from 21164. 50% of that position was quickly liquidated at 21234, with the remaining 50% left in the market to run since we intend on trailing this trend long term. The stop-loss order is currently positioned below the said H4 demand at 21298, as we believe this to be the safest area for the time being.
Our suggestions: Should price challenge 21306-21363 today, and is reinforced by a full or near-full-bodied bullish candle, we may look to add to our current position (as per the black arrows) and trail accordingly.
Data points to consider: US New home sales at 3pm, followed by FOMC member Powell speaking at 7.15pm GMT+1.
Levels to watch/live orders:
- Buys: 21164 ([live] stop loss: 21298). 21306-21363 ([waiting for a reasonably sized H4 bull candle – preferably a full-bodied candle – to form before pulling the trigger is advised] stop loss: ideally beyond the candle’s tail).
- Sells: Flat (stop loss: N/A).
GOLD:
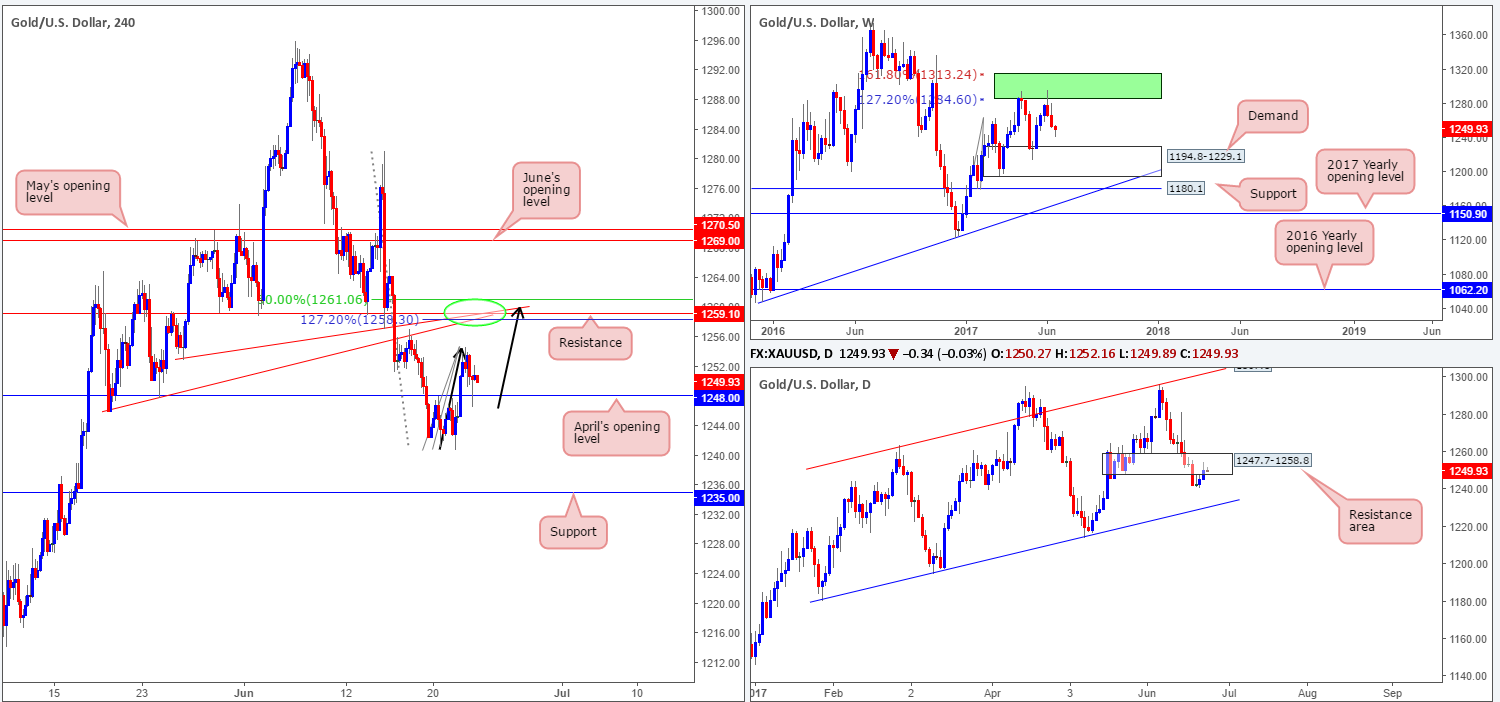
Similar to the EUR/USD, a market that tends to correlate well with the price of gold, the yellow metal shows a possible H4 AB=CD bearish correction at hand. The bounce from April’s opening level at 1248.0 formed a potential C-leg, and could lead to price rallying today and touching gloves with the H4 AB=CD 127.2% ext. point at 1258.3. Not only do we have this, but we also have a nearby merging H4 resistance at 1259.1, two H4 trendline resistances taken from lows of 1245.9/1252.9 and a H4 50.0% retracement value at 1261.0.
Also noteworthy is that this H4 resistance level at 1259.1 is planted just above a daily resistance area pegged at 1247.7-1258.8. And alongside this, we also see that weekly price shows room to extend down to demand at 1194.8-1229.1.
Our suggestions: The confluence surrounding the H4 resistance mentioned above at 1259.1 is, we believe, enough to justify a short position. With that being said, however, we would only consider this a valid sell zone if, and only if, a reasonably sized H4 bearish candle took shape from here. This will help avoid an unnecessary loss and also help sidestep any fakeout that may be seen given that the sell zone (1261.0/1258.3) is relatively small.
Levels to watch/live orders:
- Buys: Flat (stop loss: N/A).
- Sells: 1259.1 region ([waiting for a reasonably sized H4 bear candle – preferably a full-bodied candle – to form before pulling the trigger is advised] stop loss: ideally beyond the candle’s wick).