EUR/USD:
Weekly view: Very little has changed since our last visit to this timeframe, as the buyers and sellers continue to battle for position a few pips from above the weekly swap level coming in at 1.1051.
Daily view: A closer look on the daily scale shows that buyers attempted to rally the market higher yesterday from just above a daily swap area seen at 1.1051-1.0918. This rally was relatively short lived as bearish pressure came into the market around the recently broken 4hr support – turned resistance at 1.1143.
4hr view: From this angle, we can see that during yesterday sessions, price retested 1.1100 as support, and has so far held the market higher. For those who read our previous report, you may recall us mentioning that if price could convincingly retest this number as support, we would begin watching for lower timeframe buying confirmation. From the 15 minute scale, price has, in our opinion, shown a potential buy area in the form of a 15 minute Quasimodo support level at the 1.1086 zone. If price does indeed visit this 15-minute area of support today, and depending on the approach/ time of day, we may consider taking a long position from here. Should all go to plan, we’d first look towards 1.1150 as our first potential trouble area (positioned only 7 pips above the aforementioned daily support – turned resistance level) which if hit, will be where we move our stop-loss order to breakeven. Ultimately though, we have our eye on 1.1200 to take full profits.

Levels to watch/live orders:
-
Buys: 1.1086 area [dependent on how price approaches this number] (Predicative stop-loss orders seen at: 1.1073).
-
Sells: Flat (Predicative stop-loss orders seen at: N/A).
GBP/USD:
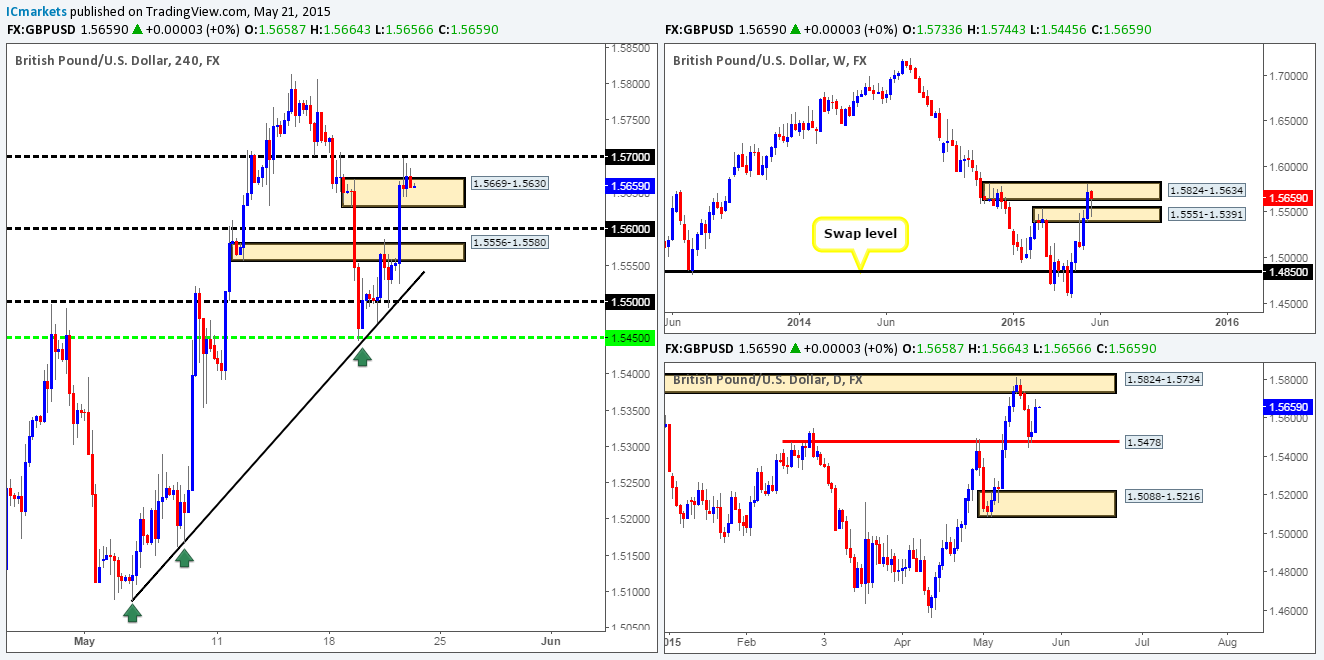
Weekly view: The reaction from the weekly supply area at 1.5824-1.5634 has not really produced much so far. Weekly demand seen just below it in the form of a weekly swap area at 1.5551-1.5391 made sure of that!
Daily view: The rebound from the ignored daily Quasimodo level at 1.5478 extended higher during yesterday’s session, consequently closing for the day (1.5658) 70 or so pips below a daily resistance barrier coming in at 1.5824-1.5734.
4hr view: The London open saw price rocket north, consequently taking out several 4hr technical areas in the process. It is only since price collided with the 1.5700 region, did we see any noteworthy selling interest.
Price action is tricky on the 4hr timeframe from where we’re sitting. On the one hand, the weekly timeframe shows price trading back into weekly supply from a recent pathetic attempt at lower prices – the daily timeframe indicates that there is room for prices to continue advancing north (see above), and the 4hr timeframe is saying SHORT! Our idea behind the 4hr timeframe suggesting that the market may decline in value today simply comes from the recent candle action around the 1.5700 number. Check out the three wicks: 1.5698/1.5691/1.5684. Each time, the bulls could not form a higher high with the final candle closing near its lows at 1.5658. As such, we believe, that the sellers could be in control, and that an intraday push down to 1.5600 may be in store today. With all of the above taken on board, our team has decided to short at market (1.5658), with1.5600 as our final take-profit target. If our intraday analysis is correct, price should not trade above the high 1.5684…
Levels to watch/ live orders:
-
Buys: Flat (Predicative stop-loss orders seen at: N/A).
-
Sells: 1.5658 [LIVE] (Predicative stop-loss orders seen at: 1.5686).
AUD/USD:
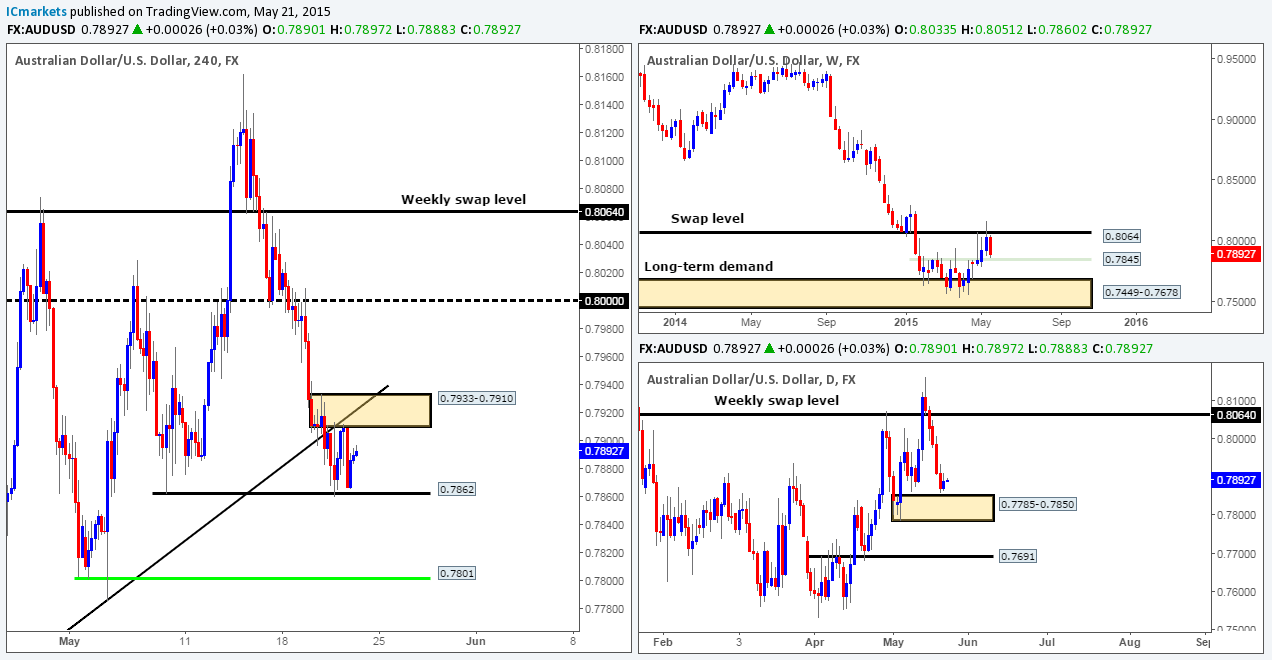
Weekly view: The recent selling on this timeframe has placed the market within touching distance of a weekly swap level at 0.7845. Across the board, the trend on this pair is still firmly pointing south. This will, in our opinion, not likely change until a convincing push above the weekly swap level 0.8064 takes place.
Daily view: From this angle, we can see that the recent downward momentum appears to be crumbling a few pips above a daily demand area seen at 0.7785-0.7850 (surrounds the weekly swap level mentioned above at 0.7845).
4hr view: For the time being the AUD/USD pair seems to be consolidating in between 0.7862 and a 4hr supply area seen at 0.7933-0.7910, which, as you can probably see, converges nicely with a recently broken trendline extended from the low 1.0781.For range traders wishing to take part in between the aforementioned limits, we’d strongly recommend only risking capital once lower timeframe price action confirmation has been seen.
Given that price is trading so close to support/demand on the higher timeframes at the moment (see above), price, in our opinion, has a higher probability of breaking above the small 4hr consolidation. However, our team believes in being prepared for anything that the market can throw at us. So, yes, a break above this consolidation could very well take place today, and if it does, and price retests this area of demand with supporting lower timeframe confirmation, we’d confidently take a long position here, targeting the 0.8000 area.
Nevertheless, In the event that further selling takes place, and 0.7862 is violated, shorting this break could be a risky move. The reason being is by shorting there, we would effectively be trading into higher timeframe areas of demand, and the break below 0.7862 could just simply be a fakeout to trade higher. If, however, price does sell off from a break of 0.7862 and manages to hit the 4hr Quasimodo support level seen in green at 0.7801, we would be very interested in trading this level long for the following reasons:
-
Located just below the weekly swap level 0.7845.
-
Positioned deep in the heart of a daily demand area seen at 0.7785-0.7850.
-
Converging round-number support at 0.7800.
One could, if they so wished, simply place a pending buy order just above this level at 0.7803, and set a stop just below the DAILY demand zone (0.7785-0.7850) at 0.7770. However, if you’re conservative, like us, you may wish to wait for the lower timeframes to prove buying strength exists here before jumping in.
Levels to watch/ live orders:
-
Buys: Flat (Predicative stop-loss orders seen at: N/A).
-
Sells: Flat (Predicative stop-loss orders seen at: N/A).
USD/JPY:
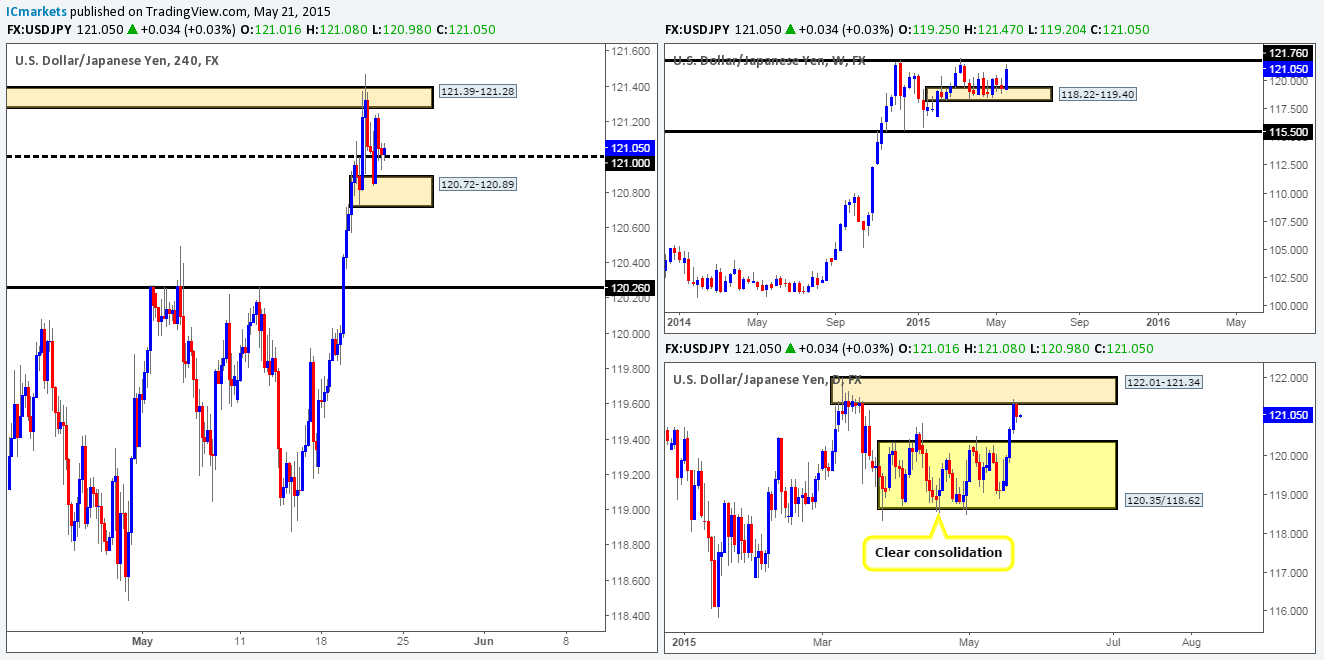
Weekly view: The weekly timeframe shows that price is now trading only a stone’s throw away from the weekly Quasimodo resistance level coming in at 121.76.
Daily view: From this angle, we can see that the sellers have recently made an appearance around the lower limits of the daily supply area seen at 122.01-121.34, which, if you look back to the weekly timeframe, you’ll notice that this daily zone surrounds the aforementioned weekly Quasimodo resistance level.
4hr view: Following Wednesday’s clear break above 4hr supply at 121.39-121.28, we can see that price did in fact sell off. This move took out round-number support at 121.00, which in turn saw price hit, and respect a 4hr demand area seen at 120.72-120.89. As you can see, the buyers were relatively strong from here, resulting in price pushing back above 121.00, which is, at the time of writing, being retested as support.
This may sound a little crazy considering higher-timeframe supply is looming just above (see above), but we believe if the 121.00 area holds firm today, we could be in for a further advance. Let us explain our thinking behind this idea… Buy stops were, as mentioned in the previous analysis, likely triggered in the push above the aforementioned 4hr supply zone, potentially clearing the path north up to extreme 4hr resistance level seen at 121.83 – very close to the weekly Quasimodo resistance level mentioned above, and located extremely deep within the aforementioned daily supply area. The reason we believe the path north to be clear up to 4hr resistance level simply comes from looking to the left. We invite you to scroll back to mid-March – just above the current 4hr supply area you can see what we like to call ‘supply consumption wicks’ at 121.50/121.55/121.66. These wicks indicate supply/sell orders have likely already been consumed as price continued to trade south, thus once/if price action came close to this zone again, it’s likely to be a relatively weak area of resistance.
Therefore, should we see a respectable buy signal on the lower timeframes around 121.00 today; a long position will be taken since the risk/reward is extremely favorable here.
Levels to watch/ live orders:
-
Buys: 121.00 [Tentative – confirmation required] (Predicative stop-loss orders seen at: dependent on where one confirms this level).
-
Sells: Flat (Predicative stop-loss orders seen at: N/A).
USD/CAD:
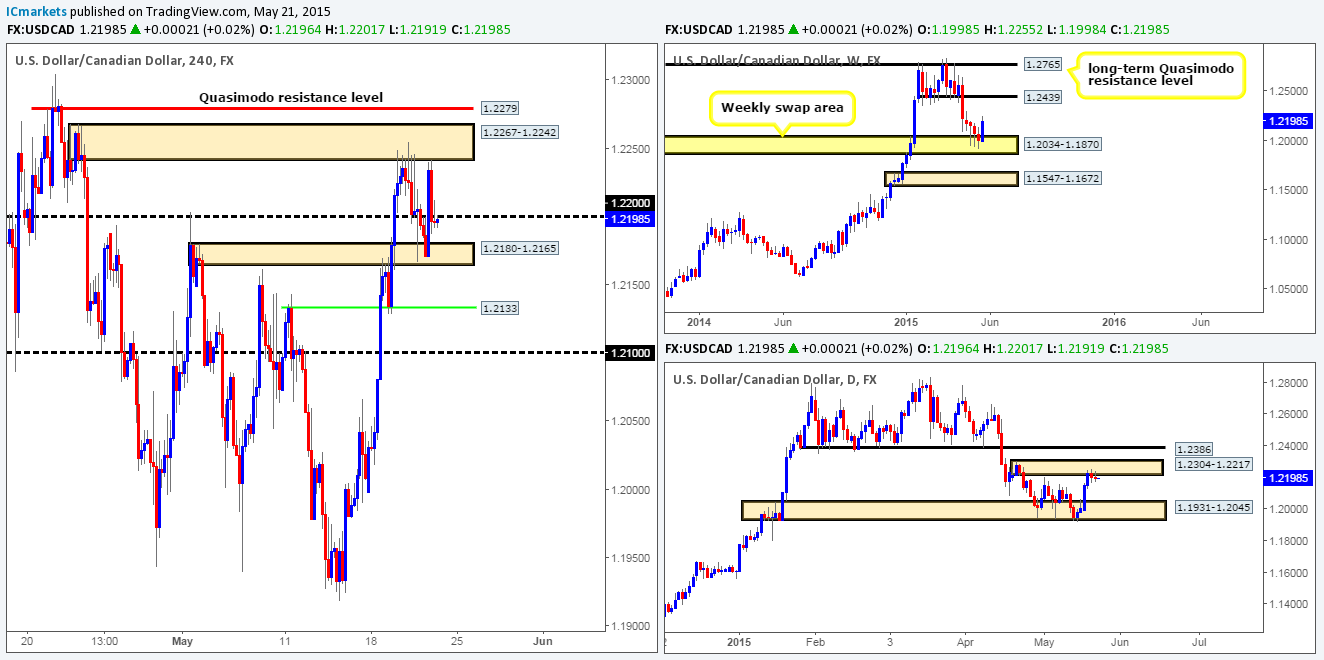
Weekly view: Contrary to the bearish price action we’ve recently been seeing around the weekly swap area at 1.2034-1.1870 over the past few weeks, strong buying has begun coming into the market this week. Assuming that the buyers can continue with this tempo, we may see price challenge the weekly swap level seen above at 1.2439.
Daily view: The daily timeframe shows that hesitation is being seen by both sides of the market around the lower limits of a daily supply area coming in at 1.2304-1.2217.
4hr view: The 4hr timeframe shows price is currently trading between a 4hr supply area at 1.2267-1.2242 and a 4hr swap area seen at 1.2180-1.2165, with the 1.2200 handle providing a midpoint to this temporary 4hr consolidation.
This pair, in our opinion, is a bit of nightmare to trade at the moment… If one attempts to trade between the two 4hr areas just mentioned above, they run the risk of 1.2200 coming in as support/resistance and potentially causing drawdown, or even worse, a loss.
On the other hand, if price breaks north, we’ll likely see the market collide with a 4hr Quasimodo resistance level at 1.2279. Is this a good barrier to look for shorts? Could be, but by selling here, you’d not only be contending with potential demand from the recently broken 4hr supply area at 1.2267-1.2242, but also from the recent weekly buying off of the aforementioned weekly swap area. In the event that price breaks lower today, however, one could look to short down to 1.2133, but unless you entered on a very low timeframe, the risk/reward would not likely be in your favor. In the same way, entering long from 1.2133 would put you not only against potential resistance from the recently broken 4hr swap area, but also against potential higher-timeframe opposition from the aforementioned daily supply area.
Therefore, with everything taken into consideration, we’re humbly going to take a back seat on this pair for the time being until more conducive price action presents itself.
Levels to watch/live orders:
-
Buys: Flat (Predicative stop-loss orders seen at: N/A).
-
Sells: Flat (Predicative stop-loss orders seen at: N/A).
USD/CHF:
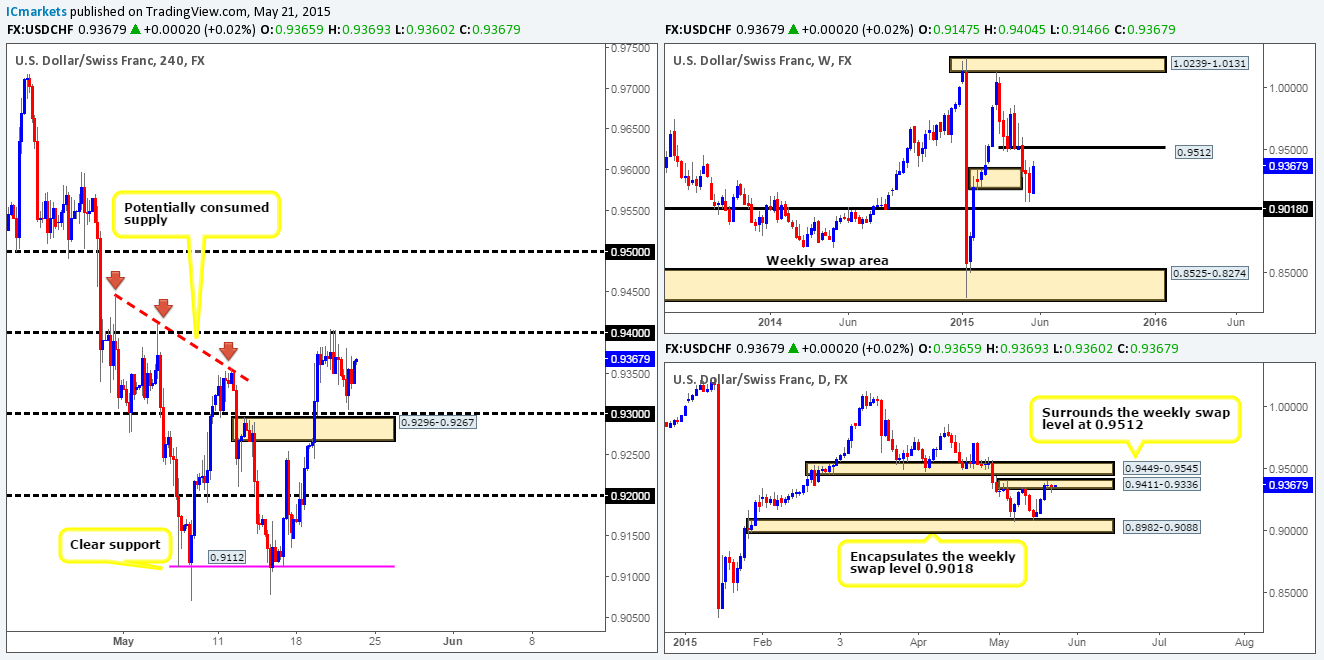
Weekly view: Following last week’s close below the weekly demand area at 0.9343-0.9180, relatively strong buying interest has come into the market so far this week. In the event that the buyers continue to push north from here, price could retest the weekly swap level coming in at 0.9512.
Daily view: From this angle, we can see that this market is now trading deep within a daily supply area at 0.9411-0.9336. Should this area be taken out, price will likely hit the daily swap area seen directly above it at 0.9449-0.9545, which, as you can probably see, also surrounds the aforementioned weekly swap level.
4hr view: The 4hr timeframe shows that during yesterday’s sessions, price rallied from the round-number support region 0.9300. This level, along with the 4hr swap area seen below at 0.9296-0.9267 was a zone we mentioned to watch for buying opportunities in yesterday’s report. Once price came close to this area, we saw that a 15-minute supply zone at 0.9335-0.9328 was taken out and later retested as demand. This is where we entered long with a fill at 0.9338.
Ultimately, we believe this pair has quite a bit of upside left in it yet even though we’re trading within daily supply at 0.9411-0.9336. Here’s why… we can see that the weekly timeframe shows room for price to move further north (see above), and the break above the 4hr high 0.9357 has potentially consumed the last remaining supply barrier until at least 0.9450, or, given enough time, the round number above at 0.9500. This is, of course, assuming that supply/sellers have already been taken out at 0.9400.
With our stop set at breakeven plus two now, we’re now effectively risk free on this trade. Ultimately, what we’d like to see now is price close above 0.9400, as this would likely attract further buyers up to our target area – 0.9450/0.9500.
Levels to watch/ live orders:
-
Buys: 0.9338 [LIVE] (Predicative stop-loss orders seen at: currently set at breakeven).
-
Sells: Flat (Predicative stop-loss orders seen at: N/A).
US 30:
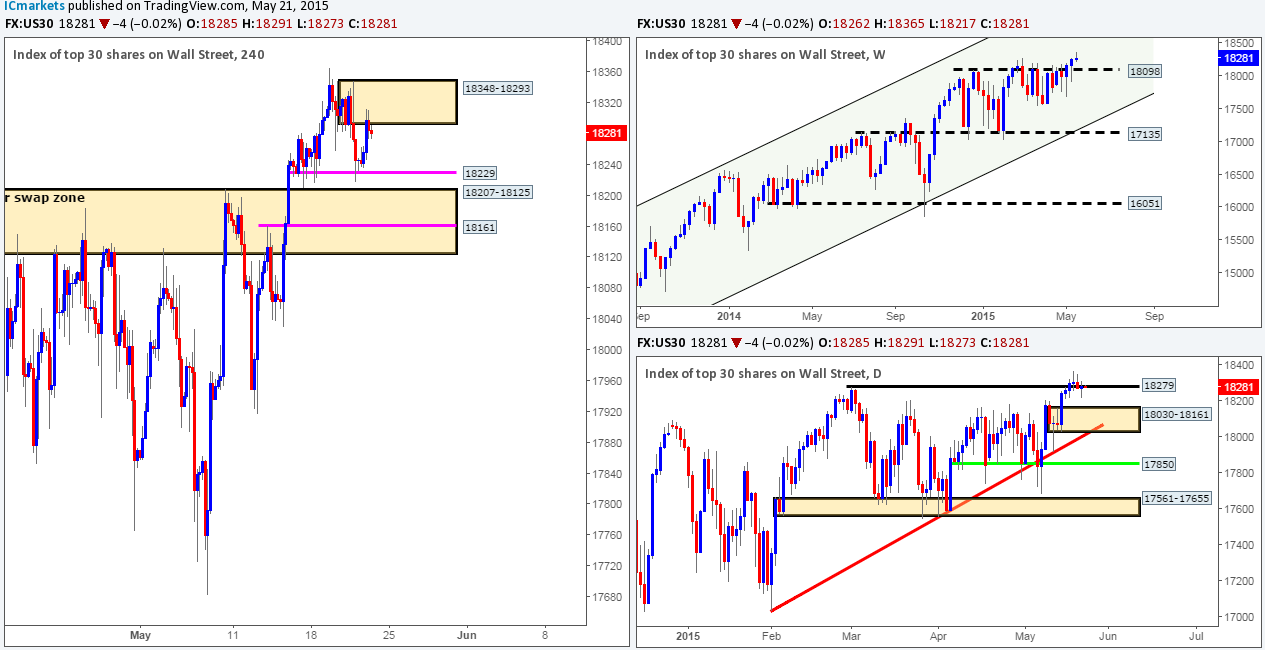
Weekly view: As far as we’re concerned, as long as the DOW keeps itself above the 18098 hurdle, our long-term bias will remain long.
Daily view: Recent actions on the daily timeframe show that both sides of this market appear hesitant around the 18279 high at the moment. Hopefully the 4hr scale will be able to shed some more light on the subject…
4hr view: The 4hr timeframe shows that price once again respected 18229 as support, resulting in the DOW rallying during most of yesterday’s sessions up to a 4hr supply area coming in at 18348-18293.
Overall, we still firmly believe that his index is headed north to new highs. It may not be today, or even next week, but we’re confident it is in store… So, where does this leave us on the 4hr timeframe? Well, even though price is currently trading from 4hr supply at the minute, we would not be comfortable selling here.
With that in mind, we’re going to once again be primarily focusing our energy on the 18229 4hr support, and the 18161 4hr swap level (upper limit of our daily demand area [see above]) for potential buying opportunities today. Entering long from either of these two levels is high probability in our opinion – the 18161 level even more so due to its higher-timeframe convergence. Waiting for lower timeframe confirmation at these levels is highly recommended though, since there is nothing worse than getting tagged on a fakeout and price then move in your originally anticipated direction.
Levels to watch/live orders:
-
Buys: 18229 [Tentative – confirmation required] (Predicative stop-loss orders seen at: dependent on where one confirms this level) 18161 [Tentative – confirmation required] (Predicative stop-loss orders seen at: dependent on where one confirms this level).
-
Sells: Flat (Predicative stop-loss orders seen at: N/A).
XAU/USD (Gold)
Weekly view: Following the close above the weekly supply at 1223.1-1202.6 last week, the gold market continues to sell off. Overall, it’s clear that the long-term trend on gold is still firmly south, and will remain that way in our opinion until price closes above the weekly trendline resistance extended from the high 1488.0.
Daily view: Further selling was seen during yesterday’s session. This saw price once again spike below the daily swap area 1215.0-1204.5, consequently forming a lower low in the process.
4hr view: From this angle, we can see that midway through the London session yesterday; gold was heavily sold into, which forced price to close below the 4hr swap area 1207.3-1204.7. For those of you who read our previous report on gold, you may recall us mentioning that we’d be interested in shorting a break if this swap area was retested as supply, and showed promising lower timeframe confirming price action. So far, the retest part has been fulfilled, but as of yet, there has been very little confirming price action seen from the lower timeframes.
Therefore, today’s primary objective is simple – keep a close eye on the lower timeframe action within this 4hr swap zone. Should a signal be spotted in today’s sessions, we’ll likely look to take full profits at the 4hr swap area located just below at 1197.4-1195.3.

Levels to watch/live orders:
-
Buys: Flat (Predicative stop-loss orders seen at: N/A).
-
Sells: 1207.3-1204.7 [Tentative – confirmation required] (Predicative stop-loss orders seen at: dependent on where one confirms this area).


