Waiting for lower timeframe confirmation is our main tool to confirm strength within higher timeframe zones, and has really been the key to our trading success. It takes a little time to understand the subtle nuances, however, as each trade is never the same, but once you master the rhythm so to speak, you will be saved from countless unnecessary losing trades. The following is a list of what we look for:
- A break/retest of supply or demand dependent on which way you’re trading.
- A trendline break/retest.
- Buying/selling tails/wicks – essentially we look for a cluster of very obvious spikes off of lower timeframe support and resistance levels within the higher timeframe zone.
We typically search for lower-timeframe confirmation between the M15 and H1 timeframes, since most of our higher-timeframe areas begin with the H4. Stops are usually placed 1-3 pips beyond confirming structures.
EUR/USD:
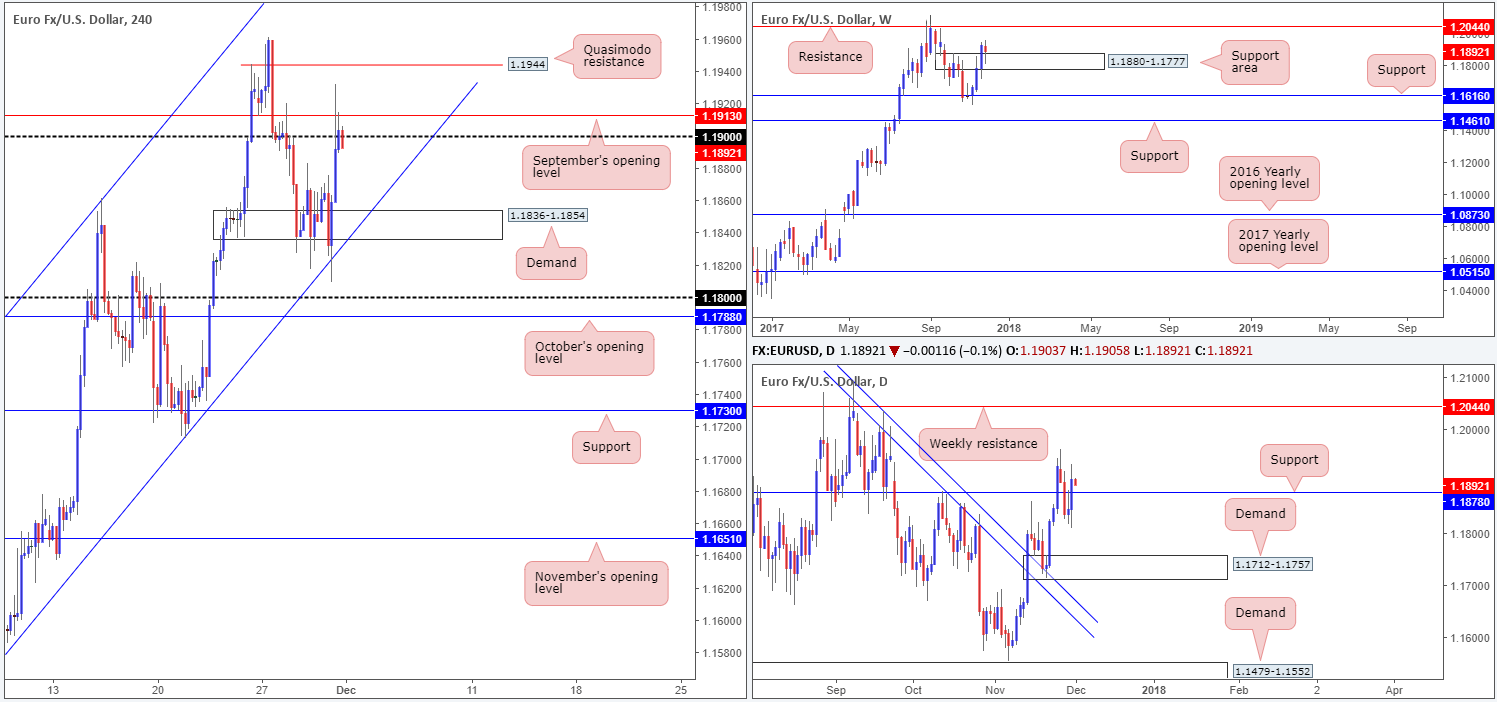
The impact of disappointing German retail sales data caused H4 price to selloff in early London hours and, once again, breach the underside of H4 demand pegged at 1.1836-1.1854. Despite lower-than-expected euro inflation figures, the pair managed to stabilize around the H4 channel support taken from the low 1.1553 (check out the nice-looking H1 pin bar – positioned directly beneath the aforesaid H4 demand). From that point forward, the single currency entered recovery mode and pushed on up to September’s opening level at 1.1913/1.19, even in the face of optimistic US economic data.
From a technical standpoint, the move higher was also likely reinforced by a weekly supply-turned support zone coming in at 1.1880-1.1777. This, as you can see on the daily timeframe, dragged price back above daily resistance at 1.1878 (now acting support).
Suggestions: From the current weekly support area, there’s room seen for the unit to rally as far north as weekly resistance at 1.2044. However, before we can reach this level the H4 candles will need to overcome the H4 Quasimodo resistance at 1.1944 as well as the large psychological band at 1.20 (not seen on the H4 chart).
As a result, we feel that the pair is ripe for an upside extension beyond 1.1944 today, targeting 1.20/1.2044. To try and buy this market above 1.1913 (Sept’s open level), however, wouldn’t leave much room for maneuver as 1.1944 would almost immediately be knocking on your door!
Data points to consider: FOMC member Kaplan speaks at 2.30pm; ISM manufacturing PMI at 3pm; FOMC member Harker speaks at 3.15pm GMT.
Levels to watch/live orders:
- Buys: Watch for H4 price to engulf 1.1944 and then look to trade any retest of this number seen thereafter ([waiting for additional confirmation in the form of a full or near-full-bodied H4 bull candle following the retest is advised] stop loss: ideally beyond the candle’s tail).
- Sells: Flat (stop loss: N/A).
GBP/USD:
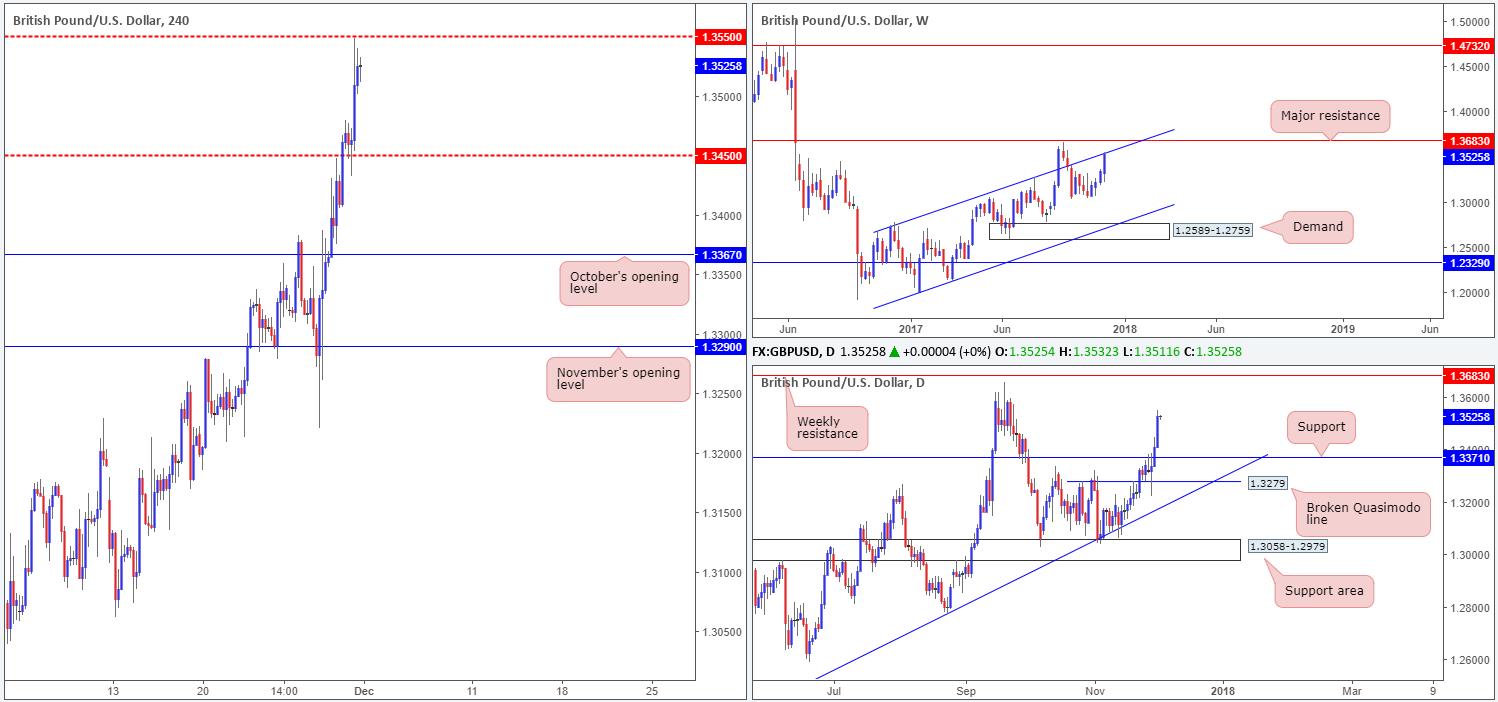
The British pound made considerable ground against its US counterpart on Thursday, supported by recent ‘Brexit’ talks. After cracking through the H4 mid-level resistance at 1.3450 and firmly retesting the line as support, this provided a stable platform for the unit to advance, and advance it did! As can be seen on the H4 timeframe, the day ended mildly paring gains around the underside of the H4 mid-level resistance hurdle at 1.3550.
Aside from 1.3550, we can also see that the recent advance brought in the weekly channel resistance extended from the high 1.2673. We feel this is likely going to be a cumbersome area to overcome, and therefore may see the H4 candles withdraw from 1.3550 today.
Suggestions: While the current H4 mid-level resistance boasts weekly convergence, there is, as far as we can see, little else encouraging a sell from here at the moment. Considering this, the team has decided to remain on the sidelines for the time being. Should a reasonably sized H4 bear candle take shape (preferably full bodied), nevertheless, then 1.3550 could be a worthy short, targeting the origin of yesterday’s rally: 1.3450.
Data points to consider: UK manufacturing PMI at 9.30am; FOMC member Kaplan speaks at 2.30pm; ISM manufacturing PMI at 3pm; FOMC member Harker speaks at 3.15pm GMT.
Levels to watch/live orders:
- Buys: Flat (stop loss: N/A).
- Sells: 1.3550 region ([waiting for a reasonably sized H4 bearish candle to form – preferably a full or near-full-bodied candle – is advised] stop loss: ideally beyond the candle’s wick).
AUD/USD:
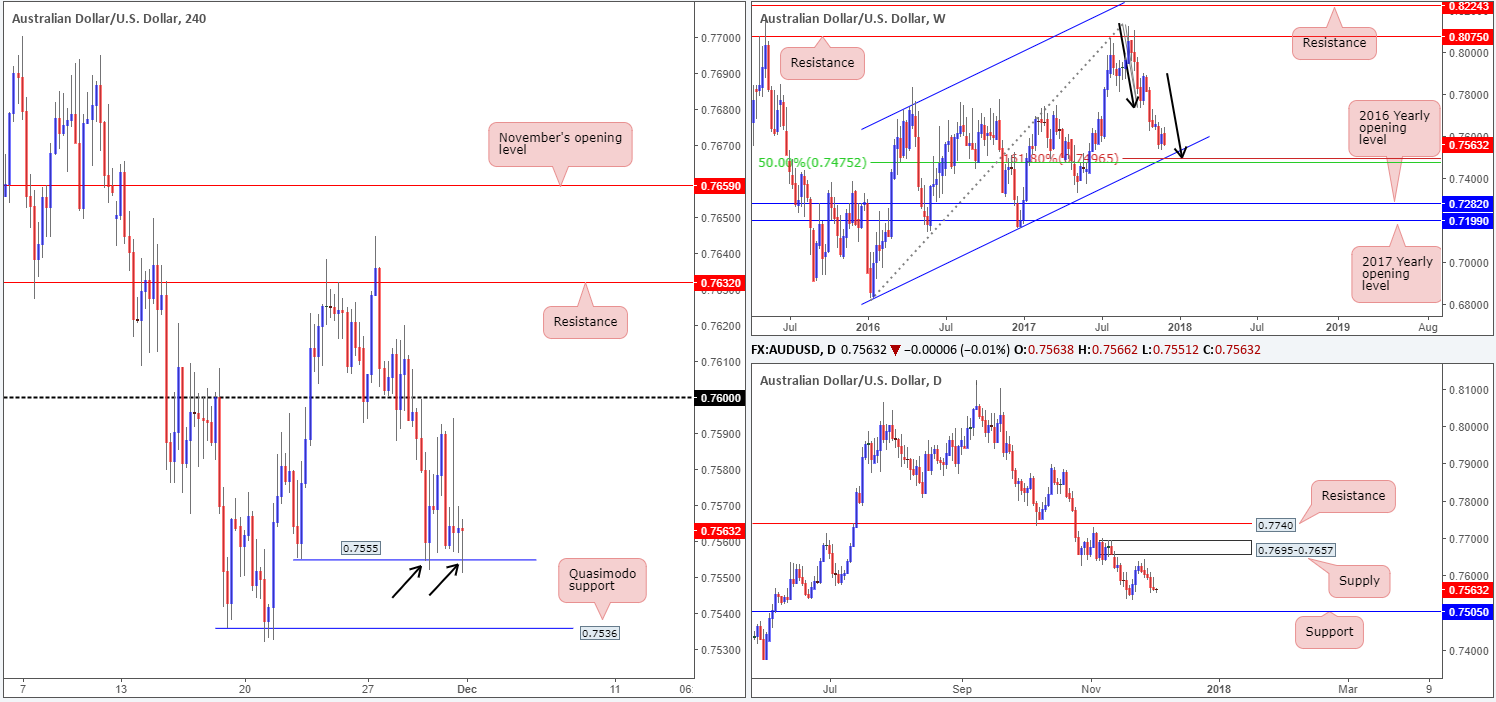
Despite an earnest attempt to reach the 0.76 boundary after testing local H4 support at 0.7555, the bulls were unable to muster enough strength to sustain recent gains. Thursday’s action, therefore, concluded with the H4 candles closing just ahead of the noted local H4 support, marginally down on the day. As mentioned in yesterday’s report, we believe this support to be fragile since it has effectively been breached (see black arrows), which is, in our view, enough to have wiped out the majority of buyers here (stop-loss orders placed below) and clear the path south down to the H4 Quasimodo support planted at 0.7536.
On the weekly timeframe, we can see that weekly price looks poised to attack a nice-looking weekly AB=CD (see black arrows) 161.8% Fib ext. point at 0.7496. Not only does this line merge with a weekly 50.0% value at 0.7475 taken from the high 0.8125, it’s also bolstered by a weekly channel support extended from the low 0.6827. Down on the daily picture, the market has been busy painting red candles since the week’s opening. The next downside target on the daily scale can be seen at 0.7532: 21/11/17 low, followed closely by daily support fixed at 0.7505.
Suggestions: Although the H4 Quasimodo support at 0.7536 may bounce price, it is not a level we’d trade. This is largely due to the 0.75 handle (not seen on the chart) boasting attractive confluence and, therefore, likely to be the better buy zone. 0.75 boasts not only the aforementioned weekly structures; it also merges with a daily support mentioned above at 0.7505.
On account of the above, we will, dependent on the time of day (news), be looking to buy 0.75, with stops positioned 50-70 pips below. This should provide the trade enough breathing room, as this could potentially be a long-term trade with great risk/reward.
Data points to consider: Caixin manufacturing PMI at 1.45am; FOMC member Kaplan speaks at 2.30pm; ISM manufacturing PMI at 3pm; FOMC member Harker speaks at 3.15pm GMT.
Levels to watch/live orders:
- Buys: 0.75 region (50-70 pip stop loss).
- Sells: Flat (stop loss: N/A).
USD/JPY:
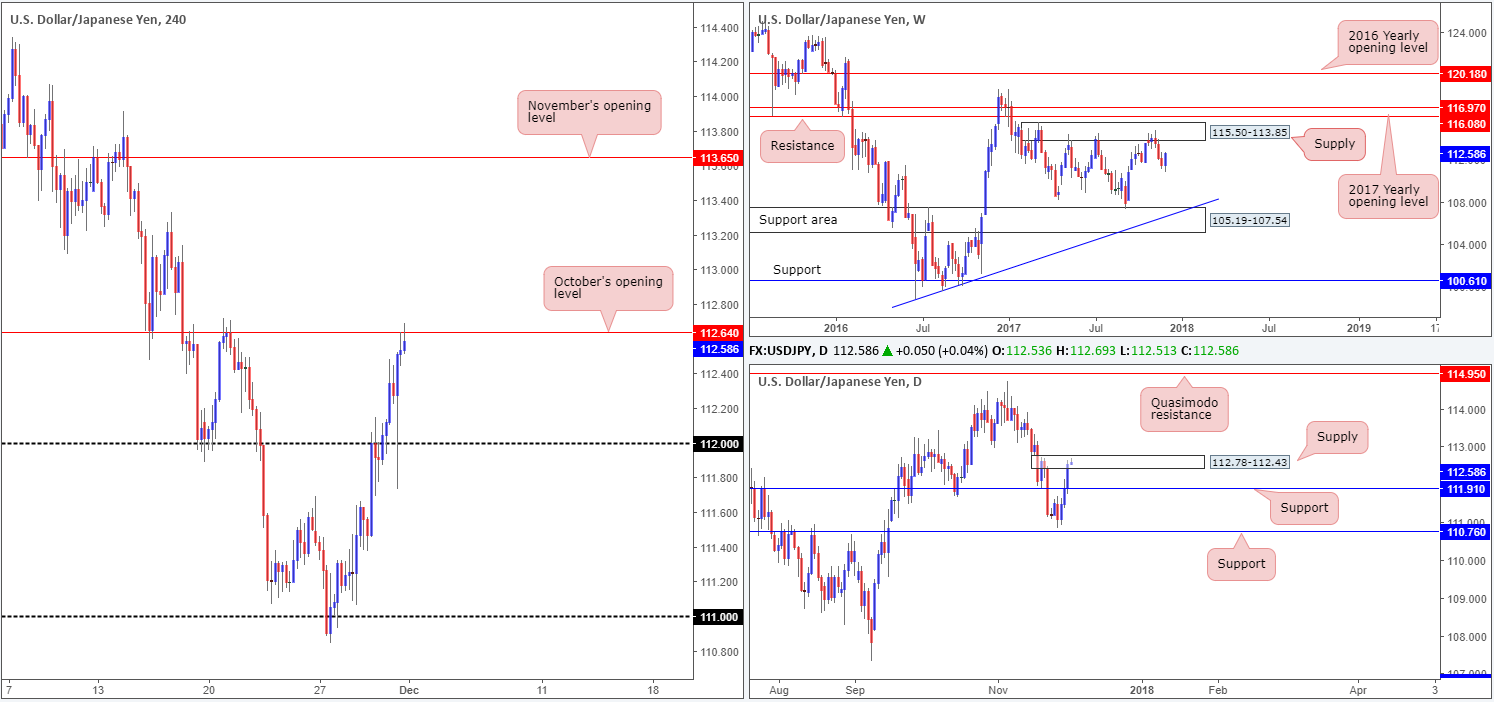
The USD/JPY printed its third consecutive daily gain on Thursday, consequently conquering daily resistance at 111.91 (now acting support) and driving into the walls of a daily supply area fixed at 112.78-112.43. Alongside this, the US 10-year yield broke the 2.40% level and US equities continued to chalk up fresh record highs.
Also recently brought into the fray was October’s opening level seen on the H4 timeframe at 112.64. So far, this level has proved noteworthy, holding prices lower on two occasions in November. Couple this with the fact that it is located within the aforesaid daily supply, this is certainly a level one should not overlook!
Suggestions: Our only concern regarding a sell from 112.64 is that weekly movement looks poised to retest weekly supply pegged at 115.50-113.85. Be that as it may, if a full or near-full-bodied H4 bearish candle takes shape from 112.64, then we believe a short could be worthy, at least down until the 112 handle/daily support at 111.91.
Data points to consider: FOMC member Kaplan speaks at 2.30pm; ISM manufacturing PMI at 3pm; FOMC member Harker speaks at 3.15pm GMT.
Levels to watch/live orders:
- Buys: Flat (stop loss: N/A).
- Sells: 112.64 region ([waiting for a reasonably sized H4 bearish candle to form – preferably a full or near-full-bodied candle – is advised] stop loss: ideally beyond the candle’s wick).
USD/CAD:
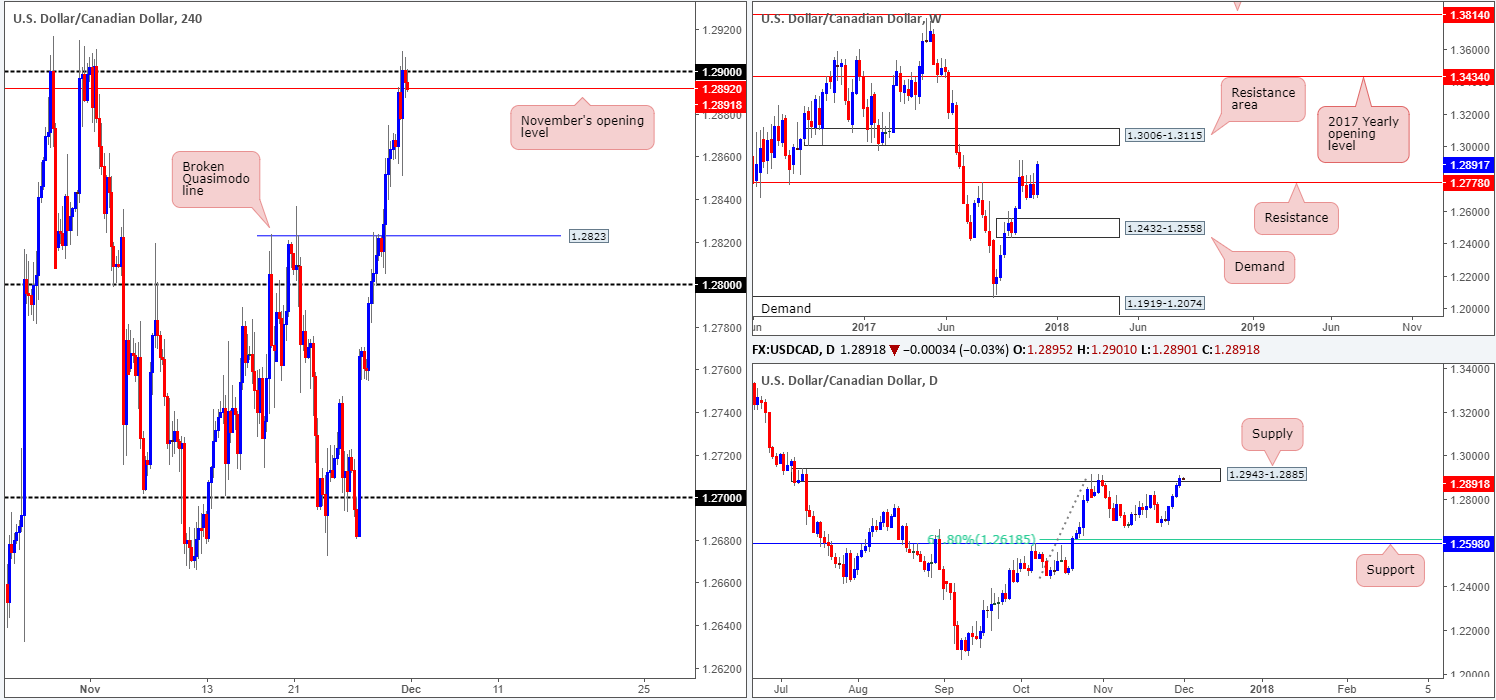
For those who read our previous report you may recall that we underlined the 1.29 handle/November’s opening level at 1.2892 seen on the H4 timeframe as a prospective base to sell from. Our rational behind selecting this area was largely due to the daily supply area seen at 1.2943-1.2885. The only concern here was the fact that weekly price was (and still is) seen trading above weekly resistance at 1.2778, and shows room to advance as far north as the weekly resistance area planted at 1.3006-1.3115.
Well done to those who managed to jump aboard here. Price dropped over 50 pips from 1.29. This should, as long as you placed stops above the aforesaid daily supply, have been enough of a move to lock in some profits and reduce risk.
Suggestions: We still have our eye on 1.29/1.2892 to sell, but would, after seeing that the level already responded and traded lower, now only consider it a valid sell zone if H4 price is able to print a full or near-full-bodied bearish candle. This, for us at least, is enough to suggest bearish intent. On the H4 scale, we do not see much stopping the unit from dropping as far south as the broken H4 Quasimodo line at 1.2823, making it an ideal take-profit target.
Data points to consider: FOMC member Kaplan speaks at 2.30pm; ISM manufacturing PMI at 3pm; FOMC member Harker speaks at 3.15pm; Canadian job’s figures at 1.30pm GMT.
Levels to watch/live orders:
- Buys: Flat (stop loss: N/A).
- Sells: 1.29/1.2892 ([waiting for a reasonably sized H4 bearish candle to form – preferably a full or near-full-bodied candle – is advised] stop loss: ideally beyond the candle’s wick).
USD/CHF:
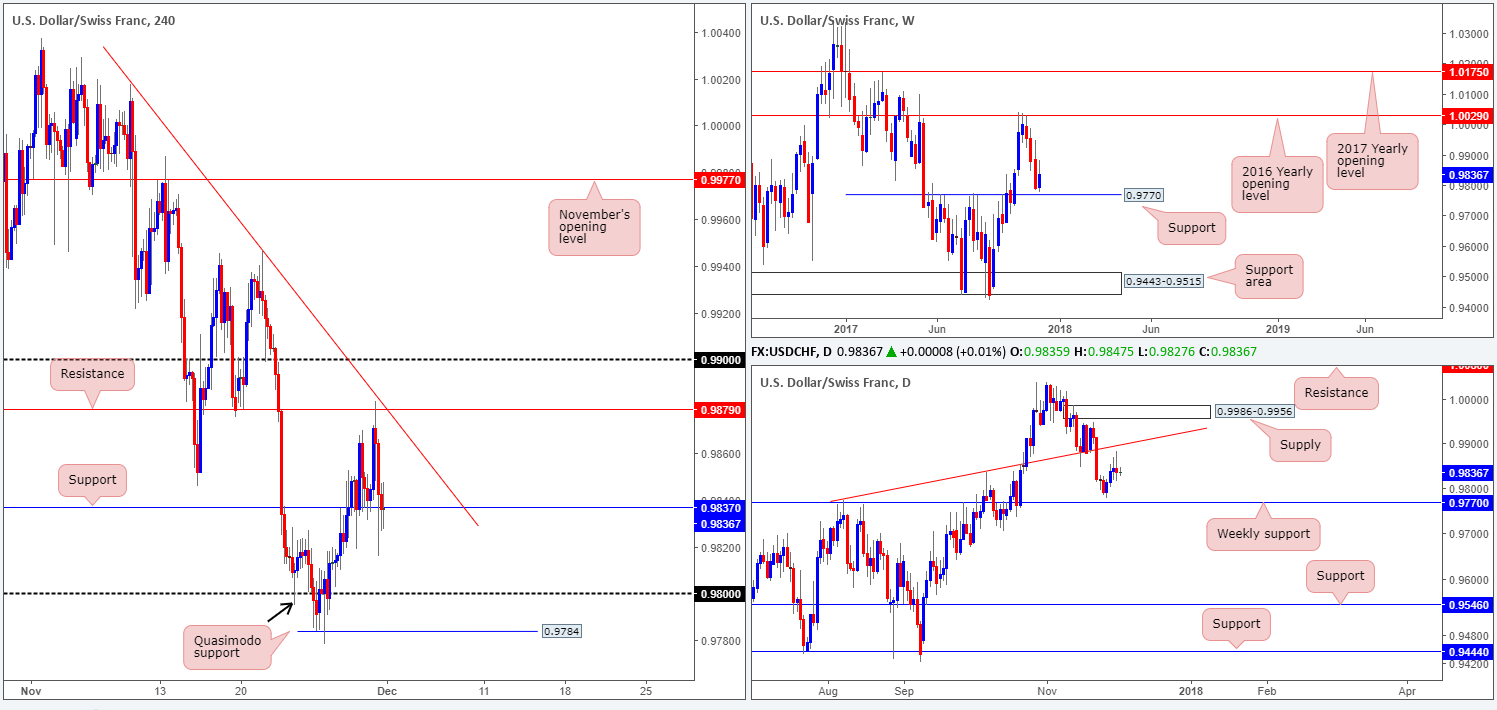
During the course of yesterday’s sessions, the pair fell sharply from H4 resistance at 0.9879 (merged closely with a H4 trendline resistance taken from the high 1.0017) following a modest bounce from H4 support at 0.9837.
The day ended with the H4 candles aggressively spiking through the aforementioned H4 support, likely ripping through any stop-loss orders in the vicinity. A decisive push below this support would likely place the 0.98 handle in the firing range, followed closely by a H4 Quasimodo support pegged at 0.9784. Why we chose this Quasimodo as opposed to the left shoulder marked with the black arrow at 0.9794 is simply because there are several tails stabbing into this line before rallying to form the Quasimodo. This can indicate that there are few unfilled buy orders remaining.
On the daily timeframe, the next upside target does not come onto the radar until we reach the trendline resistance extended from the high 0.9773. To the downside, however, the next obvious level of interest can be seen at 0.9770: a weekly support base.
Suggestions: Buying from the current H4 support, given recent candle action, is not something we’d advise. A long from the 0.98 handle or even the H4 Quasimodo support seen below it at 0.9784 is also a chancy move. The reason? Weekly support is lurking just below these hurdles at 0.9770. Anyone smell a possible fakeout brewing here?
In light of the above information, the team has only expressed interest in the aforementioned weekly support level. An alert has been set.
Data points to consider: FOMC member Kaplan speaks at 2.30pm; ISM manufacturing PMI at 3pm; FOMC member Harker speaks at 3.15pm GMT.
Levels to watch/live orders:
- Buys: 0.9770 is the only level we’re currently watching right now.
- Sells: Flat (stop loss: N/A).
DOW 30:
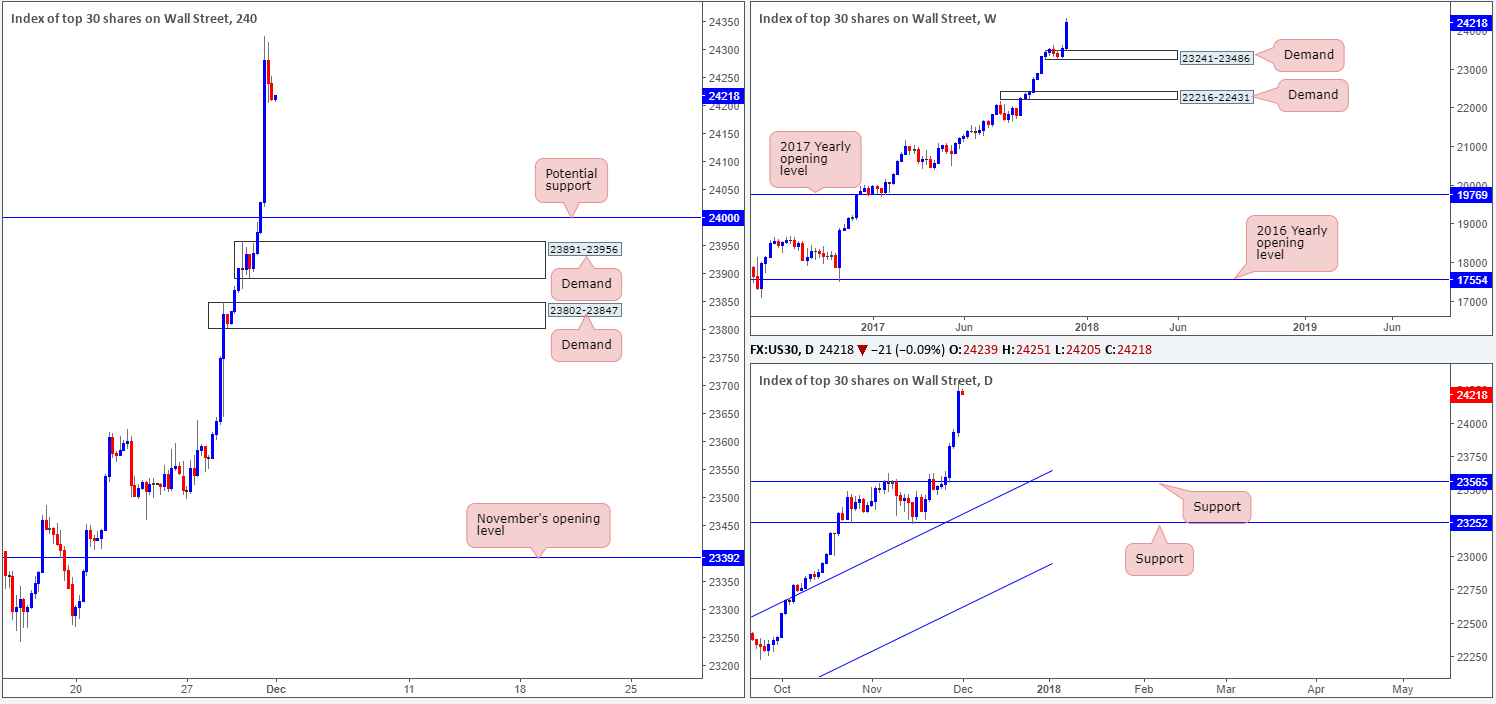
US equities recorded substantial gains on Thursday, breaking through the 24K mark for the first time. Heightened expectations of the tax overhaul bill passing the Senate, along with energy shares surging on OPEC output cut deal extensions saw the index hit a fresh record high of 24323.
In view of the six-day bullish move, we feel this market is overextended at this point and is due a correction. This could offer a buy-the-dip opportunity. The closest base of support, however, does not come onto the radar until the 24K mark. With a H4 demand positioned just below it at 23891-23956 though, a fakeout is likely on the cards, so be careful where you place stops here!
Suggestions: Rather than placing a pending buy order at 24K, we recommend being patient and waiting for the H4 candles to prove buyer intent. Should a H4 full or near-full-bodied candle take shape from 24K, the noted H4 demand below it, or the H4 demand below that at 23802-23847, this is where we would consider longs from. Patience is a virtue in almost everything we do, and trading is no different!
Data points to consider: FOMC member Kaplan speaks at 2.30pm; ISM manufacturing PMI at 3pm; FOMC member Harker speaks at 3.15pm GMT.
Levels to watch/live orders:
- Buys: 24000 ([waiting for a reasonably sized H4 bullish candle to form – preferably a full or near-full-bodied candle – is advised] stop loss: ideally beyond the candle’s tail).
- Sells: Flat (stop loss: N/A).
GOLD:
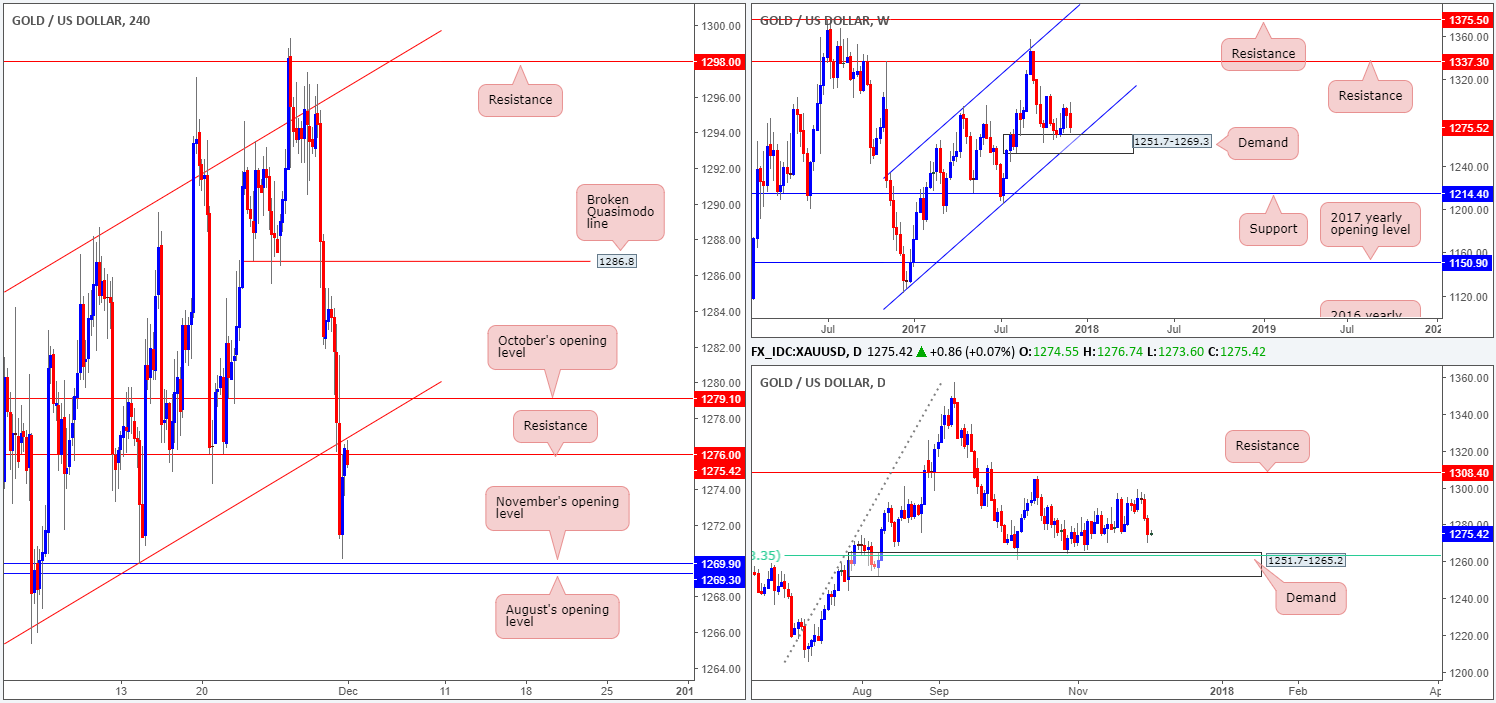
The yellow metal sustained further losses on Thursday on improved market sentiment. Rising 10-year US Treasury bond yields along with an aggressive rally to all-time highs on the DJIA, forced gold to strike a session low of 1270.1. Leaving August/November’s opening levels seen on the H4 timeframe (1269.3/1269.9) unchallenged, the H4 candles began mildly paring gains into the close, bringing the unit up to a H4 resistance level at 1276.0 that merges with the underside of the recently broken H4 channel support-turned resistance taken from the low 1263.4.
Over on the weekly timeframe, we can see that weekly price is, thanks to the recent bout of selling, now seen trading within striking distance of weekly demand at 1251.7-1269.3, which happens to fuse nicely with a weekly channel support extended from the low 1122.8. One thing to keep in mind here is that August’s opening level mentioned above at 1269.3 represents the top edge of the noted weekly demand.
Suggestions: With weekly price so close to shaking hands with weekly demand, is a short from the current H4 resistance, considering it merges with a H4 channel resistance, trade worthy? If one is able to pin down a lower-timeframe sell signal from here, then we believe it is (see the top of this report for ideas on how to use lower-timeframe structures as a means of entry). The take-profit target from this angle would be set at 1269.90 ([near] top edge of weekly demand/November’s opening level).
Levels to watch/live orders:
- Buys: Flat (stop loss: N/A).
- Sells: 1276.0 region ([waiting for a lower-timeframe signal to form is advised before pulling the trigger] stop loss: dependent on where one confirms the area).


