A note on lower timeframe confirming price action…
Waiting for lower timeframe confirmation is our main tool to confirm strength within higher timeframe zones, and has really been the key to our trading success. It takes a little time to understand the subtle nuances, however, as each trade is never the same, but once you master the rhythm so to speak, you will be saved from countless unnecessary losing trades. The following is a list of what we look for:
- A break/retest of supply or demand dependent on which way you’re trading.
- A trendline break/retest.
- Buying/selling tails/wicks – essentially we look for a cluster of very obvious spikes off of lower timeframe support and resistance levels within the higher timeframe zone.
- Candlestick patterns. We tend to stick with pin bars and engulfing bars as these have proven to be the most effective.
We search for lower timeframe confirmation between the M15 and H1 timeframes, since most of our higher-timeframe areas begin with the H4. Stops are usually placed 5-10 pips beyond confirming structures.
EUR/USD:
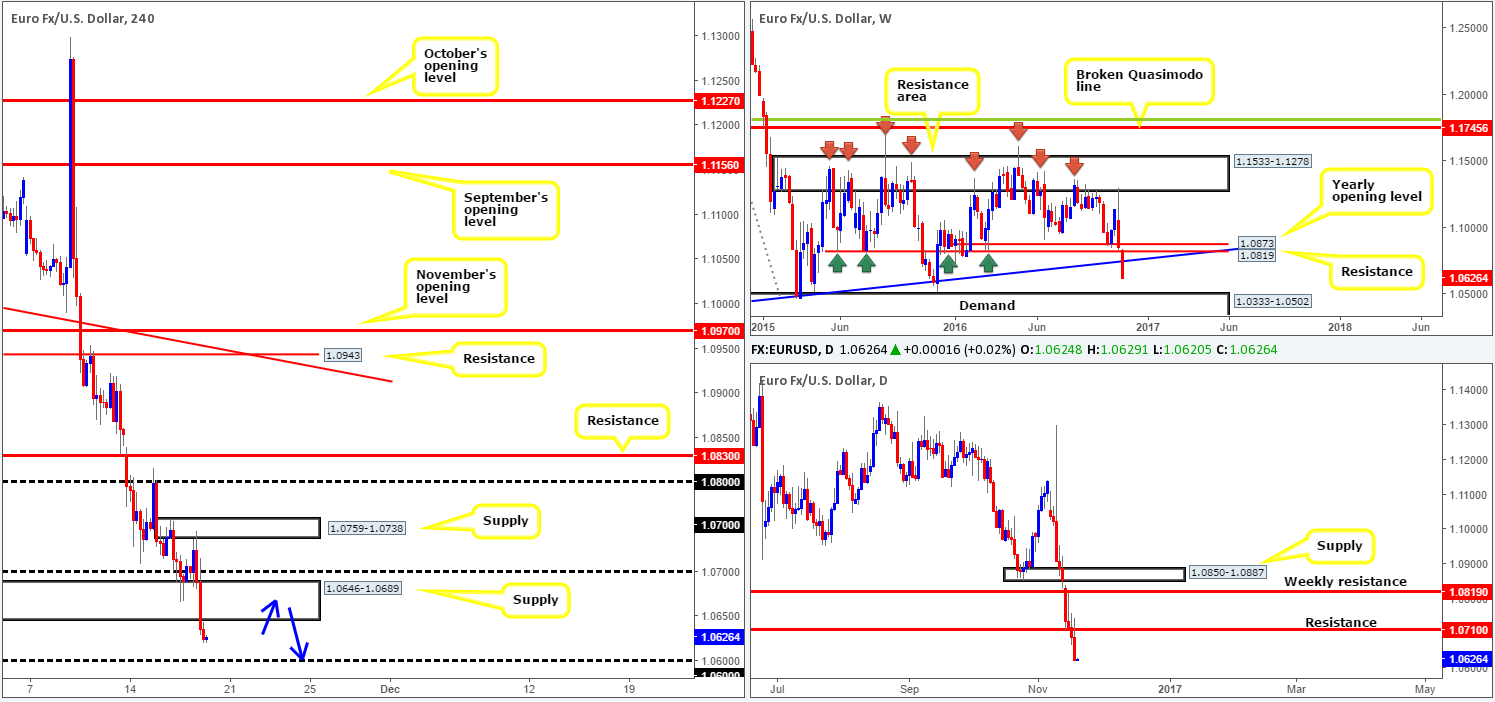
Shortly after price connected with the H4 supply at 1.0759-1.0738 yesterday, the shared currency spiraled south. The move was initially bolstered by hotter than expected US housing data and Jobless claims, but did in fact gain further traction following the Federal Reserve Chair Janet Yellen saying that an interest-rate hike could come relatively soon. Psychological support at 1.07 along with its neighboring H4 demand 1.0646-1.0689 were both engulfed as a result of this, leaving the 1.06 handle firmly in the spotlight today.
It looks as though the current weekly candle will print a bearish close beyond the trendline support drawn from the low 0.8231, which, in our opinion, could potentially send the EUR back down to demand at 1.0333-1.0502. Yesterday’s daily candle on the other hand, aggressively stabbed the underside of resistance penciled in at 1.0710 and went on to close near its lows at 1.0624. This further highlights the possibility that we may see the unit strike the Quasimodo support coming in at 1.0557, which happens to be positioned 50 or so pips above the aforementioned weekly demand.
Our suggestions: Should the H4 candles catch a bid prior to reaching 1.06 and retest the recently broken H4 demand as supply at 1.0646-1.0689, we feel, given the higher-timeframe picture (see above), that a sell from this boundary is a reasonable possibility, targeting 1.06 as an immediate take-profit zone.
To be on the safe side here, we would recommend waiting for a lower timeframe sell signal to form before considering a position, as there is a chance that price may fake above the supply to 1.07 (see the top of this report for lower timeframe confirming techniques).
Data points to consider: ECB President Mario Draghi speaks at 8.30am. FOMC member Bullard then speaks at 10.30am, followed by two other members taking the stage (Dudley/George) at 2.30pm GMT.
Levels to watch/live orders:
- Buys: Flat (stop loss: N/A).
- Sells: 1.0646-1.0689 ([lower timeframe confirmation required prior to pulling the trigger] stop loss: dependent on where one confirms the area).
GBP/USD:
The H4 candles continue to emphasize its current range between demand at 1.2377-1.2425 and the psychological handle 1.25. Yesterday’s upbeat UK retail sales data initially buoyed the pound but, as you can see, was quickly rejected by the topside of this consolidation, consequently sending the pair back down to its demand. A break through this demand base would likely place the nearby H4 demand at 1.2276-1.2302 in focus, followed closely by November’s opening level at 1.2235.
The weekly chart offers little directional clue from a structural standpoint, with cable seen currently trading mid-range between resistance penciled in at 1.2942 and support carved from 1.1904.The demand at 1.2351-1.2440 seen over on the daily chart, however, continues to hold ground, in spite of three consecutive daily bearish closes! Assuming this demand eventually crumbles, it would likely open the doors for a move down to daily support seen at 1.2135.
Our suggestions: Personally, our desk would not feel at all comfortable selling this market until we see a H4 bearish close form beyond the current H4 demand base. Granted, this would not entirely clear bids from the daily demand zone mentioned above, but it would likely give a strong indication that it may give way soon. Thus, a close beyond 1.2377-1.2425, along with a firm retest of this area as supply is, at least in our book, a good signal to short down the next H4 demand at 1.2276-1.2302.
In regard to buying, one could look to trade the H4 buy zone we discussed a few days back at 1.2377/1.24 (green rectangle). This zone held beautifully on the first test, and could do so again. Though, we are more than likely going to pass here given the state of the current daily demand structure.
Data points to consider: MPC member Broadbent speaks at 9.10am. FOMC member Bullard then speaks at 10.30am, followed by two other members taking the stage (Dudley/George) at 2.30pm GMT.

Levels to watch/live orders:
- Buys: Flat (stop loss: N/A).
- Sells: Watch for a H4 bearish close below and retest of the H4 demand at 1.2377-1.2425 before shorts are considered.
AUD/USD:
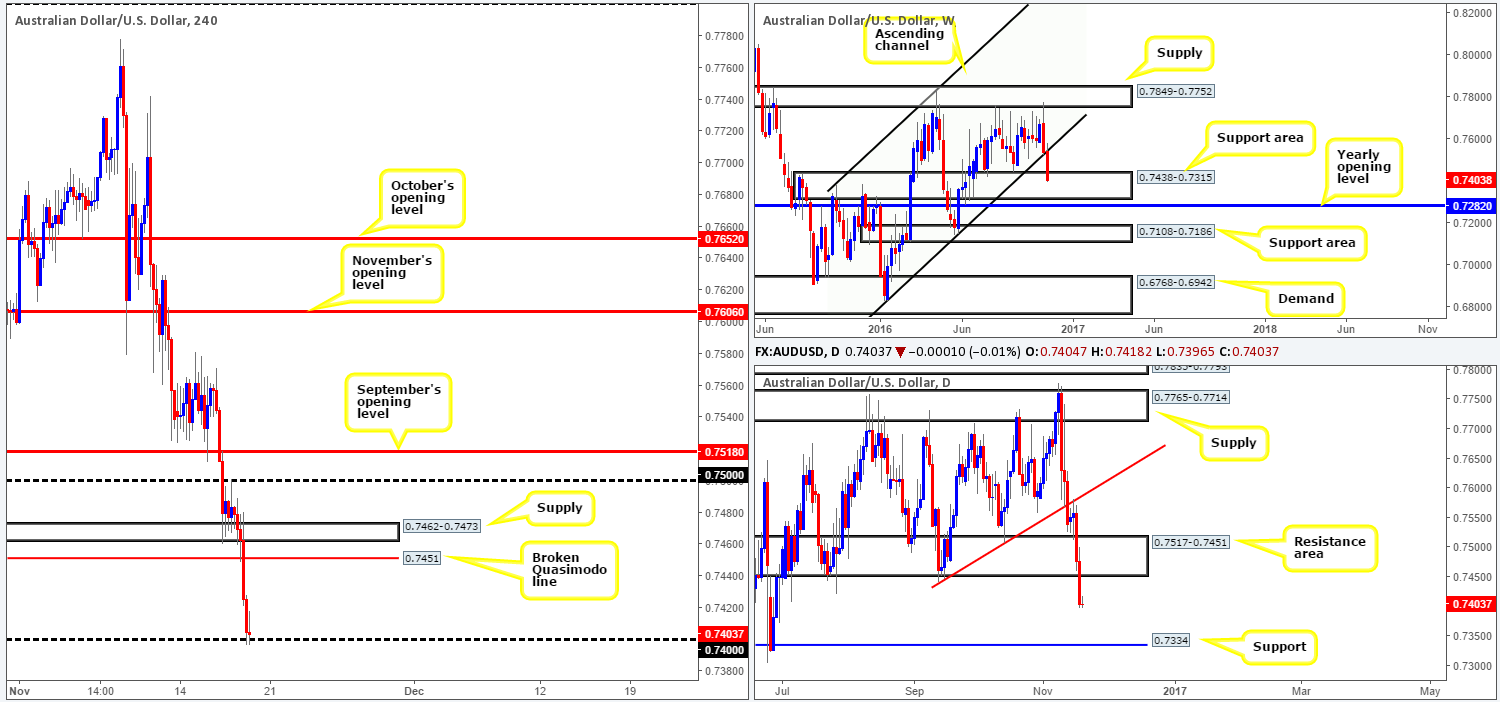
Weighed on heavily by a poor Australian employment print, the pair, after ever so slightly bouncing from the H4 Quasimodo support at 0.7451 (a level our desk highlighted as somewhere price would likely react from), fell sharply and ended the day shaking hands with the 0.74 handle.
Recent losses also saw the unit nudge below the daily support area at 0.7517-0.7451 (now an acting resistance area), thereby placing the daily support at 0.7334 in the firing range. Meanwhile, up on the weekly chart, the current weekly candle is now seen firmly trading within the confines a support area logged in at 0.7438-0.7315.
Our suggestions: Although a bounce from 0.74 is certainly not out of the question seeing as it is housed within the walls of the current weekly support area, the decisive close beyond the daily support area seen yesterday is concerning. In light of this, here is how we intend to approach this market:
- Wait and see if the H4 candles close beyond the 0.74 boundary. Should this come to life, our desk will need a retest to the underside of this number alongside a reasonably sized H4 bearish close, before a short trade can be executed, targeting the daily support mentioned above at 0.7334. The reason we require the H4 bearish close here is simply due to where price is positioned on the weekly chart.
- 0.7334 is not only an ideal take-profit zone, it’s also a beautiful place to buy from! A daily support that’s lodged within a weekly support area is, at least in our book of technical setups, a high-probability reversal zone, which is surely to produce a healthy bounce at best.
Data points to consider: FOMC member Bullard speaks at 10.30am, followed by two other members taking the stage (Dudley/George) at 2.30pm GMT.
Levels to watch/live orders:
- Buys: 0.7334 ([trading this number at market is a possibility here but is dependent on the time of day] stop loss: 0.7310 – beyond the weekly support area).
- Sells: Watch for a close below 0.74 and then look to trade any retest seen thereafter (reasonably sized H4 bearish close required).
USD/JPY:
Shortly after Yellen’s testimony in Congress yesterday, the USD/JPY continued on its upwardly path, taking out H4 supply at 109.70-109.45 and closing the day marginally above the 110.00 handle. While yesterday’s close is considered a bullish cue, we still have to take in account what’s occurring over in the bigger picture. Weekly price recently crossed swords with a strong-looking supply zone drawn from 111.44-110.10 that may challenge the current bull run. Down on the daily chart on the other hand, the candles are seen hovering just ahead of a Quasimodo resistance level fixed at 110.58 that is housed within the walls of the above said weekly supply.
Our suggestions: Ultimately, our desk has their eye on the above noted daily Quasimodo resistance level for shorts today. Therefore, we’re essentially looking for the 110 handle to hold firm this morning, which should encourage further buying as we enter into the more liquid sessions later on.
A pending sell order has been placed at 110.56, with a stop set above the H4 supply that corresponds with the daily Quasimodo level (110.83-110.57) at 110.85.
Data points to consider: FOMC member Bullard speaks at 10.30am, followed by two other members taking the stage (Dudley/George) at 2.30pm GMT.

Levels to watch/live orders:
- Buys: Flat (stop loss: N/A).
- Sells: 110.56 ([pending order] stop loss: 110.85).
USD/CAD:
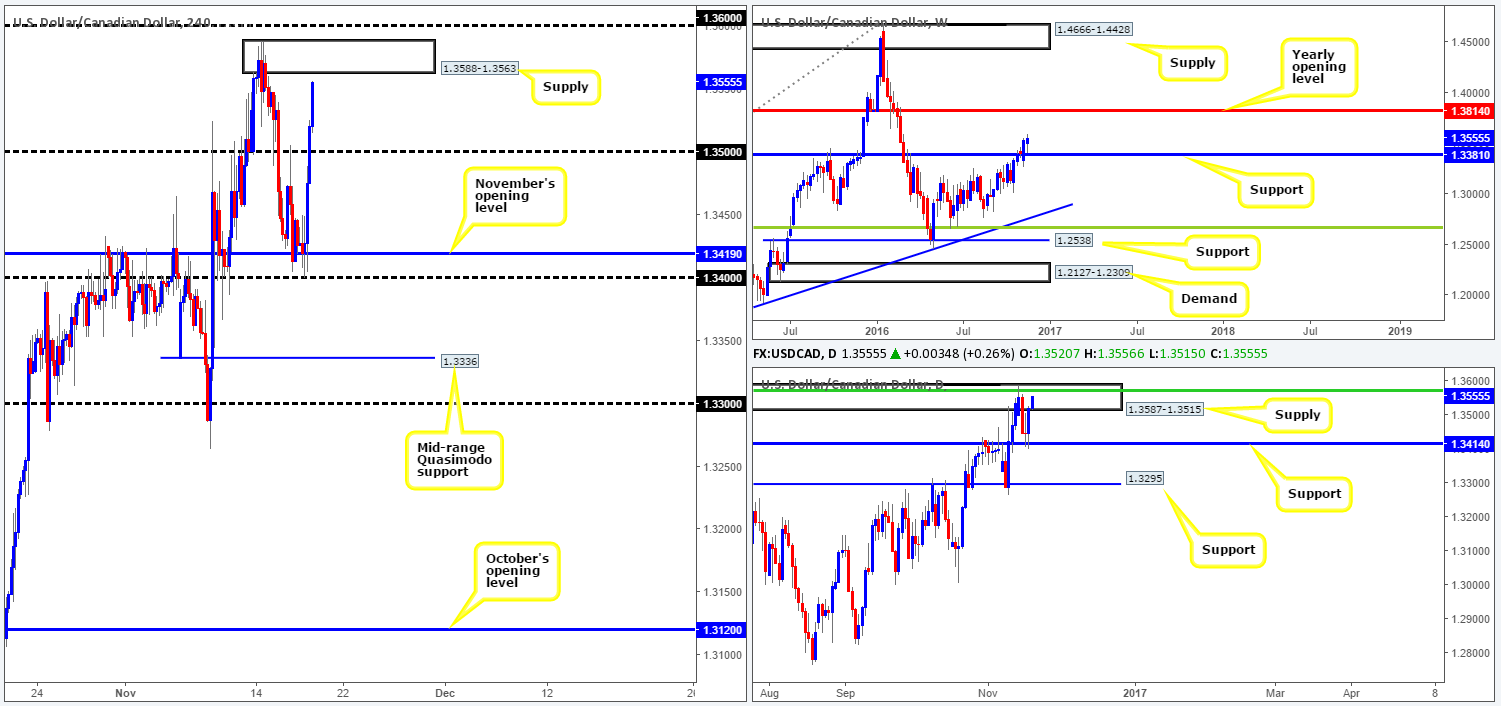
Trade update: Took a loss at 1.3408 – see the previous report for details
Strengthened by a selloff in the oil market from highs of 46.55, the USD/CAD recently whipsawed through November’s opening level at 1.3419 and caught a bid from the 1.34 handle, before aggressively rallying north and closing the day 20 pips above the 1.35 handle. Not only was the move supported by a downward move in oil, it was also, as you can probably see, reinforced by daily support at 1.3414!
While the H4 bulls still appear to be on the offensive at the moment, sellers could potentially make an appearance at the oncoming H4 supply drawn from 1.3588-1.3563, which is housed within the current daily supply area at 1.3587-1.3515 (converges with the daily 50.0% Fib resistance at 1.3570). Now, if the buyers ignore these two supplies, which is certainly a possibility according to the weekly chart (shows room to move north up to the yearly opening level at 1.3814), we may see the pair attempt to reach 1.3859-1.3765: a daily supply area that fuses with the daily 61.8% Fib resistance at 1.3832 and also encapsulates the above noted yearly opening level).
Our suggestions: Granted, the upside in this market does look incredibly tempting on the weekly chart. However, our team is reluctant to become buyers until we see at least a H4 close above the 1.36 boundary, since buying into H4/daily supply is not something we would feel comfortable participating in. In the event that 1.36 is taken out and retested as support, we would look to take a long position with an ultimate take-profit target set at the aforementioned yearly opening level.
Data points to consider: Canadian inflation data at 1.30pm. FOMC member Bullard speaks at 10.30am, followed by two other members taking the stage (Dudley/George) at 2.30pm GMT.
Levels to watch/live orders:
- Buys: To become buyers, a close above and retest of the 1.36 boundary is needed.
- Sells: Flat (stop loss: N/A).
USD/CHF:
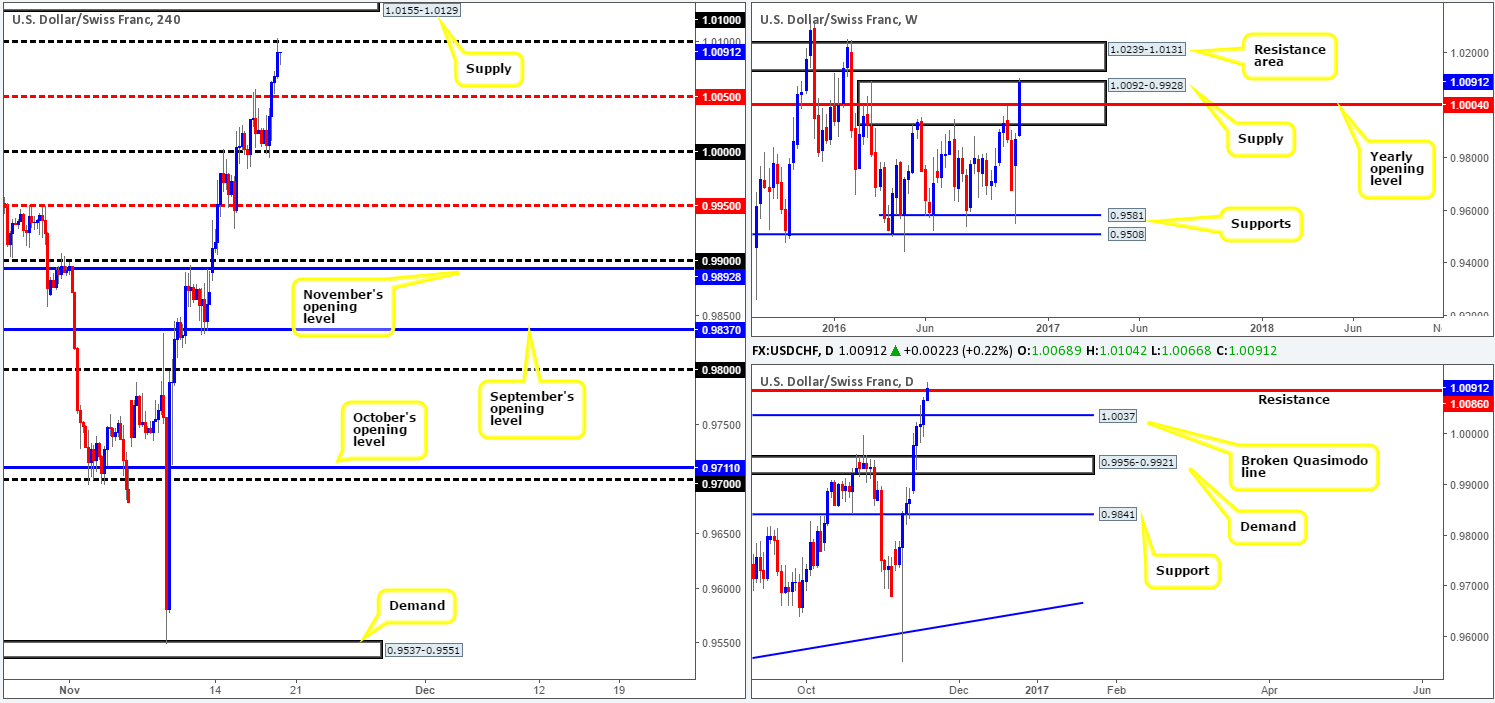
During the course of yesterday’s sessions, we saw the Swissy reclaim parity (1.0000) for a second time and advance north, following upbeat US housing data and Jobless claims as well as comments made by Fed Chair Janet Yellen regarding the possibility of an interest-rate hike.
As of current price, the pair is seen touching gloves with the 1.01 handle, which happens to sit just below a H4 supply base coming in at 1.0155-1.0129. Daily action on the other hand, is flirting with a resistance level coming in at 1.0086, while weekly price recently penetrated through the top edge of a supply zone at 1.0092-0.9928. Of particular interest here is the weekly resistance area located directly above the current weekly supply at 1.0239-1.0131, as the H4 supply at 1.0155-1.0129 also denotes the lower edge of this weekly resistance area, making the H4 zone a beautiful base to short from.
Our suggestions: Given the recent breach seen above the current weekly supply, sellers’ stops have likely been triggered. This may call for a move north up to the aforementioned weekly resistance area, and by extension, a break above the 1.01 handle into the above said H4 supply. This, we believe, is a sound area to sell from. We currently have a pending sell order set on the USD/JPY, however depending on what level is hit first, we may take a short on this unit at market from 1.0128, with a stop placed above at 1.0157.
Data points to consider: Gov. Board member Maechler speaks today at 10.30am, along with FOMC member Bullard, followed by two other members taking the stage (Dudley/George) at 2.30pm GMT.
Levels to watch/live orders:
- Buys: Flat (stop loss: N/A).
- Sells: 1.0128 ([a level strong enough to condone a pending order] stop loss: 1.0157).
DOW 30:
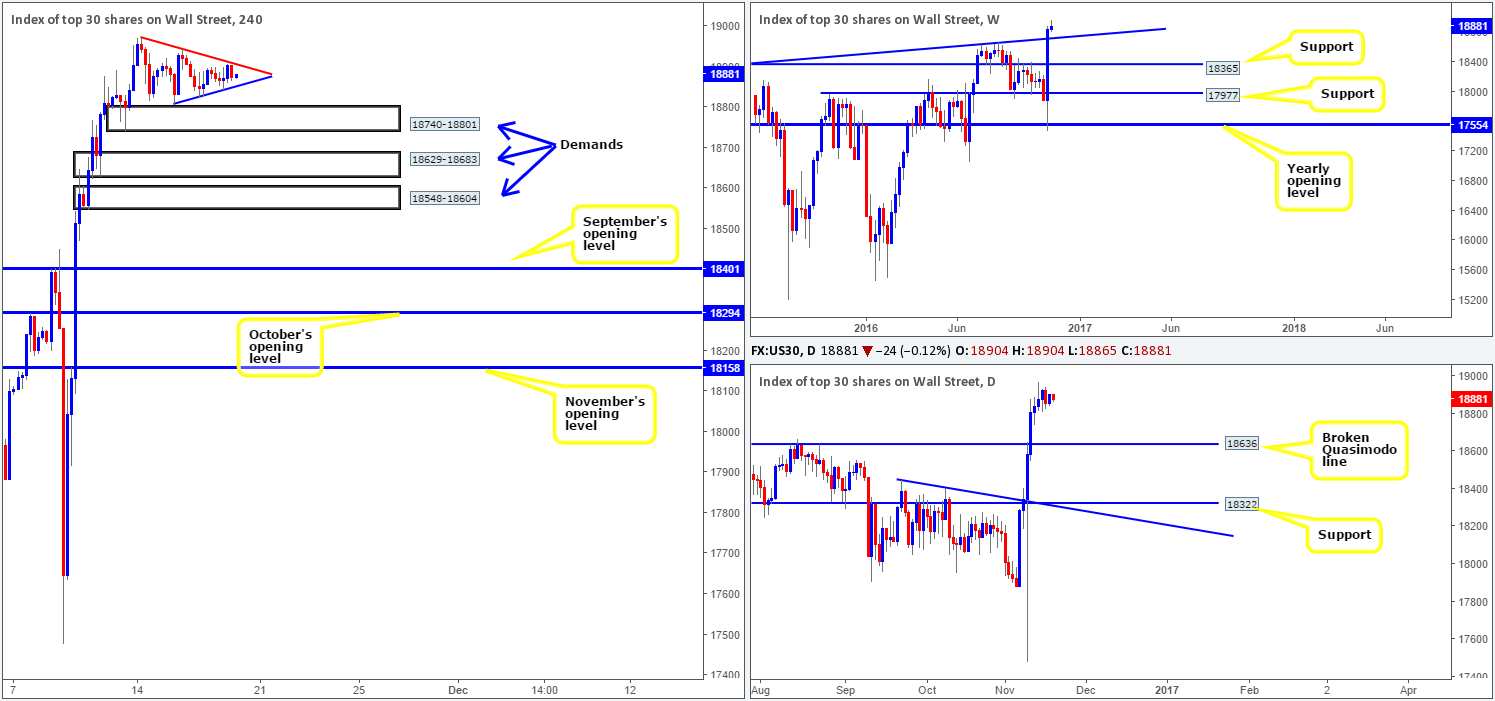
Since the beginning of the week, the US equity market has been compressing between two converging H4 trendlines (18971/18808), forming a possible bullish pennant formation. This technical pattern is considered by most to be a continuation setup. Therefore, should a close above the top edge of the pennant take place followed up with a retest as support, we would consider jumping in long this market, mainly due to the room seen to move higher on the bigger picture.
However, a break below the above said bullish pennant is not necessarily considered a bearish cue, in our opinion, as we still have three areas of demand positioned below. The first, the lowest of the three, comes in at 18548-18604: a H4 demand which was formed following the break of the daily Quasimodo resistance level at 18636 (the next downside target on the daily timeframe). The second, the middle of the three is seen at 18629-18683: a H4 demand base that intersects beautifully with the weekly trendline support extended from the high 18365 (the next downside target on the weekly timeframe). The third area drawn from 18740-18801, which is also a H4 demand barrier unfortunately has little higher-timeframe significance so is, in our book, liable to be faked should price test this area.
Our suggestions: Put simply, we have to be patient here and wait for the H4 candles to make a decision within the two uniting trendlines. A break higher followed by a retest would enable us to potentially buy the index as stated above in bold. On the other side of the coin, a break lower could open up the possibility for long trades from either one of the above said H4 demands highlighted in bold/italics.
Data points to consider: FOMC member Bullard speaks at 10.30am, followed by two other members taking the stage (Dudley/George) at 2.30pm GMT.
Levels to watch/live orders:
- Buys: Watch for a close above the H4 trendline resistance and then look to trade any retest seen thereafter (waiting for a H4 bullish close to form following the retest is preferable prior to pulling the trigger – stop loss: ideally beyond the trigger candle).18740-18801 ([reasonably sized H4 bullish close required prior to pulling the trigger] stop loss: ideally beyond the trigger candle). 18629-18683 ([a possible area to consider entering at market from] stop loss: 18618). 18548-18604 ([a possible area to consider entering at market from] stop loss: 18537).
- Sells: Flat (stop loss: N/A).
GOLD:
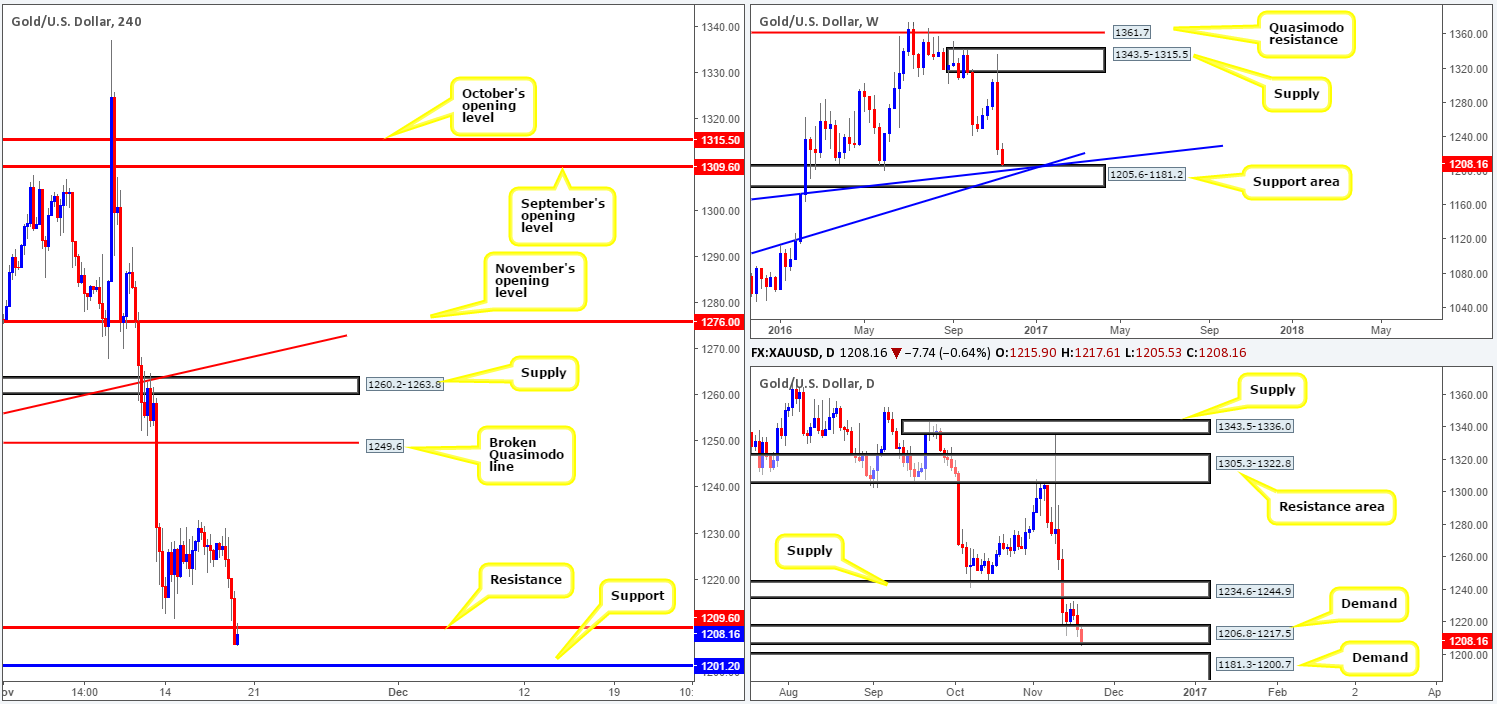
Dollar gains continued to nudge the price of the yellow metal lower during the course of yesterday’s segment. As we write, we can see that the weekly candle has now touched base with a support area at 1205.6-1181.2 that converges with two trendline supports (1130.1/1071.2). Looking down to the daily candles, however, a slight breach beyond the current demand area at 1206.8-1217.5 was seen in recent hours, potentially opening up the possibility of a further run down to demand seen at 1181.3-1200.7.
Stepping across to the H4 chart, the buyers and sellers are seen hovering ahead of a support level coming in at 1201.2, following a break below support at 1209.6 (now acting resistance). The current support sits nicely within the top edge of the above said weekly support area and is located just above the daily demand at 1181.3-1200.7.
Our suggestions: 1201.2 is a nice-looking level for a trade long. Nevertheless, we would not approve setting a pending buy order here. The reason being simply comes down to the chance that we may see this level faked in order to connect with the top edge of the daily demand at 1200.7. With that being the case, we would advise waiting for a H4 bullish close to form prior to buying the metal, with stops placed beyond the trigger candle.
Levels to watch/live orders:
- Buys: 1201.2 ([wait for a reasonably sized H4 bullish close to form prior to pulling the trigger] stop loss: ideally beyond the trigger candle).
- Sells: Flat (stop loss: N/A).