A note on lower timeframe confirming price action…
Waiting for lower timeframe confirmation is our main tool to confirm strength within higher timeframe zones, and has really been the key to our trading success. It takes a little time to understand the subtle nuances, however, as each trade is never the same, but once you master the rhythm so to speak, you will be saved from countless unnecessary losing trades. The following is a list of what we look for:
- A break/retest of supply or demand dependent on which way you’re trading.
- A trendline break/retest.
- Buying/selling tails/wicks – essentially we look for a cluster of very obvious spikes off of lower timeframe support and resistance levels within the higher timeframe zone.
- Candlestick patterns. We tend to only stick with pin bars and engulfing bars as these have proven to be the most effective.
We search for lower timeframe confirmation between the M15 the H1 timeframes, since most of our higher-timeframe areas begin with the H4. Stops are usually placed 5-10 pips beyond confirming structures.
EUR/USD:
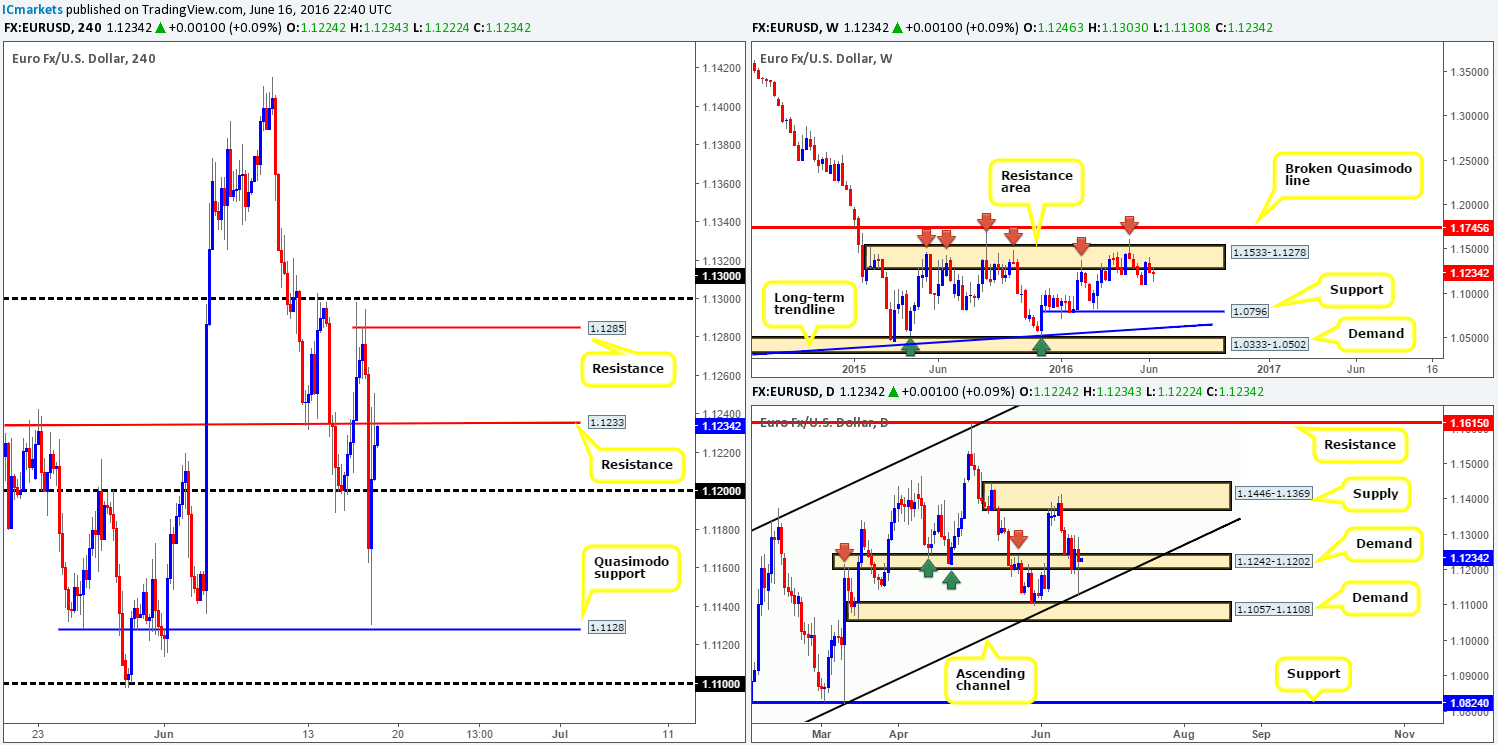
From the top this morning, the buyers and sellers are still seen battling for position around the underside of a weekly resistance area at 1.1533-1.1278. Knowing that this zone has held price lower since May 2015, further downside is still highly likely in this market. Lower down on the curve, the latest daily candlestick drove through daily demand at 1.1242-1.1202 and connected beautifully with a daily channel support line taken from 1.0516, before closing the day with a small loss at 1.1224. Stepping over to the H4 chart, we can see that following the aggressive push to lows of 1.1130 going into US trade, price ended the day cutting through the 1.12 handle and filling offers around H4 resistance drawn from 1.1233.
Our suggestions: If the EUR breaks above and retests the current H4 resistance as support, a trade north towards H4 resistance at 1.1285/1.13 could be on the cards, since let’s keep in mind that price is trading from daily demand at 1.1242-1.1202. The only grumble we’d have buying above 1.1233 is, as we mentioned above, the fact that weekly action is trading beneath a long-term weekly resistance area (see above). Therefore, for us to be permitted to trade, a lower timeframe confirming signal would need to be seen following a retest of 1.1233 (see the top of this report for confirming techniques).
In regards to selling, our team would only be interested if a close below 1.12 takes place. Nevertheless, two things would need to be seen before capital is put into this idea. Firstly, a retest of 1.12 as resistance, and secondly a lower timeframe sell signal following the retest (see the top of this report for ideas on pinning down lower timeframe setups).
Levels to watch/live orders:
- Buys: Watch for price to consume 1.1233 and look to trade any retest seen thereafter (lower timeframe confirmation required).
- Sells: Watch for price to consume 1.12 and look to trade any retest seen thereafter (lower timeframe confirmation required).
GBP/USD:
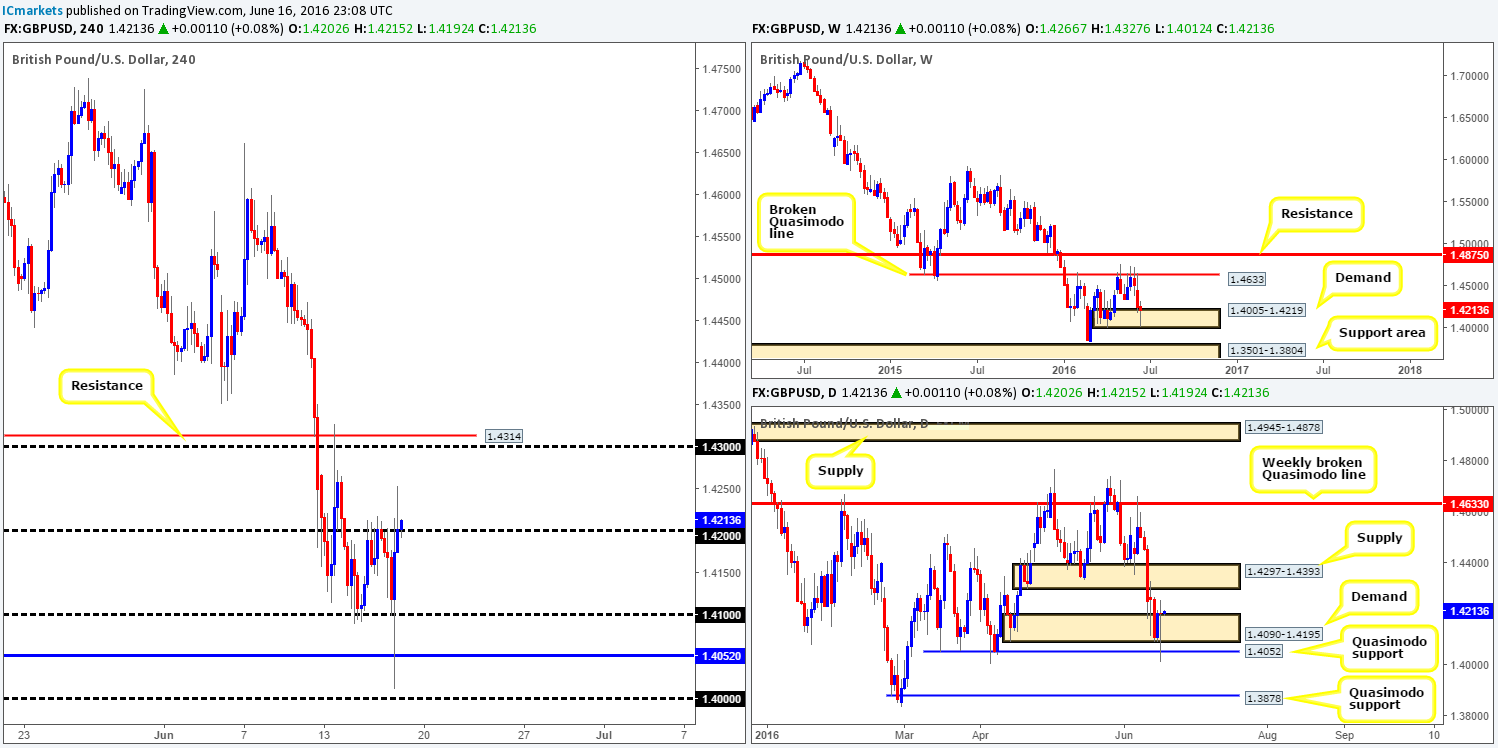
It was another exciting day for the GBP yesterday! Sterling aggressively drove to lows of 1.4012 going into US trading, momentarily surpassing through both the 1.41 handle and H4 support at 1.4052, before just as aggressively rallying back up to 1.42 into the close.
What this also did was force weekly action deep into the extremes of a weekly demand area seen at 1.4005-1.4219. In addition to this, we also saw daily price whipsaw through daily demand at 1.4090-1.4195 and connect with a daily Quasimodo support at 1.4052, before turning north.
Our suggestions: Through the simple lens of a technical trader, buying on a break above and retest of the 1.42 handle, targeting 1.43 (essentially the underside of the daily supply mentioned above at 1.4297-1.4393 which is the next upside target on that timeframe) seems a valid approach considering the higher timeframe picture (see above).
Of course it is down to the individual trader whether he/she deems the above setup a valid one, considering the current climate surrounding the ‘Brexit’ situation. We would, however, advise traders to only take this setup should lower timeframe confirmation be present following the retest of 1.42, since this helps in avoiding fakeouts which are common around psychological numbers (see the top of this report for confirming techniques).
Levels to watch/live orders:
- Buys: Watch for price to consume 1.42 and look to trade any retest seen thereafter (lower timeframe confirmation required).
- Sells: Flat (Stop loss: N/A).
AUD/USD:
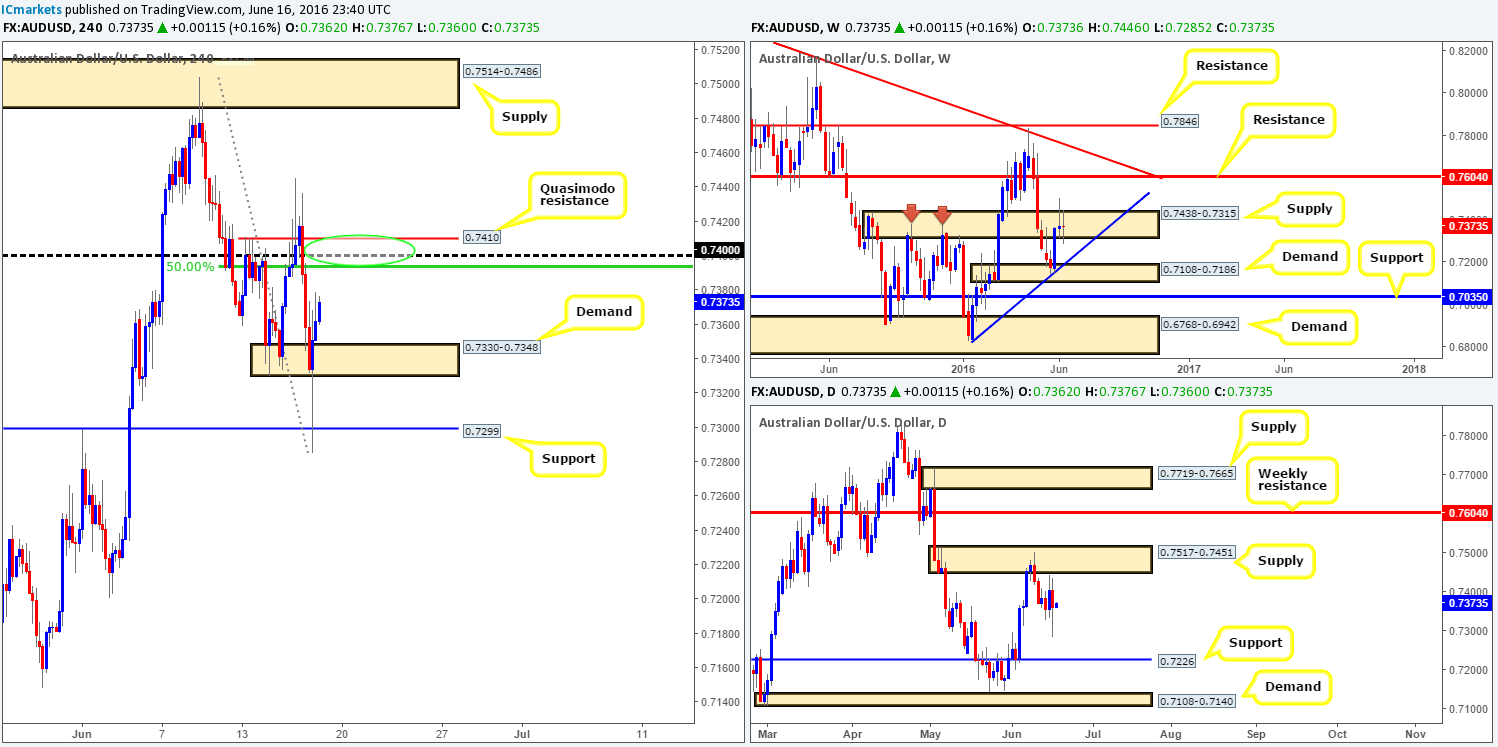
In recent trading, the commodity currency actively whipsawed through H4 demand at 0.7330-0.7348 and touched base with H4 support at 0.7299, before just as actively recovering to a high of 0.7379 by the close.
Looking over to the higher timeframes, uncertainty is being seen on the weekly chart at the moment. Price is currently chalking up a clear-cut indecision candle within the confines of a weekly supply zone seen at 0.7438-0.7315. A break above this area likely opens the path north towards weekly resistance at 0.7604, whilst a move to the downside would potentially end up with the Aussie tackling weekly trendline support extended from the low 0.6827. Down on the daily chart, nevertheless, price is seen loitering between daily supply coming in at 0.7517-0.7451 and a daily support taken from 0.7226.
Our suggestions: In view of the fact that price resides within weekly supply right now (see above), a short from the 0.74 region could be a possibility as this number also brings together a H4 Quasimodo resistance at 0.7410 as well as a H4 50.0% Fib resistance seen at 0.7393 (green circle). However, since weekly price appears uncertain at this time, we would not advise entering at this H4 sell zone without waiting for lower timeframe confirmation (see the top of this report for more information on confirming techniques). What is more, we have to keep in mind that daily price may want to connect with the aforementioned daily supply area, which may lead to the market faking above the H4 sell zone and taking stops, hence the importance of waiting for lower timeframe price action to form.
Levels to watch/live orders:
- Buys: Flat (Stop loss: N/A).
- Sells: 0.7410/0.7393 [Tentative – confirmation required] (Stop loss: dependent on where one confirms this area).
USD/JPY:
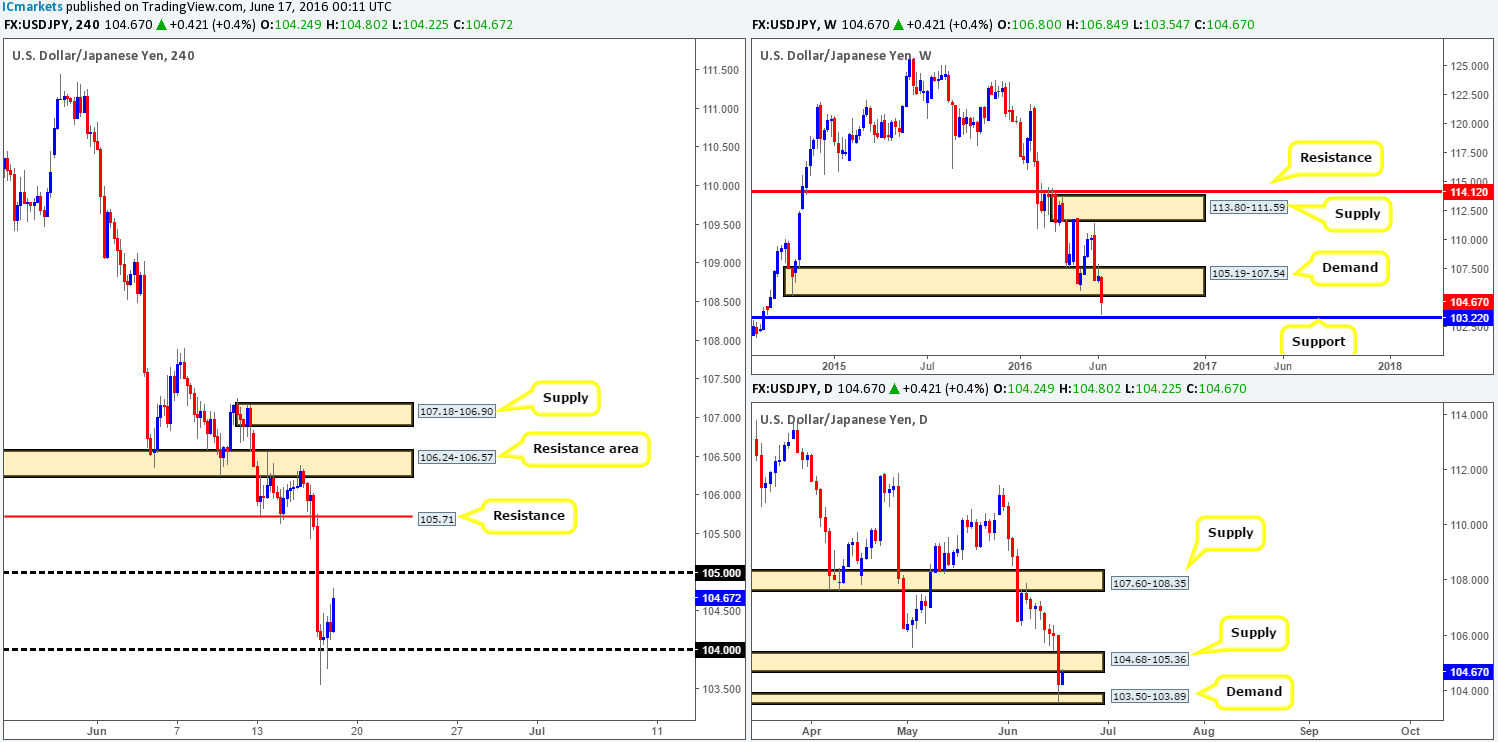
The value of the USD/JPY weakened in aggressive fashion yesterday, taking out both H4 support at 105.71 (now acting resistance) and the 105 handle. It was only once price collided with the 104 line did we see this market begin to stabilize itself. As of now, as you can see from the H4 chart, the dollar is relatively well-bid and on tracks to retest 105 as resistance. In that 105 sits within a recently broken daily demand at 104.68-105.36 (now acting supply), a bounce from this number is certainly not out of the realm of possibility. The only concern we have here comes from the weekly chart. Weekly support at 103.22 came within shouting distance of being hit yesterday before price began to correct itself. Therefore, this could, in our opinion, be enough to push this market higher and cut through the 105 hurdle.
Our suggestions: Given that the weekly candle is yet to close, it may be worth waiting until the week ends before presuming the current weekly demand is consumed as it could simply be one large fakeout in play to drive higher. Despite the weekly picture, we still feel a bounce from 105 is likely. However, to be on the safe side we would recommend waiting for lower timeframe confirmation (see top of this report for confirming techniques) before pulling the trigger, as getting on the wrong side of weekly flow would not be a pleasant experience!
Levels to watch/live orders:
- Buys: Flat (Stop loss: N/A).
- Sells: 105 region [Tentative – confirmation required] (Stop loss: dependent on where one confirms this area).
USD/CAD:
Using a top/down approach this morning, we can see that weekly action remains loitering above weekly support at 1.2538, which is bolstered by a weekly trendline support taken from the high 1.1278. Looking down to the daily chart, however, price recently whipsawed through daily resistance at 1.2970 and tagged in offers from daily supply at 1.3218-1.3086. Over on the H4 chart, this recent movement brought price into the jaws of a H4 support line seen at 1.2911, which for the time being is holding firm.
Given where the loonie is positioned on the higher timeframe picture right now (see above), buying from this support is not really something we’d stamp high probability.
Our suggestions: Watch for a break below and retest of the current H4 support. Should this come to fruition and assuming lower timeframe price action is agreeable we would look to sell this pair, targeting the H4 mid-way support at 1.2850, followed by the 1.28 handle.
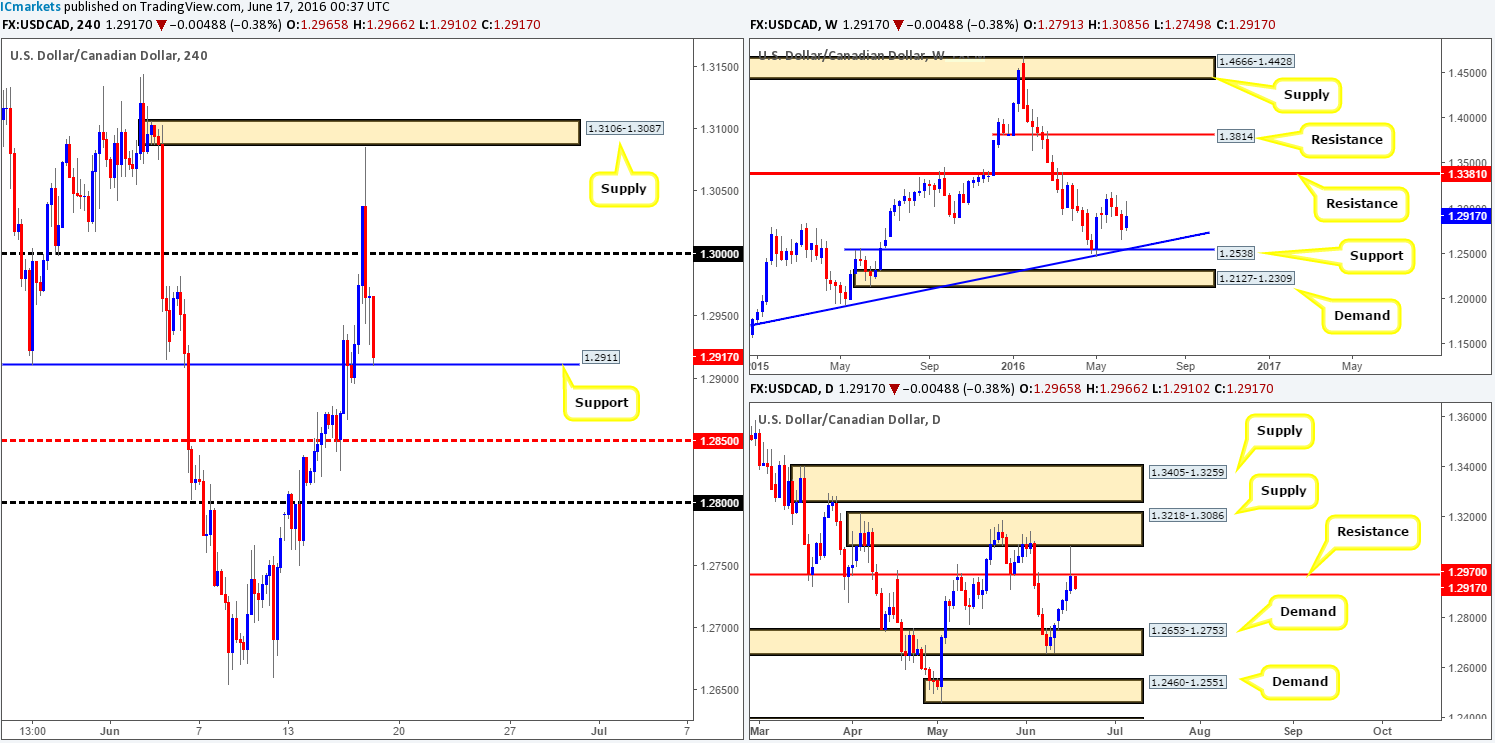
Levels to watch/live orders:
- Buys: Flat (Stop loss: N/A).
- Sells: Watch for price to consume 1.2911 and look to trade any retest seen thereafter (lower timeframe confirmation required).
USD/CHF:
The Swissy saw a boost of buying come into the market yesterday, following the SNB (Swiss National Bank) leaving interest rates unchanged. Consequent to this, the pair touched gloves with H4 resistance at 0.9684 going into London lunchtime, which, as you can see, reversed prices going into US trading to lows of 0.9636 on the day.
As far as the higher timeframes are concerned, daily action is currently sandwiched between a daily supply zone at 0.9663-0.9708 and a daily Quasimodo support at 0.9584 (bolstered by daily trendline support taken from the low 0.9078). Looking up to the weekly chart, however, the bears remain in control of this market (despite the recent bullish pullback) with price now looking like it will connect with weekly support at 0.9508 sometime soon (coincides nicely with trendline support taken from the low 0.9078).
Our suggestions: Watch for a lower timeframe sell signal around the underside of the H4 mid-way resistance at 0.9650, targeting the 0.96 handle as a first take-profit zone. At this point we’d also advise reducing your risk to breakeven since sixteen pips below 0.96 sits the daily Quasimodo support mentioned above at 0.9584.
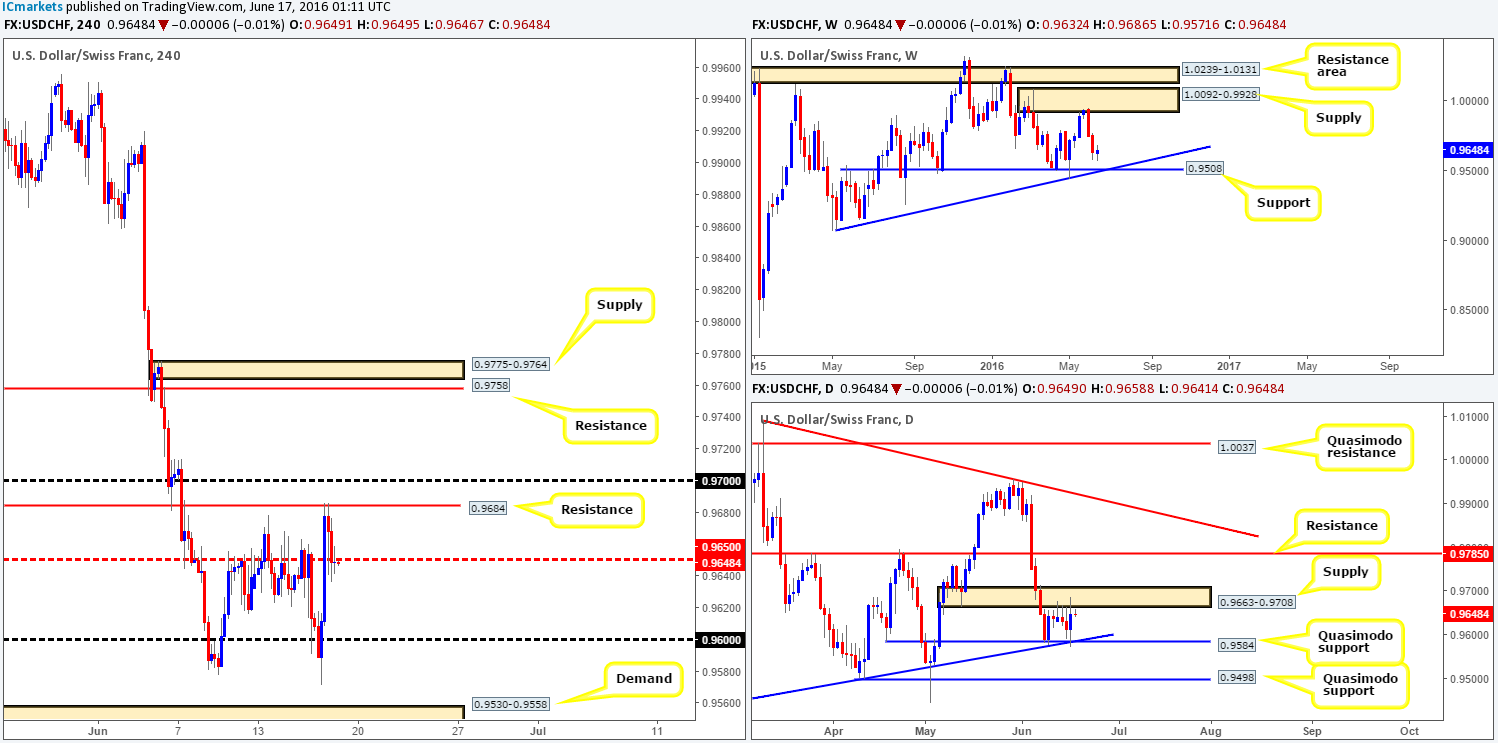
Levels to watch/live orders:
- Buys: Flat (Stop loss: N/A).
- Sells: 0.9650 region [Tentative – confirmation required] (Stop loss: dependent on where one confirms this area).
DOW 30:
Amid early hours of US trading yesterday the DOW aggressively recovered from deep within H4 demand at 17463-17509, and rallied to highs of 17780 by the day’s end. As is shown on the H4 chart, resistance at 17753 was taken out and is now within shouting distance of being retested as support. On the assumption that this line is well-bid, price has, as far as we can see, the potential to rally to at least H4 resistance at 17920. The reason for this lies within the higher timeframe picture, as both the weekly and daily charts show this unit trading from support areas (17446-17606/ 17396-17554).
Our suggestions: Put simply, we are going to be keeping a close eye on the H4 support at 17753 for a potential buying opportunity today, targeting the above said H4 resistance at 17920 (as per the green arrows). Lower timeframe confirmation will still be required here even though we’re effectively buying in-line with higher timeframe flow. For ideas on how to spot confirming setups, see the top of this report.
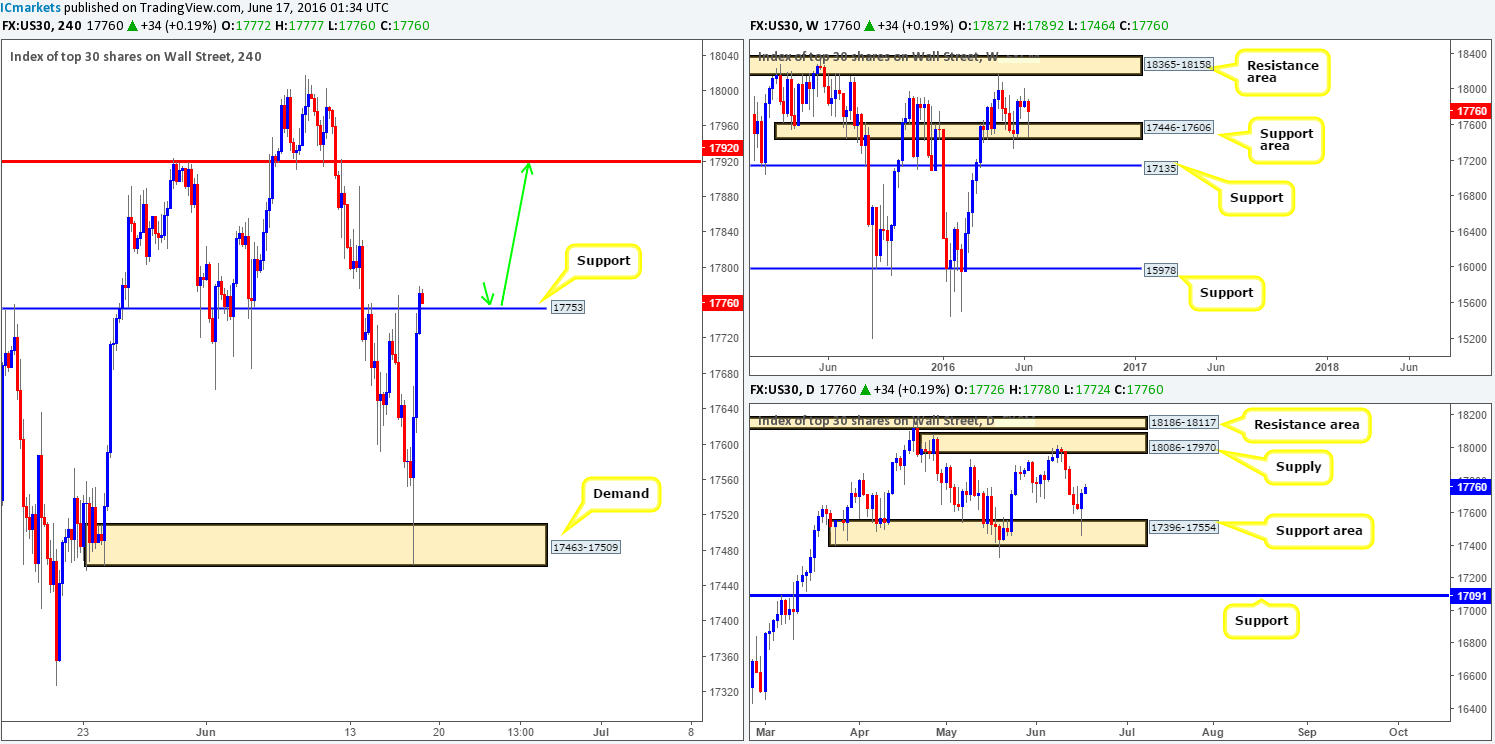
Levels to watch/live orders:
- Buys: 17753 region [Tentative – confirmation required] (Stop loss: dependent on where one confirms this area).
- Sells: Flat (Stop loss: N/A).
GOLD:
(Trade update: Stopped out at 1309.0).
Kicking-off our analysis with a look at the weekly chart this morning, recent action shows price spiked above weekly supply at 1307.4-1280.0 and has sold-off. Assuming that offers continue to suppress bids, there is a strong possibility that the yellow metal may head back down to connect with weekly demand coming in at 1205.6-1181.2. Before the sellers can push this market down this far, however, daily support at 1262.2 will need to be taken out, as the path south then appears clear down to daily demand at 1199.5-1210.6 (sits on top of the above said weekly demand base).
Looking over to the H4 chart, gold blasted through the H4 Quasimodo resistance at 1305.3 yesterday (and took our sell position out of the market) and went on to plug into offers around a H4 resistance line coming in at 1315.4, which saw price aggressively tumble lower.
Our suggestions: Watch for price to break below and retest the current H4 demand area at 1282.1-1278.5. This, assuming we were able to pin down a lower timeframe sell setup following the retest, would be enough for us to short the metal down to H4 demand seen at 1264.4-1266.5 (sits just above the aforementioned daily support line) as a first take-profit target.
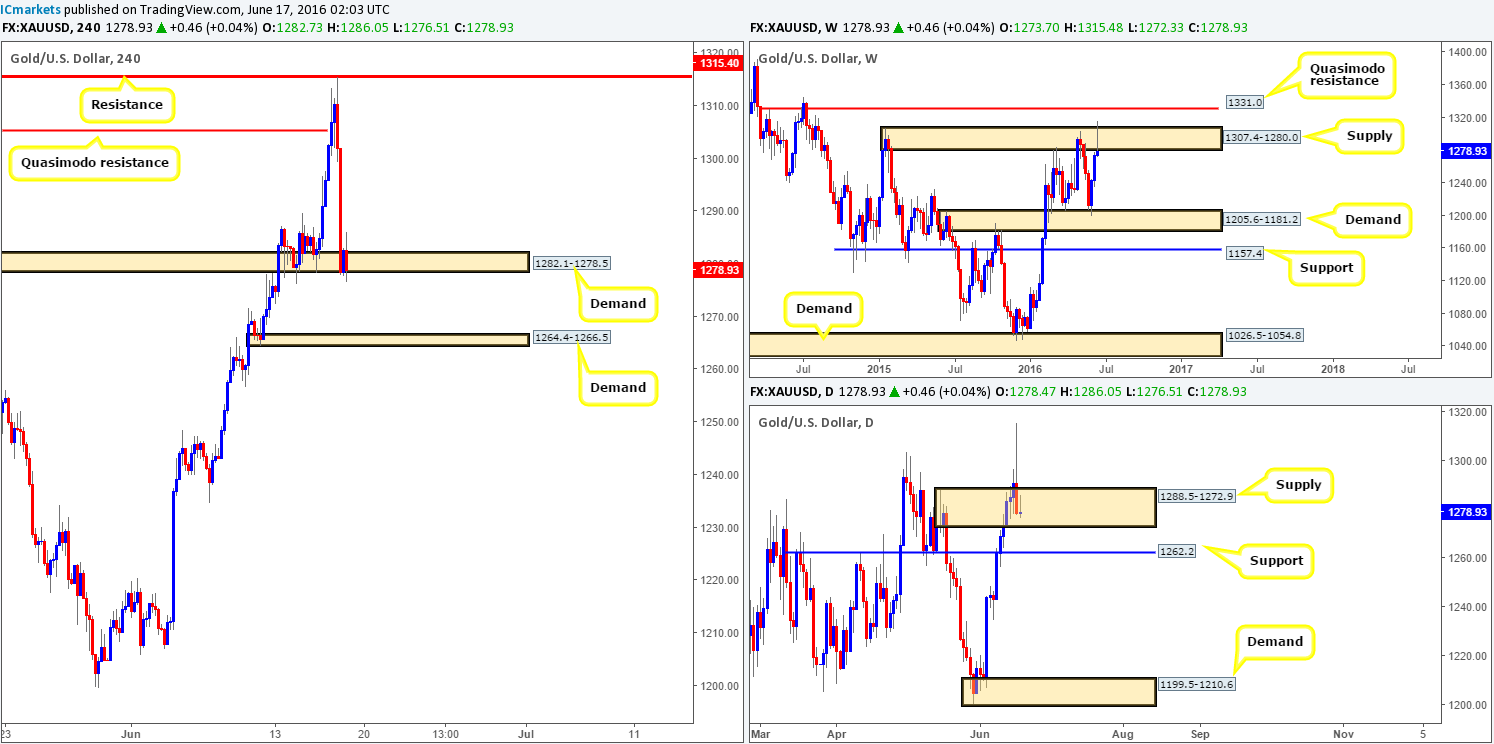
Levels to watch/live orders:
- Buys: Flat (Stop loss: N/A).
- Sells: Watch for price to consume 1282.1-1278.5 and look to trade any retest seen thereafter (lower timeframe confirmation required).


