EUR/USD:
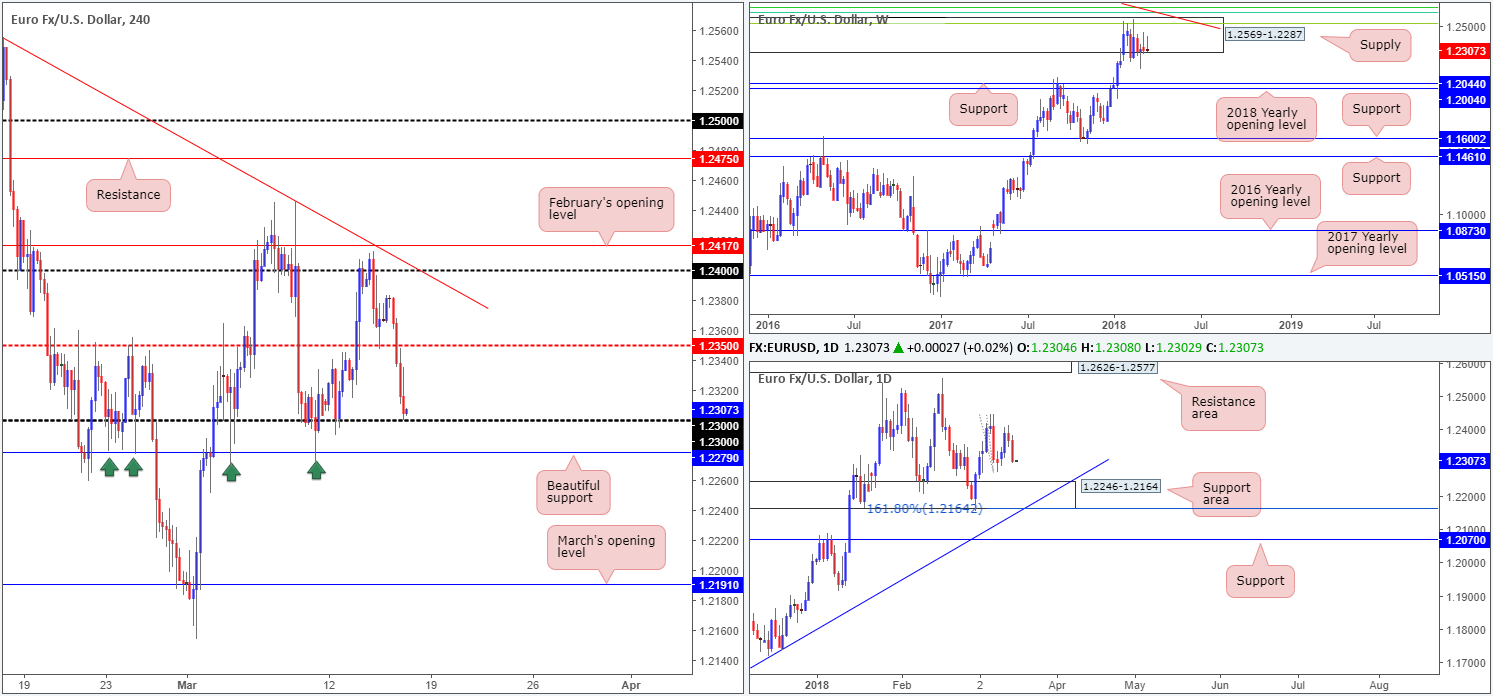
The shared currency came under pressure on Thursday, despite penciling in a reasonably solid recovery from the H4 mid-level support 1.2350 on Wednesday.
With the DXY reclaiming the 90.00 mark, the EUR/USD, in the shape of a near-full-bodied daily bearish candle, engulfed 1.2350 and concluded the day challenging the 1.23 handle. Beyond 1.23 there’s immediate H4 support positioned at 1.2279. A violation of this line may set the stage for a continuation move down to March’s opening line at 1.2191.
Upside remains capped by a major-league supply zone coming in at 1.2569-1.2287 on the weekly timeframe. The current candle, as you can see, is also on track to print its second consecutive weekly selling wick (bearish pin bar). Downside targets from this zone fall in around the weekly support band at 1.2044, shadowed closely by the 2018 yearly opening level at 1.2004.
The story on the daily timeframe, nonetheless, shows price on course to press lower and challenge the nearby daily support zone at 1.2246-1.2164, which happens to intersect with a daily trendline support extended from the low 1.0569.
Potential trading zones:
Having noted that both weekly and daily price could possibly push south, buying from 1.23 or the H4 support at 1.2279 would be a chancy move, in our humble view.
What about shorts beneath these hurdles? Usually this would be the favored approach. However, in this case, after breaking 1.2279 you’ll have less than 30 pips to play with before reaching the top edge of the daily support area mentioned above at 1.2246-1.2164! So unless you’re able to pin down a setup between this void, this market may be best left on the back burner today.
Data points to consider: EUR Final CPI y/y at 10am; US housing figures at 12.30pm; US industrial production m/m and capacity utilization rate at 1.15pm; US prelim UoM consumer sentiment at 2pm GMT.
Areas worthy of attention:
Supports: 1.23; 1.2279; 1.2191; 1.2246-1.2164; daily trendline support; 1.2004/1.2044.
Resistances: 1.2350; 1.2569-1.2287.
GBP/USD:
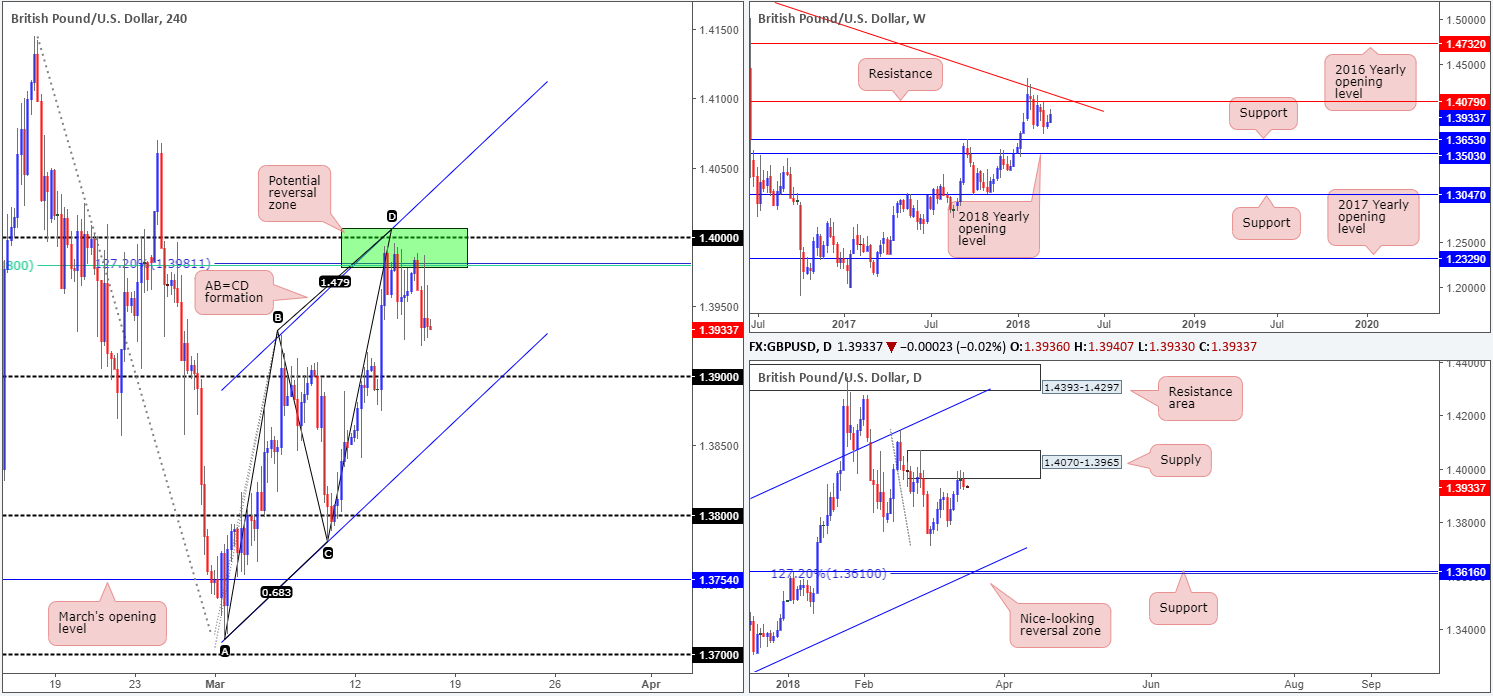
On the back of a robust US dollar, the British pound headed lower in recent trade. As is evident from the H4 timeframe, the sell zone marked in green at 1.4008/1.3980 remains in the fray (comprised of the key psychological level 1.40, a H4 channel resistance taken from the high 1.3929, a H4 AB=CD 127.2% Fib ext. point at 1.3981 and a 61.8% H4 Fib resistance at 1.3980). Also noteworthy is the aforesaid H4 sell zone is seen housed within the lower limits of a daily supply base at 1.4070-1.3965.
With H4 price establishing ground beneath the 1.3950 point amid US trade on Thursday, the 1.39 handle is likely the next base on the hit list. The ultimate target for those short from 1.4008/1.3980, nonetheless, is around the opposite side of the H4 channel: the H4 trendline support taken from the low 1.3711.
Potential trading zones:
Apart from the current H4 sell zone in motion, we do not really see much else to hang our hat on in terms of additional trading setups.
Data points to consider: US housing figures at 12.30pm; US industrial production m/m and capacity utilization rate at 1.15pm; US prelim UoM consumer sentiment at 2pm GMT.
Areas worthy of attention:
Supports: 1.39; H4 channel support.
Resistances: 1.4008/1.3980; 1.4070-1.3965.
AUD/USD:
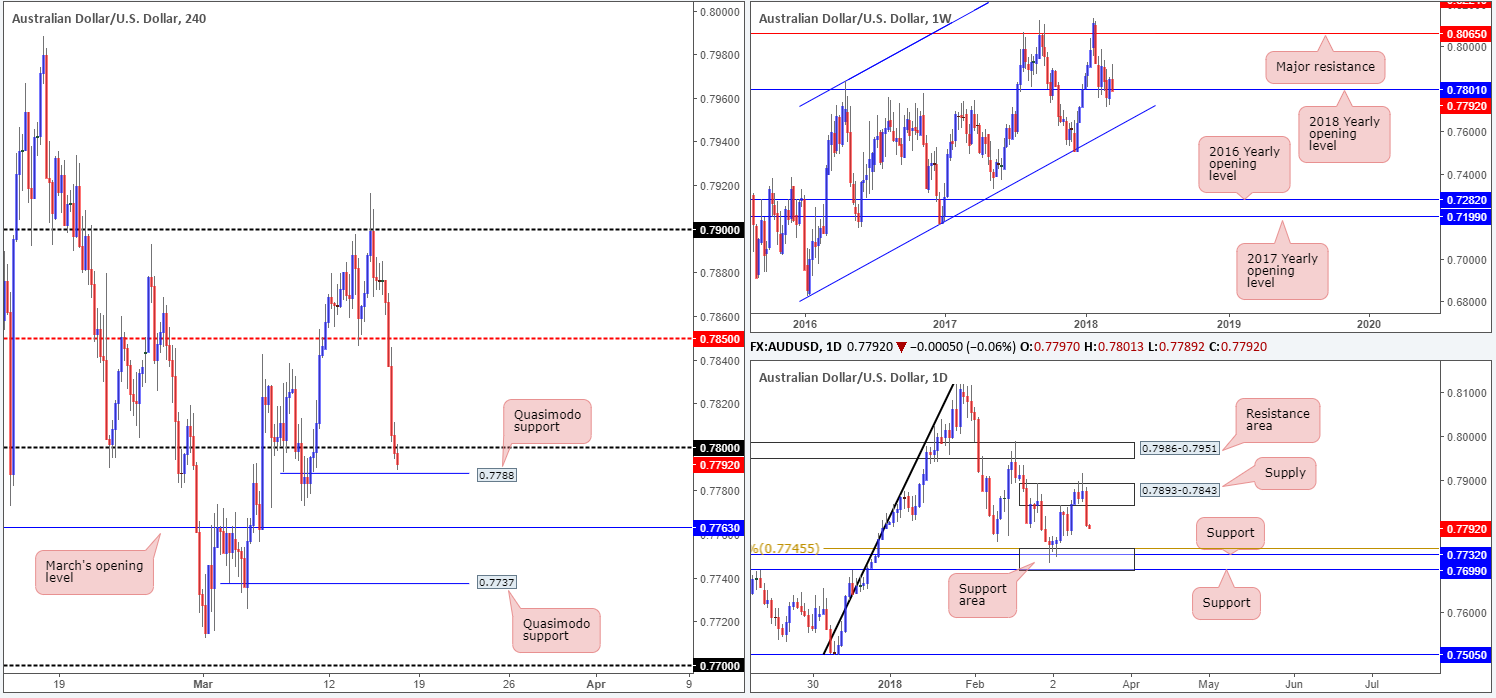
As the markets entered London trade on Thursday, the commodity currency quickly spun into a risk-off mood. The move swallowed bids sited at the H4 mid-level support 0.7850 and eventually took out the 0.78 handle, leaving price action now free to shake hands with a nearby H4 Quasimodo support at 0.7788.
Shaped in the form of a near-full-bodied daily bearish candle, daily movement drove lower from daily supply at 0.7893-0.7843 yesterday, and is now positioned ahead of a daily support area at 0.7699/0.7745. Recent activity on the weekly timeframe chalked up a marginal close beyond the 2018 yearly opening level at 0.7801. Continued downside from this point could eventually pull things as low as a long-term weekly channel support etched from the low 0.6827.
Potential trading zones:
Technically speaking, longs from the current H4 Quasimodo support could be an option today once/if a H4 close is seen printed back above 0.78 (a retest of 0.78 as support would be an ideal signal to enter long). The reasoning for liking this area for a buy is simply due to 0.78 converging with the 2018 yearly opening mentioned above on the weekly timeframe, despite its recent breach.
Data points to consider: US housing figures at 12.30pm; US industrial production m/m and capacity utilization rate at 1.15pm; US prelim UoM consumer sentiment at 2pm GMT.
Areas worthy of attention:
Supports: 0.7788; 0.7699/0.7745; weekly channel support.
Resistances: 0.7893-0.7843; 0.78.
USD/JPY:
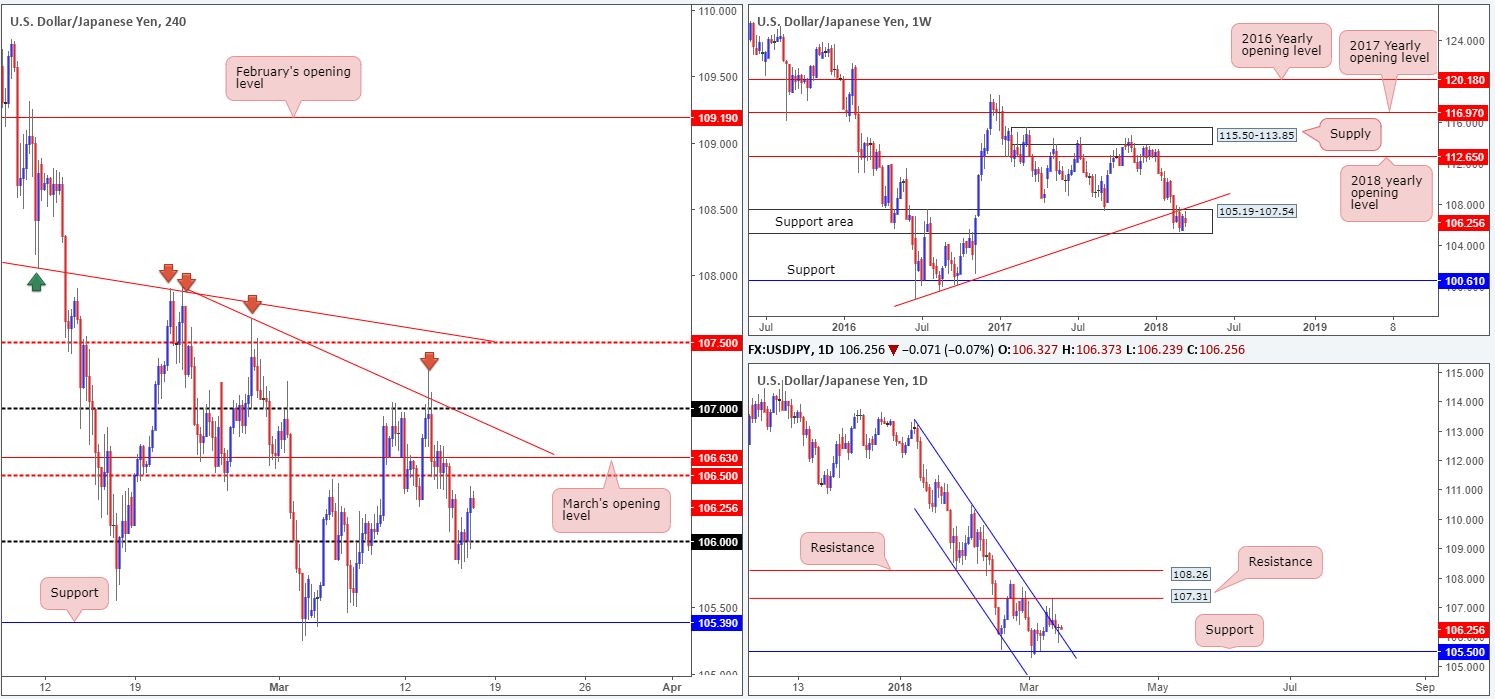
Following a series of H4 buying tails at 106, the H4 candles eventually climbed higher on Thursday, largely driven by upbeat US equities and a robust US dollar. Upside on the H4 timeframe, however, is somewhat limited. Nearby we have a H4 mid-level resistance plotted at 106.50, shadowed closely by March’s opening level at 106.63 and then a H4 trendline resistance taken from the high 107.90.
Weekly movement remains trading within the walls of a weekly support area at 105.19-107.54, but continues to reflect a bearish tone below the nearby weekly trendline support-turned resistance etched from the low 98.78. Daily price, on the other hand, recently breached and retested a daily channel resistance line taken from the high 113.38 in the shape of a bullish pin-bar formation. Should further buying be seen today, keep an eye on the daily resistance level at 107.31.
Potential trading zones:
Irrespective of the direction one selects today, you’ll face opposing higher-timeframe structure.
- A buy looks great on the retest of the recently broken daily channel resistance, but chancy on both weekly and H4 structure.
- The same goes for a sell unfortunately. Selling from the noted H4 structures would not only have you selling into a weekly support area, but also against potential daily flow.
Data points to consider: US housing figures at 12.30pm; US industrial production m/m and capacity utilization rate at 1.15pm; US prelim UoM consumer sentiment at 2pm GMT.
Areas worthy of attention:
Supports: 106 handle; 105.19-107.54; daily channel support.
Resistances: 106.50; 106.63; H4 trendline resistance; weekly trendline resistance; 107.31.
USD/CAD:
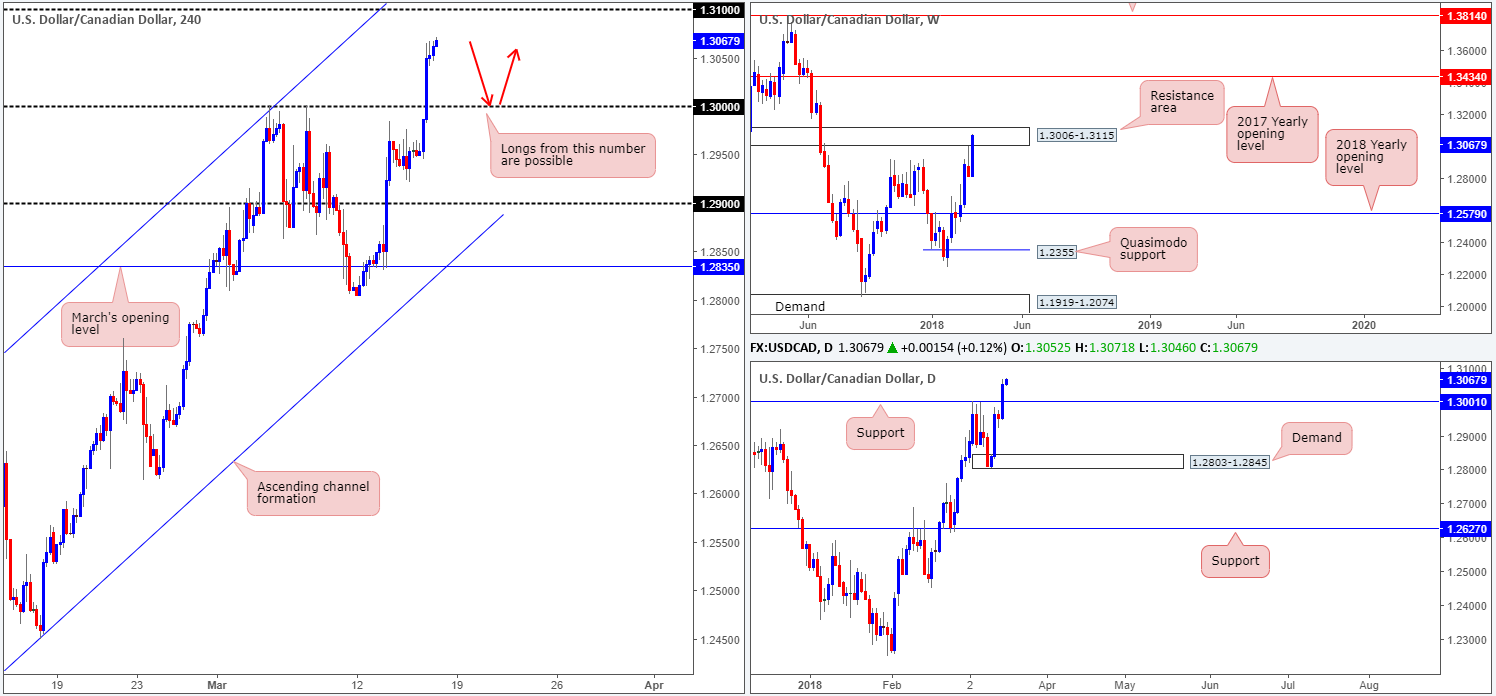
USD/CAD bulls went on the offensive amid Thursday’s segment, which saw the unit trip stops through the 1.30 level to a 9-month high of 1.3066. Supported by a pickup in dollar buying, the pair caught strong bids during London’s morning session that continued into US trade.
On the H4 timeframe, this has positioned the 1.31 handle on the radar, which is seen located within the upper limits of a weekly resistance area coming in at 1.3006-1.3115. Daily movement, on the other hand, shows room to press as far north as the daily resistance level at 1.3207, following a recent breach of daily resistance at 1.3001.
Potential trading zones:
Given the solid break of 1.30 and the daily resistance at 1.3001, a retest of these levels as support is likely on the radar for most traders this morning. The only concern buying this level would, of course, be the fact that weekly price is coming from a weekly resistance area! Therefore, it may be an idea to wait for additional candle confirmation to form from 1.30 should you intend on buying (a H4 full or near-full-bodied bull candle would be sufficient).
Data points to consider: US housing figures at 12.30pm; US industrial production m/m and capacity utilization rate at 1.15pm; US prelim UoM consumer sentiment at 2pm; CAD foreign securities purchases and manufacturing sales m/m at 12.30pm GMT.
Areas worthy of attention:
Supports: 1.30; 1.3001.
Resistances: 1.31; 1.3006-1.3115; 1.3207.
USD/CHF:
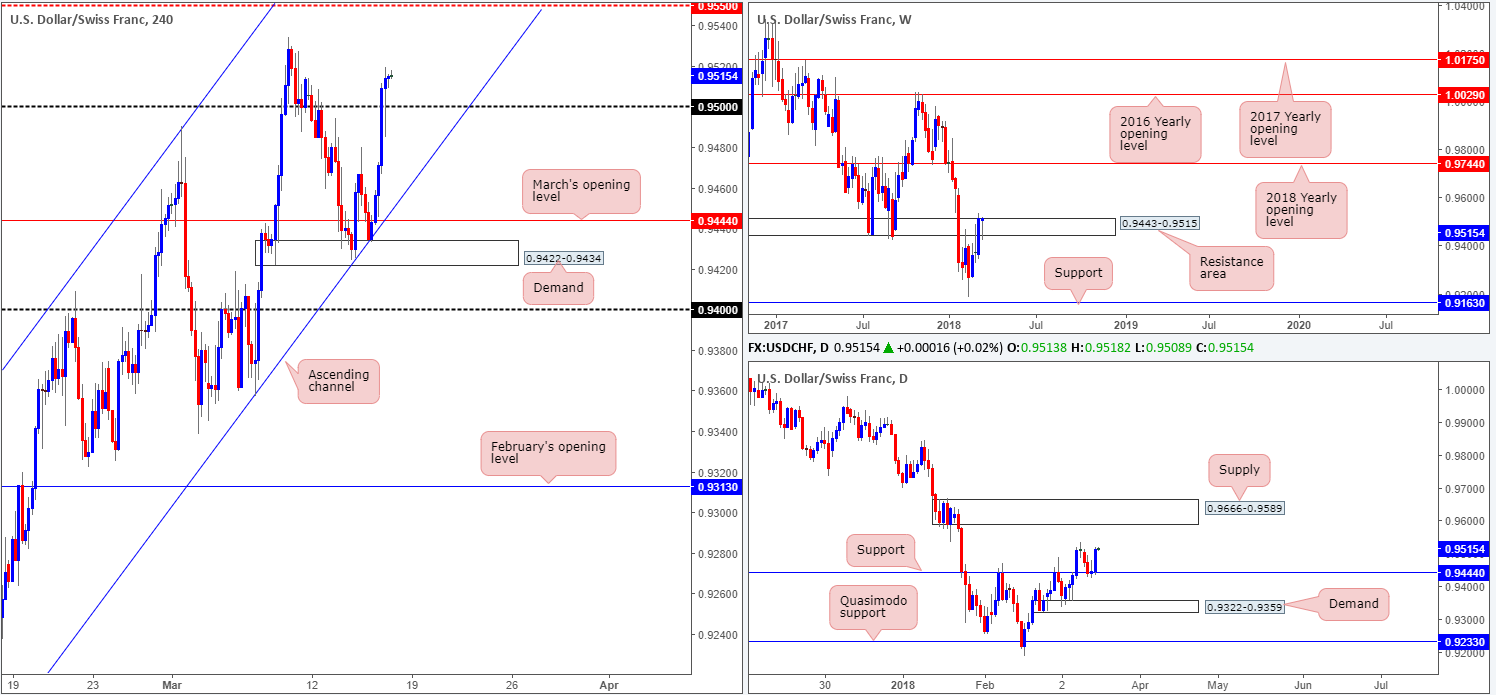
The Swiss National Bank, as expected, left its monetary policy unchanged, which forced the Swiss franc lower across the board.
The USD/CHF reaffirmed its uptrend on Thursday after beautifully retesting daily support at 0.9444, firmly placing the daily supply at 0.9666-0.9589 on the radar. At the same time, this has placed weekly sellers under pressure from within the resistance area plotted at 0.9443-0.9515. A firm push above this zone could lead to a test of the 2018 yearly opening level at 0.9744 in the coming weeks.
A little lower down on the curve, we can see that H4 price recently crossed above the 0.95 handle and retested as support in strong fashion. The next upside objective from this point falls in around the H4 mid-level resistance at 0.9550. It might also be worth noting that the team does not see much active supply to the left of current price on the H4 scale.
Potential trading zones:
According to our technicals, further buying is likely on the cards, with upside targets positioned at 0.9550, followed closely by the lower edge of daily supply at 0.9589. Therefore, one could look to buy the recent retest of 0.95 – the pin-bar formation – with stops plotted below its tail at 0.9485.
Data points to consider: US housing figures at 12.30pm; US industrial production m/m and capacity utilization rate at 1.15pm; US prelim UoM consumer sentiment at 2pm GMT.
Areas worthy of attention:
Supports: 0.95; 0.9444.
Resistances: 0.9550; 0.9443-0.9515; 0.9666-0.9589.
DOW 30:
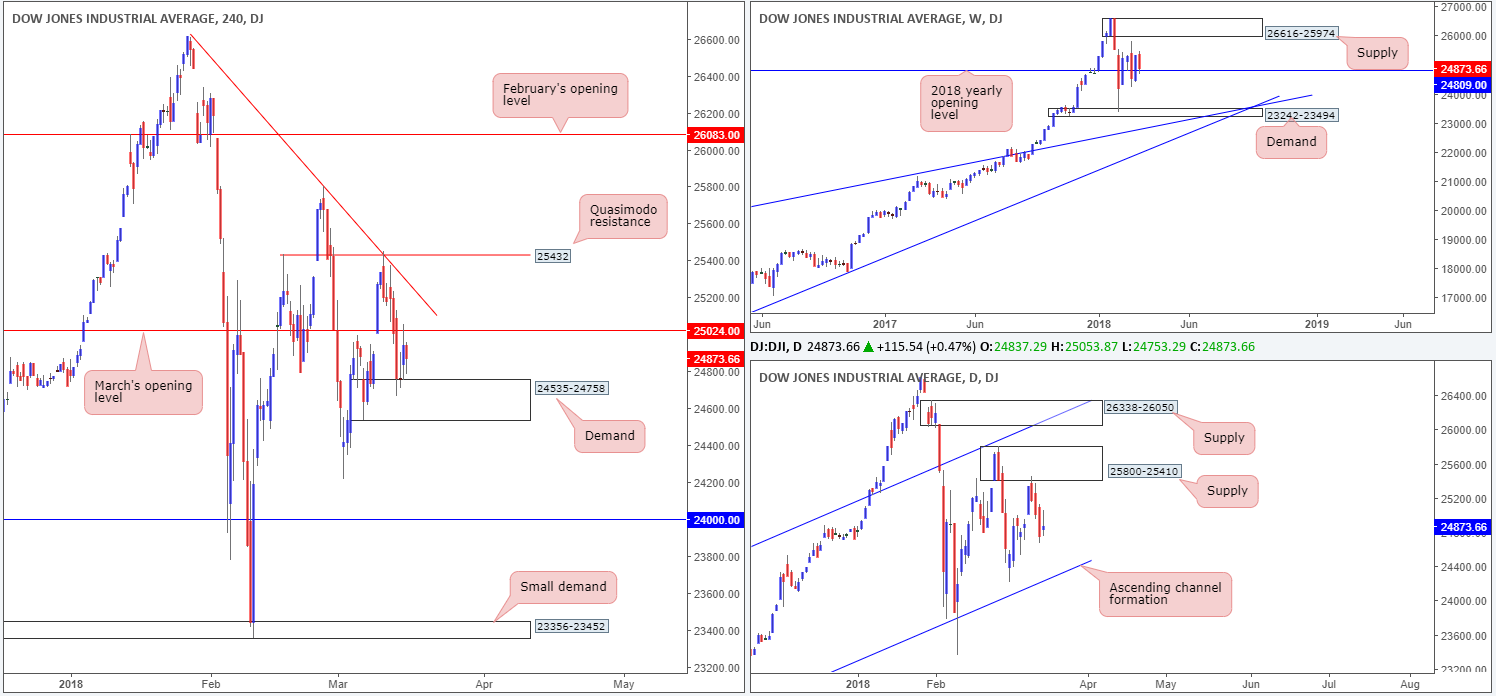
The DJIA opened the session on a strong footing on Thursday from H4 demand based at 24535-24758, but lost momentum once the index shook hands with March’s opening level at 25024. Comments from Kudlow, Trump’s top economic adviser, triggered concerns as he lightly called for a stronger dollar.
Turning over a page to the weekly timeframe, we can see that recent activity brought price marginally back above the 2018 yearly opening level at 24809. Nevertheless, given the past few weeks of action, direction is still somewhat limited here at the moment. According to the daily timeframe, though, further selling could very well be on the cards. After responding beautifully from daily supply at 25800-25410 on Monday, the index shows room to press as far south as the daily channel support extended from the low 17883.
Potential trading zones:
Initial thoughts were to look for shorts beyond the current H4 demand area as this could trigger further selling down to the 24K mark on the H4 timeframe. However, caution is warranted here, since there’s only a few points space before we reach the noted daily channel support.
Data points to consider: US housing figures at 12.30pm; US industrial production m/m and capacity utilization rate at 1.15pm; US prelim UoM consumer sentiment at 2pm GMT.
Areas worthy of attention:
Supports: 24535-24758; 24809; daily channel support.
Resistances: 25800-25410; 25024.
GOLD:
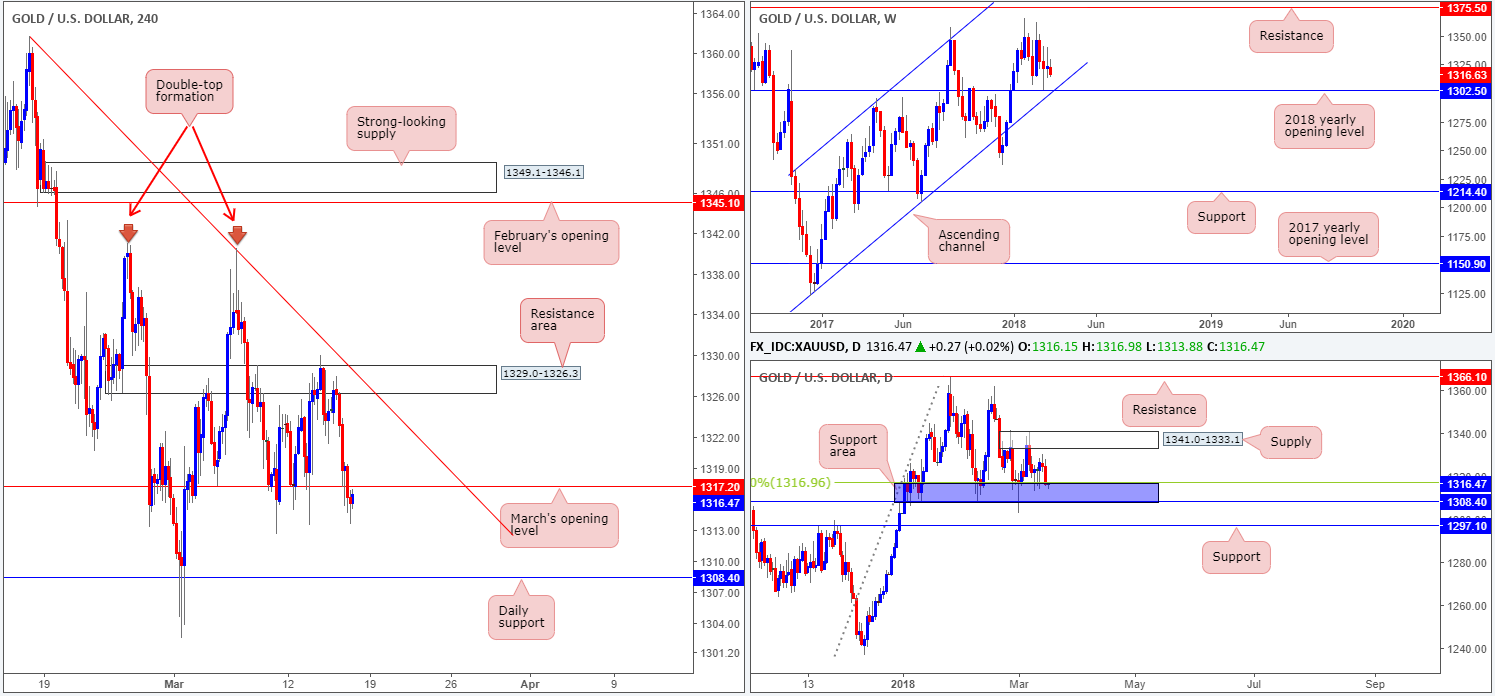
A favored dollar on Thursday placed the yellow metal in a vulnerable position. H4 price, after sporting a strong downward move from the H4 resistance area at 1329.0-1326.3, eventually penetrated March’s opening level at 1317.2.
While we agree that the break of 1317.2 is considered a bearish signal, the other key thing to note here is that daily price re-entered the jaws of a daily support area marked in blue at 1308.4/1316.9. On top of this, though, traders also need to take into account that weekly price could potentially force bullion through the daily support area to challenge the 2018 yearly opening level at 1302.5, which happens to fuse beautifully with a long-term weekly channel support etched from the low 1122.8.
Potential trading zones:
Trading any retest seen of 1317.2 is not a setup we would label high probability, due to the position of price on the daily timeframe.
Unless weekly sellers enter the fray today, the expectation is for the unit to reclaim 1317.2 and perhaps push into positive territory. To trade this potential move, look for H4 price to firmly retest 1317.2 as support before pulling the trigger, targeting 1329.0-1326.3 as the ultimate take-profit zone.
Areas worthy of attention:
Supports: 1308.4/1316.9; 1302.5; weekly channel support.
Resistances: 1341.0-1333.1; 1329.0-1326.3; 1317.2.
This site has been designed for informational and educational purposes only and does not constitute an offer to sell nor a solicitation of an offer to buy any products which may be referenced upon the site. The services and information provided through this site are for personal, non-commercial, educational use and display. IC Markets does not provide personal trading advice through this site and does not represent that the products or services discussed are suitable for any trader. Traders are advised not to rely on any information contained in the site in the process of making a fully informed decision.
This site may include market analysis. All ideas, opinions, and/or forecasts, expressed or implied herein, information, charts or examples contained in the lessons, are for informational and educational purposes only and should not be construed as a recommendation to invest, trade, and/or speculate in the markets. Any trades, and/or speculations made in light of the ideas, opinions, and/or forecasts, expressed or implied herein, are committed at your own risk, financial or otherwise.
The use of the site is agreement that the site is for informational and educational purposes only and does not constitute advice in any form in the furtherance of any trade or trading decisions.
The accuracy, completeness and timeliness of the information contained on this site cannot be guaranteed. IC Markets does not warranty, guarantee or make any representations, or assume any liability with regard to financial results based on the use of the information in the site.
News, views, opinions, recommendations and other information obtained from sources outside of www.icmarkets.com.au, used in this site are believed to be reliable, but we cannot guarantee their accuracy or completeness. All such information is subject to change at any time without notice. IC Markets assumes no responsibility for the content of any linked site. The fact that such links may exist does not indicate approval or endorsement of any material contained on any linked site.
IC Markets is not liable for any harm caused by the transmission, through accessing the services or information on this site, of a computer virus, or other computer code or programming device that might be used to access, delete, damage, disable, disrupt or otherwise impede in any manner, the operation of the site or of any user’s software, hardware, data or property.