A note on lower timeframe confirming price action…
Waiting for lower timeframe confirmation is our main tool to confirm strength within higher timeframe zones, and has really been the key to our trading success. It takes a little time to understand the subtle nuances, however, as each trade is never the same, but once you master the rhythm so to speak, you will be saved from countless unnecessary losing trades. The following is a list of what we look for:
- A break/retest of supply or demand dependent on which way you’re trading.
- A trendline break/retest.
- Buying/selling tails/wicks – essentially we look for a cluster of very obvious spikes off of lower timeframe support and resistance levels within the higher timeframe zone.
- Candlestick patterns. We tend to stick with pin bars and engulfing bars as these have proven to be the most effective.
We search for lower timeframe confirmation between the M15 and H1 timeframes, since most of our higher-timeframe areas begin with the H4. Stops are usually placed 3-5 pips beyond confirming structures.
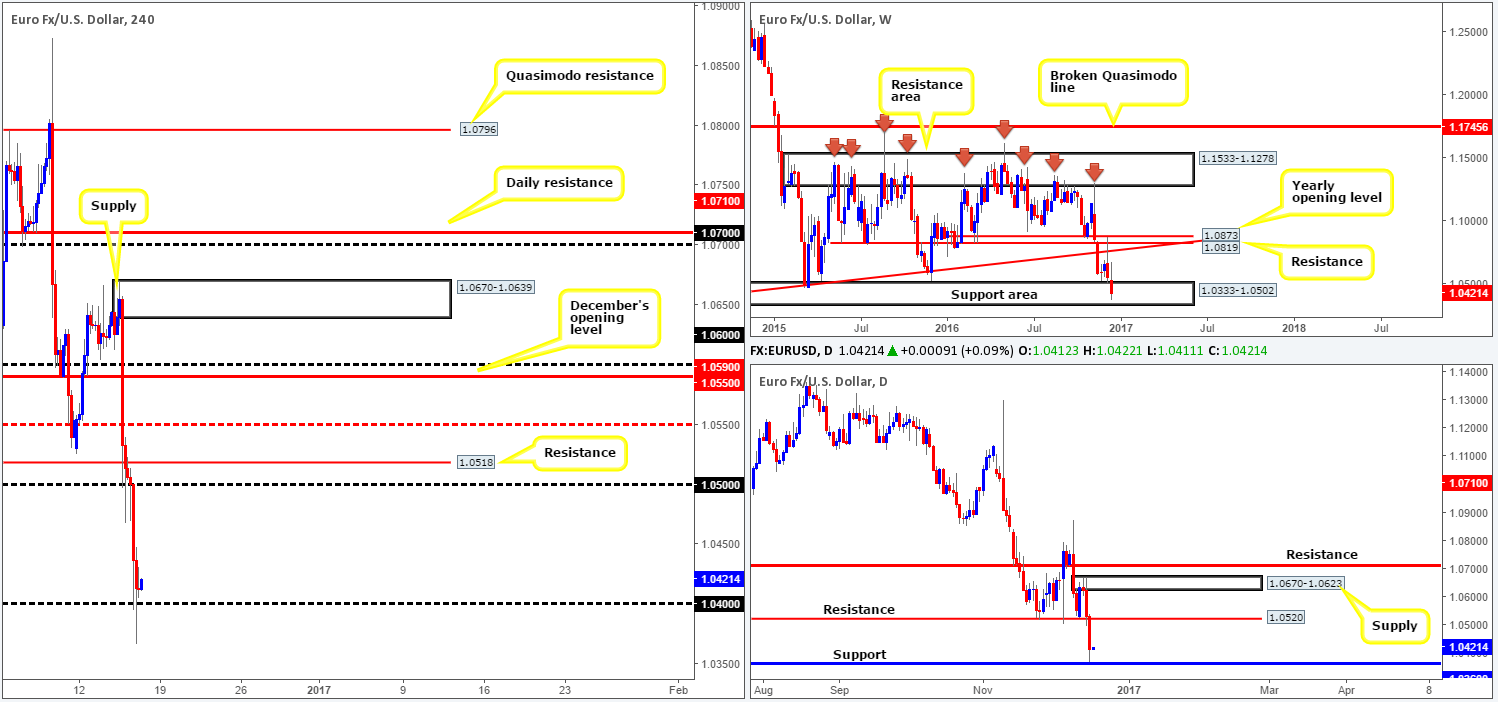
EUR/USD:
(Trade update: Took a small loss at 1.0460 – please see Thursday’s report for details).
Motivated by the Fed’s decision to increase the benchmark interest rate 25 basis points on Wednesday to 0.75%, the US dollar continued to press higher against the majority of its major trading peers yesterday (see the US dollar index). In response to this, following a short-lived bounce from the 1.05 neighborhood the shared currency fell sharply during yesterday’s sessions, ending the day settling around the 1.04 handle.
As far as higher-timeframe structure goes, the pendulum appears to be swinging toward more of a rally north. The weekly candles presently occupy a support area coming in at 1.0333-1.0502, while on the daily chart, price recently came within striking distance of linking with a support level at 1.0360: a barrier that can be seen stretching all the way back to 1999!
Our suggestions: While buying from the 1.04 hurdle looks promising considering what the bigger picture is showing right now, we remain cautious. Traders may have noticed the H4 whipsaw seen through 1.04 in recent candles. This move likely triggered a truckload of stops, thus taking out the majority of the buyers here and potentially weakening the level. Furthermore, there has been very little bullish intention registered at this line in the form of a H4 close higher. These two points, along with the Fed predicting further interest-rate hikes in the future, thus increasing demand for the dollar, cast doubt on 1.04 as a buy zone. As a result, we feel it may be best to remain on the bench today and reassess going into Monday’s sessions.
However, we must point out that stop runs are common around psychological levels. And, in view of the higher-timeframe structures, there is a chance traders with big pockets will buy into those stops (sell stops) and push the EUR higher today. This, in the current climate though may not be the case, so trade safe!
Data points to consider: EUR Final CPI reading, along with US housing figures at 1.30pm GMT.
Levels to watch/live orders:
- Buys: Flat (stop loss: N/A).
- Sells: Flat (stop loss: N/A).
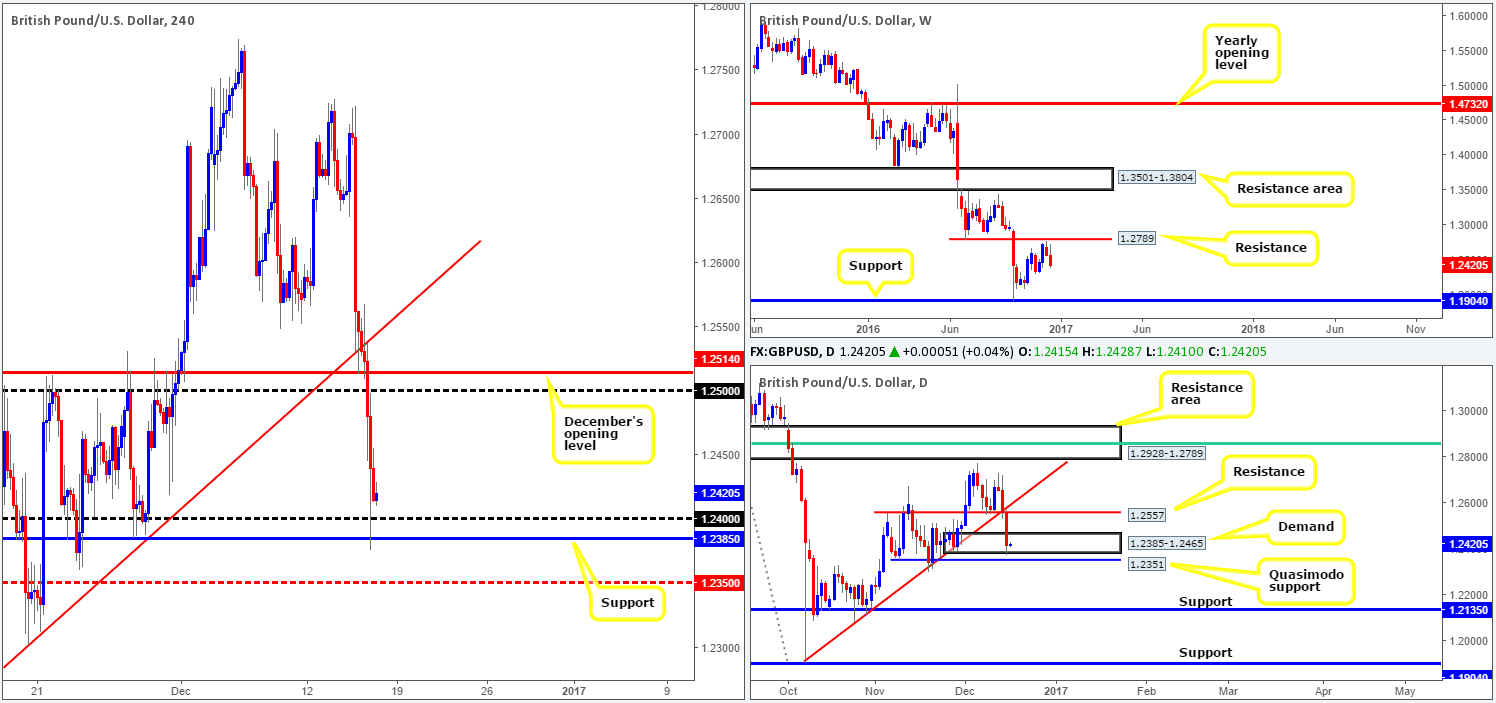
GBP/USD:
Thanks largely to the Fed hiking rates on Wednesday as well as expectations of further increases in the future, the GBP extended Wednesday’s losses yesterday, consequently running through bids seen around December’s opening level at 1.2514 and the psychological band 1.25. As you can see, in recent candles with the help of H4 support lurking at 1.2385, the 1.24 handle held firm going into yesterday’s close. This begs the question, is this barrier stable enough to consider a buy from today? Well, with weekly flow heading south at the moment (after coming within touching distance of connecting with resistance seen at 1.2789), and daily demand at 1.2385-1.2465, despite suffering a slight breach yesterday, remaining firm, we are not keen on 1.24. Of particular interest here, however, is the Quasimodo support level chiseled in just below it at 1.2351 in that a fakeout through demand could be on the cards.
Our suggestions: Looking to buy from the 1.24 boundary could be something to consider today since it is housed within the above said daily demand. Yet, the H4 mid-way support at 1.2350 is also interesting as it merges beautifully with the above noted daily Quasimodo support. In spite of this, a buy from both levels has been stamped risky by our team. Not only is there strong demand for the dollar right now, but the weekly trend on the GBP is clearly pointing south, despite its recent correction from 1.1904!
On account of the above points, and bearing in mind that 1.24 and 1.2350 may only give up a small bounce at best, our team will remain flat today.
Data points to consider: US housing figures at 1.30pm GMT.
Levels to watch/live orders:
- Buys: Flat (stop loss: N/A).
- Sells: Flat (stop loss: N/A).
AUD/USD:
The weekly support area seen at 0.7438-0.7315 appears to be struggling at the moment, with the possibility of a break below this region to the 2016 yearly opening level at 0.7282 likely. While the weekly area does indeed look weak, the daily candles, however, recently came into close contact with the top edge of a support area drawn from 0.7281-0.7334 that intersects nicely with a trendline support extended from the low 0.7145.
Stepping across to the H4 chart, the Aussie’s recent bout of selling (on the back of a stronger dollar) chewed through bids around the 0.74 handle as well as December’s opening level at 0.7387, and went on to slice through a nearby H4 demand at 0.7345-0.7365 during the US session.
Our suggestions: With bids likely weakened around the above said H4 demand area, there’s a chance that we may see the pair target lows of 0.7311 formed on the 21st Nov, followed closely by the 0.73 handle today. Perhaps the most compelling factor here is that 0.73 is positioned directly above the yearly opening level mentioned above at 0.7282, and is located within the current daily support area! We would, dependent on the time of day, consider buys from the 0.7282/0.73 region. Nevertheless, given that the area is rather small, we would prefer to trade this base with some form of lower-timeframe confirmation (see the top of this report) to avoid any fakeout that may take place.
Data points to consider: US housing figures at 1.30pm GMT.

Levels to watch/live orders:
- Buys: 0.7282/0.73 ([lower-timeframe confirmation required prior to pulling the trigger] stop loss: dependent on where one confirms the area).
- Sells: Flat (stop loss: N/A).
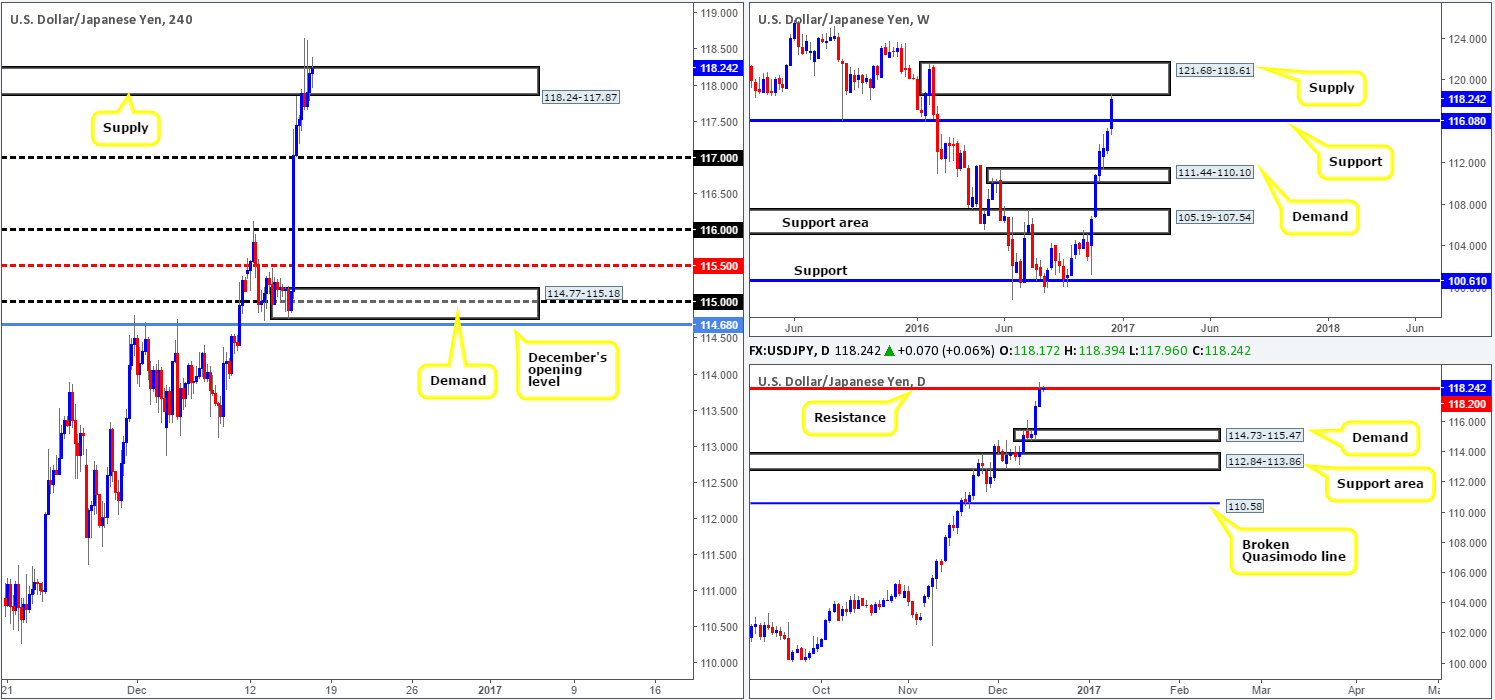
USD/JPY:
Across the board, we can see that the US dollar continued to strengthen yesterday. Fueled by the Fed hiking rates on Wednesday and expectations of further hikes in the near future, the USD/JPY pair rose to highs of 118.66 on the day. In that the H4 candles show supply at 118.24-117.87 was whipsawed on two occasions yesterday, should we be looking to buy this market? Well, fundamentally the dollar is in a very strong position. Technically, however, weekly price recently connected with the underside of supply coming in at 121.68-118.61, along with daily action also touching base with a resistance level given at 118.20. Furthermore, both the weekly and daily charts also show room to selloff, with the closest support being seen on the weekly chart at 116.08.
Our suggestions: Should a reasonably sized H4 bearish candle form around the current H4 supply zone, preferably an engulfing candle, we would look to short this pair, targeting the 117 handle as our initial take-profit zone. Without this confirming candle we would not be confident enough to tackle to dollar, given recent Fed projections.
Data points to consider today: US housing figures at 1.30pm GMT.
Levels to watch/live orders:
- Buys: Flat (stop loss: N/A).
- Sells: 118.24-117.87 ([reasonably sized H4 bearish engulfing candle required prior to pulling the trigger] stop loss: ideally beyond the trigger candle).
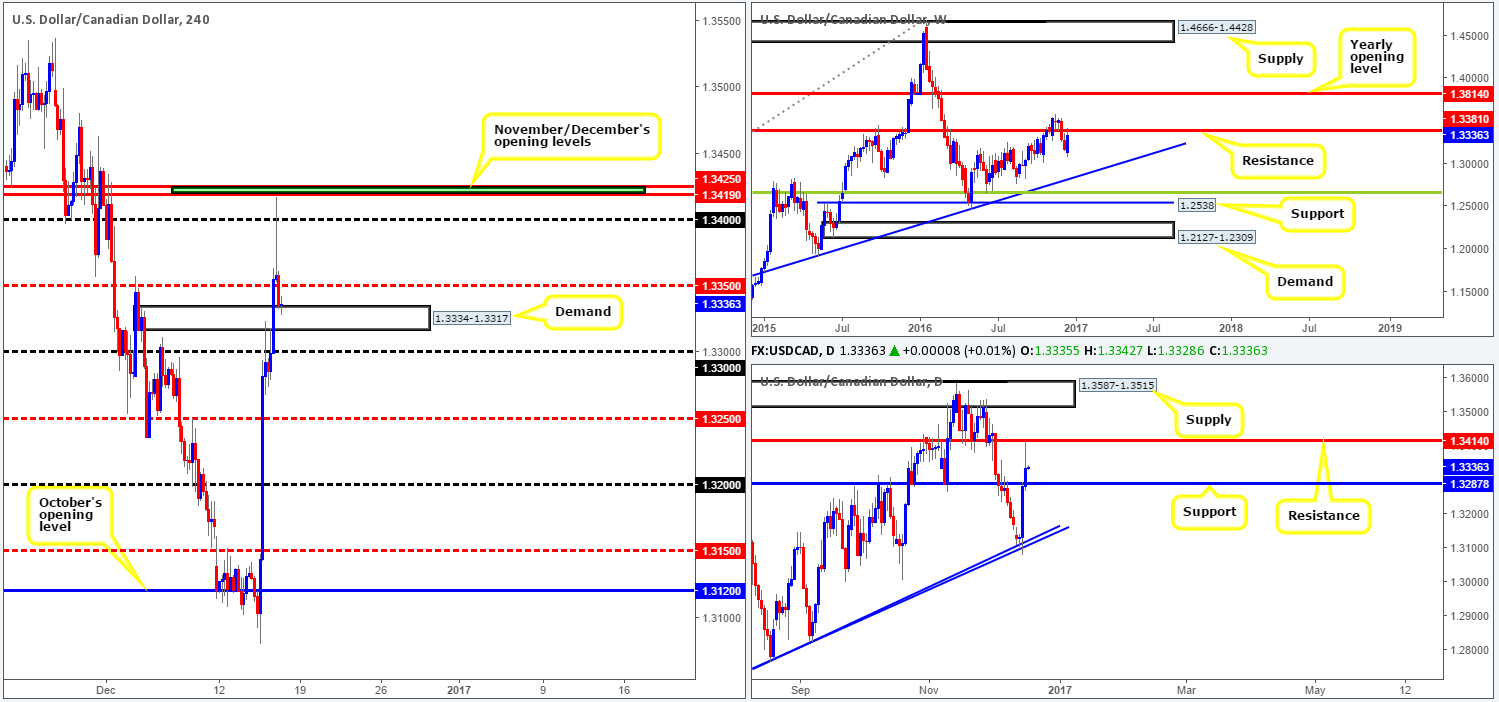
USD/CAD:
The buyers managed to find their feet early on in the day yesterday, aggressively breaking through the 1.33 handle, the H4 supply at 1.3334-1.3317 and also the H4 mid-way resistance at 1.3350.Guided further by the Fed hiking rates on Wednesday and expectations of future increases, the USD continued to press higher from here, consequently whipsawing through the 1.34 handle, and coming within a hair of November/December’s opening levels at 1.3425/1.3419.
As you can see, however, the buyers failed to sustain gains beyond 1.34 and aggressively dropped lower, ending the day touching gloves with the recently broken H4 supply at 1.3334-1.3317 as demand. From a technical standpoint, this selloff should have not come as too much of a surprise. Monthly opening levels have proven to be extremely stable barriers, but when bolstered with weekly resistance at 1.3381 along with daily resistance at 1.3414, a selloff was extremely high probability.
Our suggestions: Buying from the current H4 demand area is a risky play, in our opinion. You’ll effectively be entering long against both weekly and daily sellers! Selling on the other hand will not be possible, at least for our team, until a decisive close below the 1.33 mark has been seen. Even then, nevertheless, it will be tricky in that there’s a daily support level positioned at 1.3287. As a result, opting to stand on the sidelines here may very well be the best path to take today.
Data points to consider today: US housing figures at 1.30pm GMT.
Levels to watch/live orders:
- Buys: Flat (stop loss: N/A).
- Sells: Watch for a H4 close below 1.33 before considering shorts in this market.
USD/CHF:
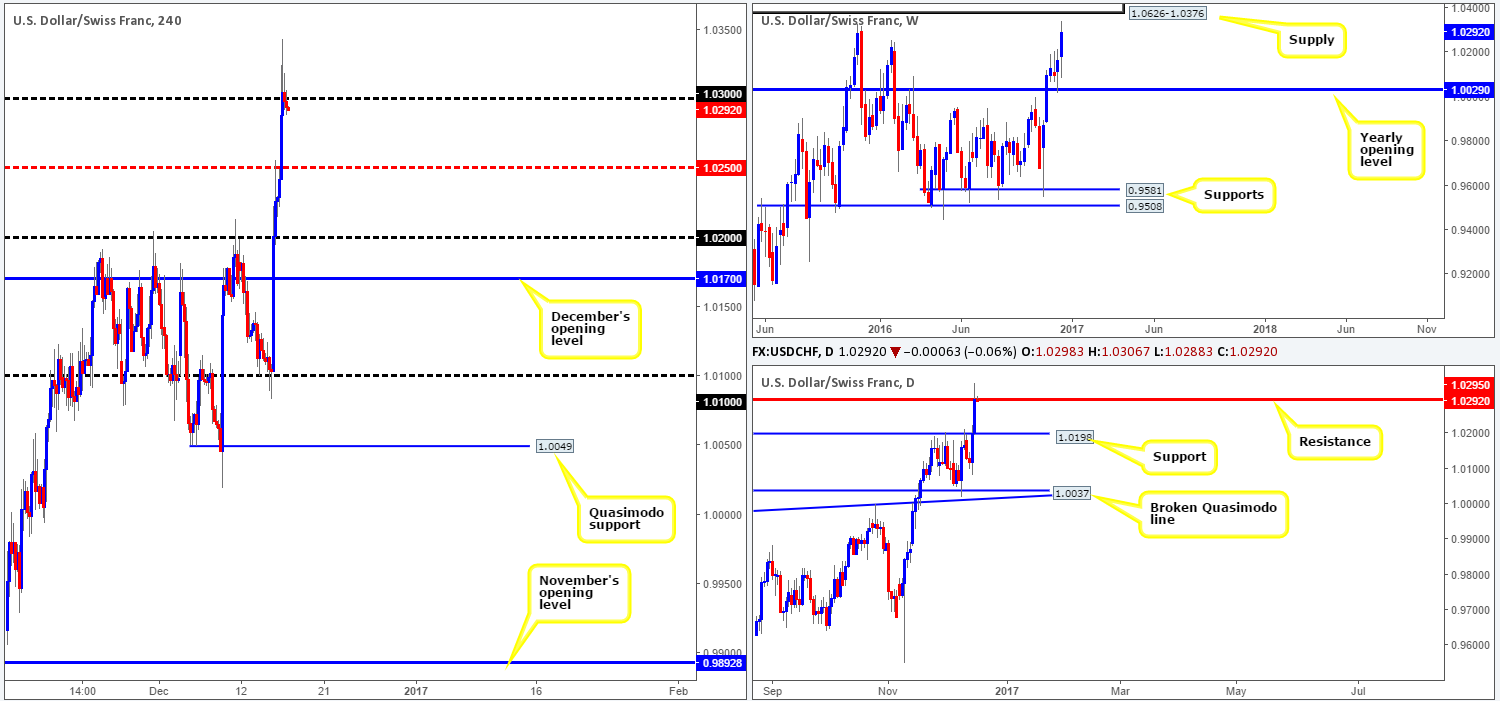
The bullish pulse continued to beat in the USD/CHF market yesterday. The bulls went on the offensive in the early hours of day, reinforced by the strong sentiment surrounding the US dollar following Wednesday’s FOMC decision to hike rates and noted expectation of future increases. As a result, the H4 mid-way resistance at 1.0250 was wiped out, carving out the path north for price to attack the 1.03 neighborhood.
Seeing as how 1.03 is connected with daily resistance at 1.0295, a rotation to the downside could be seen from this angle. With that being said, however, the current weekly candle looks set to extend north to a supply coming in at 1.0626-1.0376, an area formed back in 2010!
Our suggestions: In light of the H4 selling wicks seen printed around the 1.03 hurdle, this could, alongside the current daily resistance, portend a selloff from here! On the other hand, the US dollar is in a very strong position fundamentally at the moment, so further buying, as the weekly timeframe also suggests, may be on the horizon.
On account of the above points, should we manage to pin down a lower-timeframe sell setup today from 1.03 (see the top of this report for ideas on how to enter using lower-timeframe price action), we feel this would be sufficient enough to permit a short, targeting 1.0250, followed by 1.02 which happens to sit just above daily support at 1.0198.
Data points to consider today: US housing figures at 1.30pm GMT.
Levels to watch/live orders:
- Buys: Flat (stop loss: N/A).
- Sells: 1.03 region ([lower-timeframe confirmation required prior to pulling the trigger] stop loss: dependent on where one confirms the area).
DOW 30:
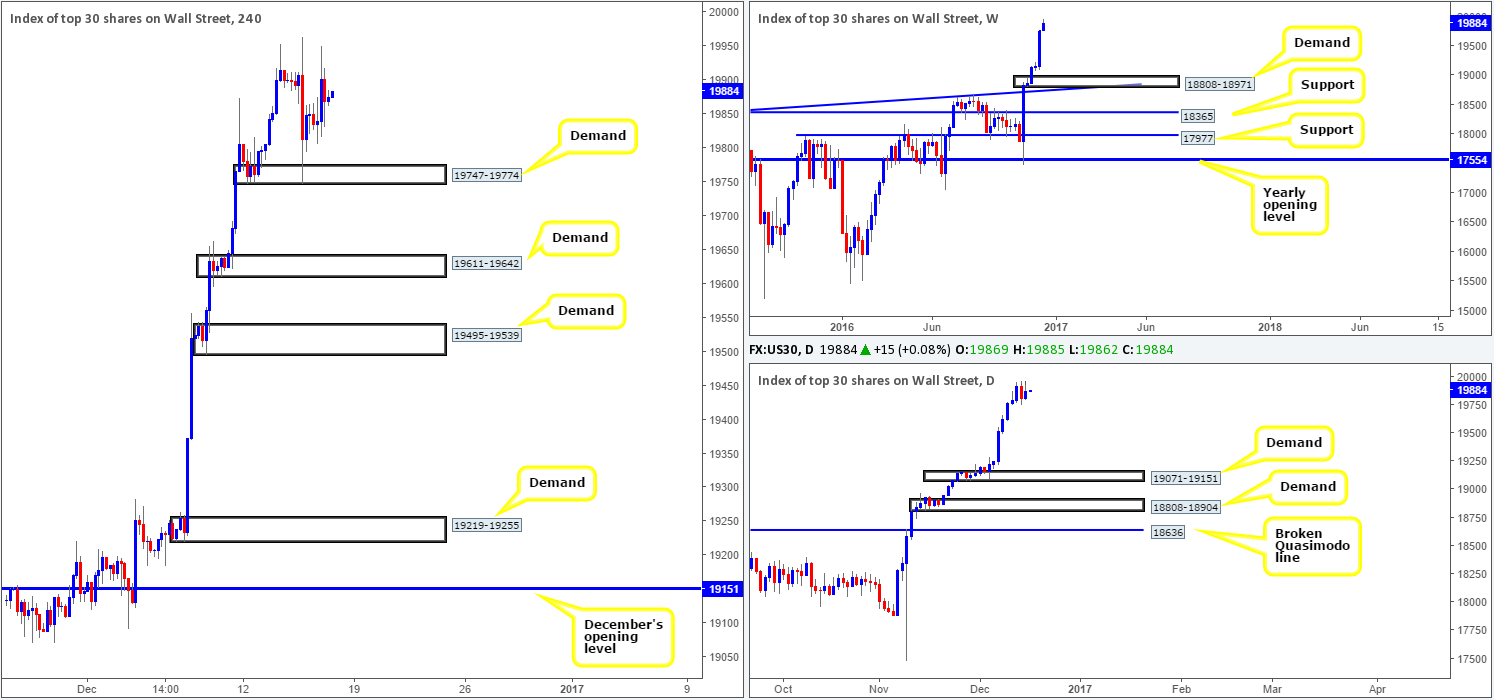
Recent H4 action shows that the DOW extended Wednesday’s rebound from demand at 19747-19774, touching highs of 19950 on the day. While investors were expecting a hike in the Fed fund’s rate on Wednesday, they were not, however, anticipating the hawkish response seen from Fed members concerning future interest-rate hikes. However, we personally feel that there is leeway in the market until interest rates seriously affect the stock market as a whole.
Our suggestions: Seeing as how the current H4 demand base at 19747-19774 has proven itself as somewhere investors would buy from, we will continue to keep an eyeball on this zone today for a second retest. Nevertheless, given the fact that price drove very deep into this zone, likely clearing out a truckload of bids in the process, waiting for the lower timeframes to confirm buying interest would, in our book, be the more logical route to take here, rather than jumping in with a market order. Confirming action is considered, by our desk at least, to be either a break above supply followed by a retest, a trendline break/retest or simply a collection of well-defined buying tails around the H4 demand. We search for lower-timeframe confirmation between the M15 and H1 timeframes, since most of our higher-timeframe areas begin with the H4. Stops are usually placed 3-5 pips beyond confirming structures.
Data points to consider today: US housing figures at 1.30pm GMT.
Levels to watch/live orders:
- Buys: 19747-19774 ([lower-timeframe confirmation required prior to pulling the trigger] stop loss: dependent on where one confirms the area).
- Sells: Flat (stop loss: N/A).
GOLD:
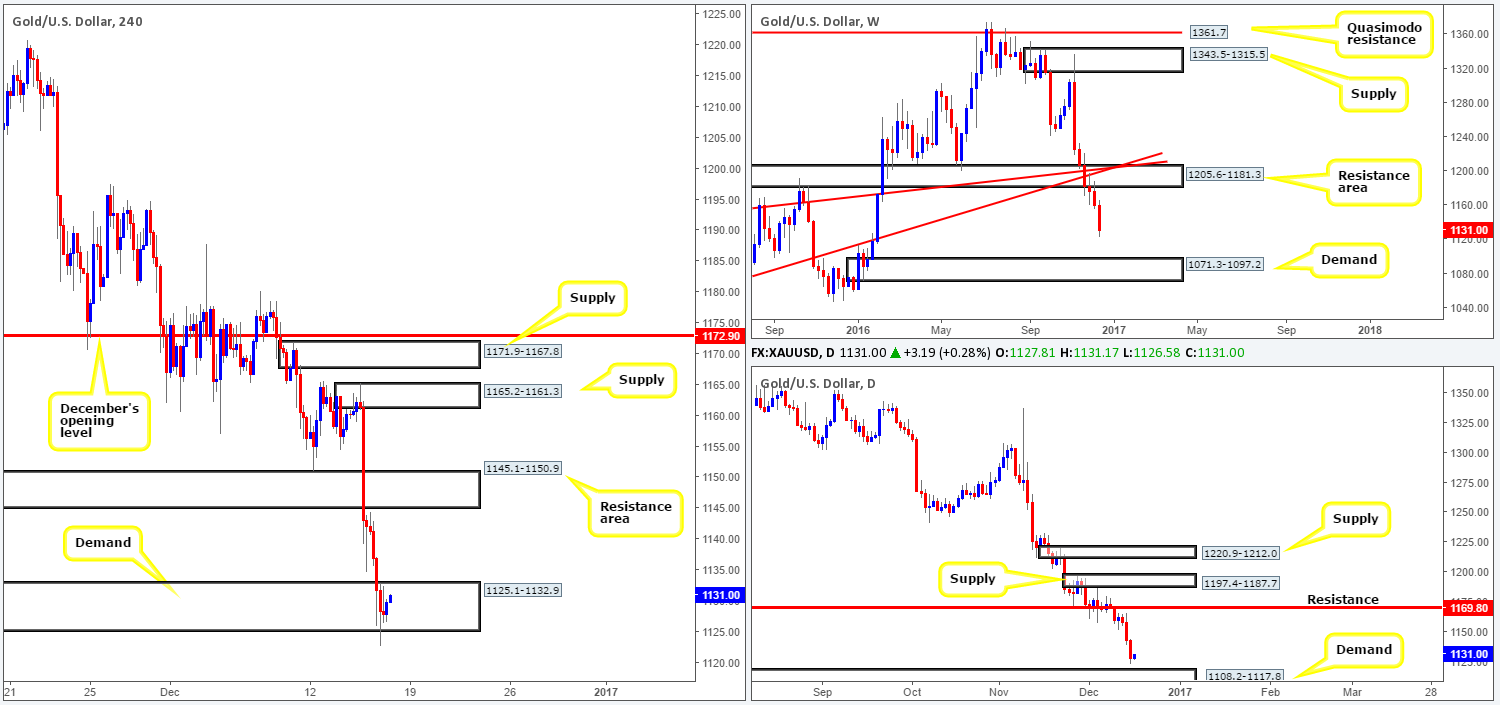
Further selling was seen in the gold market during the course of yesterday’s sessions, on the back of continued dollar strength. In consequence to this, the daily candles are now seen trading within shouting distance of demand coming in at 1108.2-1117.8. Despite this, up on the weekly chart, the unit shows room to continue past the above said daily demand to a weekly demand area drawn from 1071.3-1097.2.
Turning our attention to the H4 chart, yesterday’s action saw the yellow metal whipsaw through demand at 1125.1-1132.9. Bids around this area have very likely been severely weakened by this latest move, thus further downside to H4 support at 1110.0 may be seen. Although 1110.0 is positioned within the aforementioned daily demand area, the selloff currently being seen in this market, which is on course to close in the red for the sixth consecutive week, may be too strong to consider buying from here.
Our suggestions: Our desk has reported no interest in buying from the current H4 demand, due to buyers likely weakened around this area, and the fact that both weekly and daily price look set to extend lower (see above). Buying from the H4 support at 1110.0, as mentioned above is also somewhat tricky.
Right now, according to the higher-timeframe picture, selling is the better option. However, with the current H4 demand still in play and the top edge of the daily demand area seen nearby at 1117.8, we would be just as cautious selling at the moment.
Levels to watch/live orders:
- Buys: Flat (stop loss: N/A).
- Sells: Flat (stop loss: N/A).