EUR/USD:
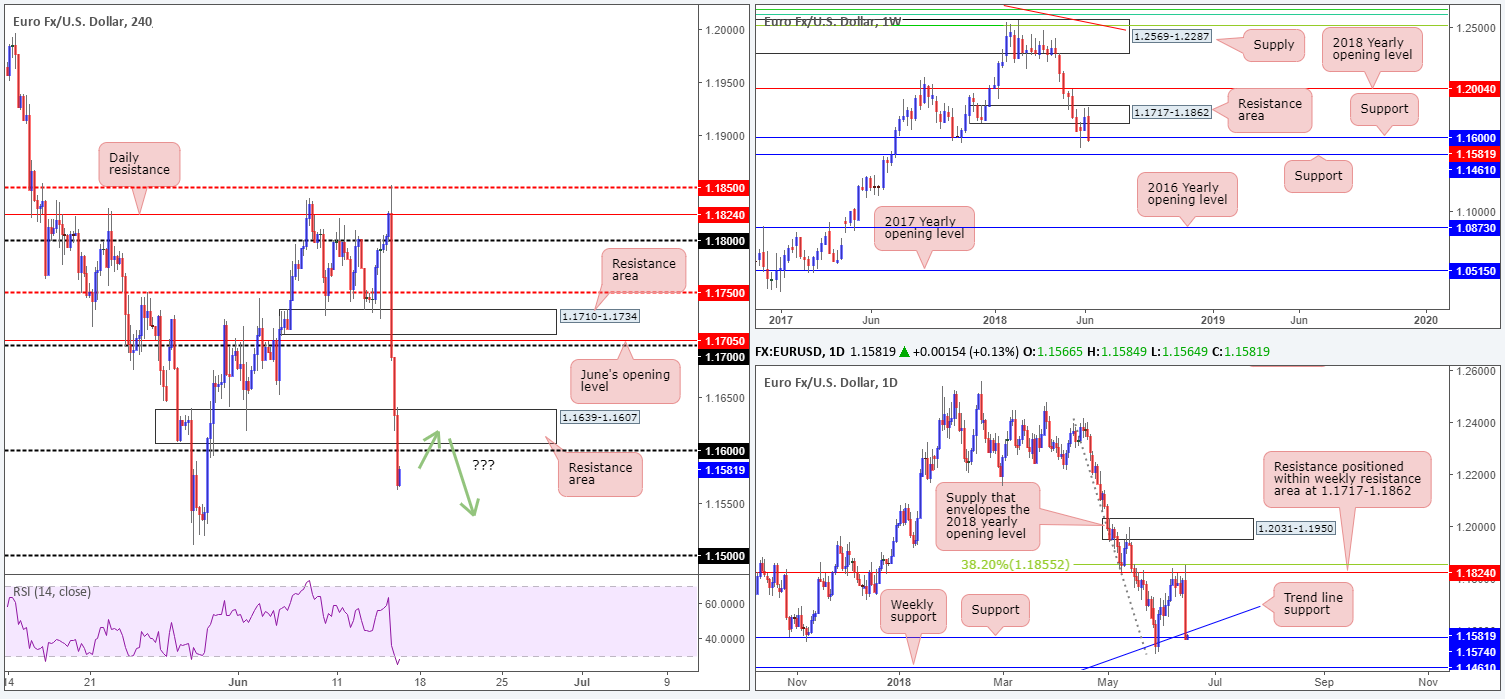
The EUR/USD, as you can see, lost considerable ground against its US counterpart on Thursday, down 1.77%. The ECB announced QE changes and also suggested that interest rates will not be lifted until the summer of 2019 at the earliest. Euro longs subsequently bailed, with the single currency seen concluding the day dipping its toe beneath the 1.16 figure, which happens to also be a weekly support level.
Try as it might, though, the pair was unable to breach daily support priced in at 1.1574 and its fellow daily trend line support taken from the low 1.0340.
Areas of consideration:
In light of price action recently shaking hands with daily structure, and the likelihood that sellers will begin covering shorts today, there’s a good chance that the H4 candles will retest 1.16 and nearby H4 resistance area planted just above it at 1.1639-1.1607. These areas may offer potential shorting opportunities (remember 1.16 also denotes a recently breached weekly support and could now provide us with resistance). We must stress, however, that we would only consider this a viable sell zone if H4 price should chalk up a full or near-full-bodied bearish candle (stop-loss orders are best positioned above the rejection candle’s wick).
Today’s data points: Euro final CPI y/y; US empire state manufacturing index; US industrial production m/m and capacity utilization rate; US prelim UoM consumer sentiment.
GBP/USD:
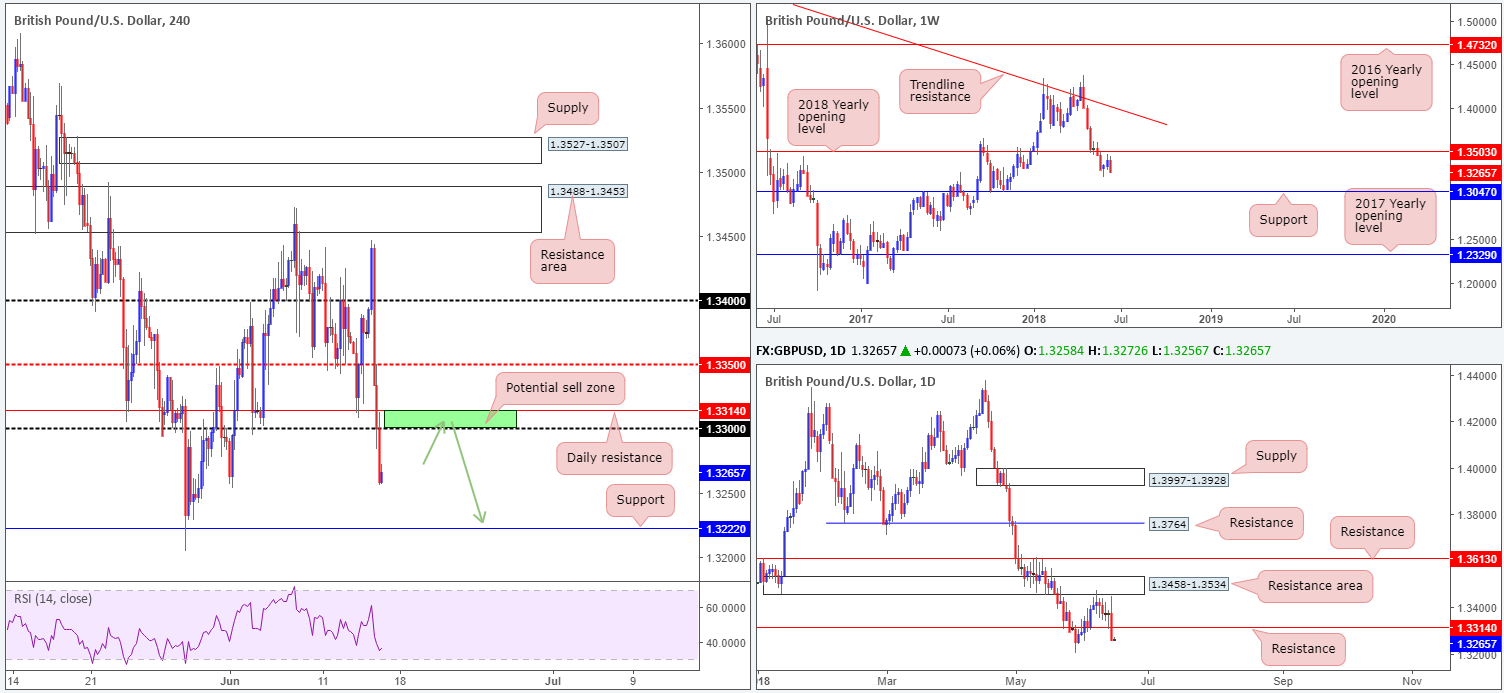
The day started off on a strong footing for the British pound on Thursday, climbing above the 1.34 handle and clocking fresh session highs of 1.3446 on the back of an upbeat UK retail sales print. Things swiftly turned sour, however, after the ECB failed to satisfy the markets with its tapering announcement and Draghi doing his best to avoid delivering clear remarks regarding the timing of a rate hike. The day ended with H4 price exploring levels beyond the 1.33 handle, as a result of this. The next support target visible on this scale can be seen around the 1.3222 neighborhood.
Recent selling, as you can see, brought daily price through support at 1.3314 (now acting resistance). In the event that sellers remain defensive, the next support can be found at 1.3063 (not seen on the screen). In similar fashion, weekly movement also displays room to stretch as far south as the weekly support level coming in at 1.3074.
Areas of consideration:
On account of all three timeframes airing bearish vibes this morning, the small area marked in green on the H4 timeframe at 1.3314/1.33 (daily resistance and round number) appears an ideal location to consider a short from, targeting H4 support mentioned above at 1.3222 as the initial take-profit zone.
Today’s data points: US empire state manufacturing index; US industrial production m/m and capacity utilization rate; US prelim UoM consumer sentiment.
AUD/USD:
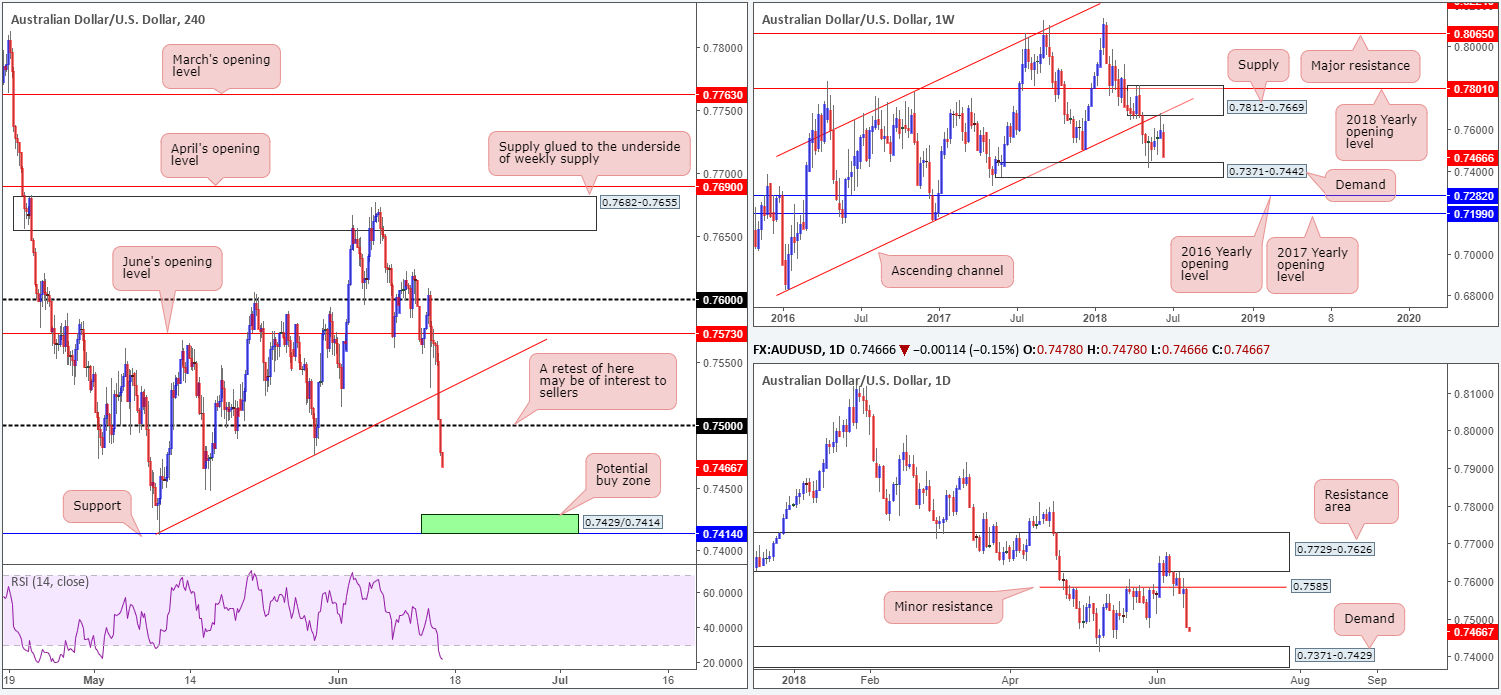
During the course of Thursday’s sessions, the Australian dollar struggled to recover from disappointing employment figures announced in early trade, despite Moody’s reaffirming the sovereign’s AAA rating. This was likely due to the commodity currency following its G-10 counterparts and a stronger USD across the board.
From a technical perspective, we can see the H4 candles took out a trend line support (extended from the low 0.7412) and also the 0.75 handle, as a result of recent selling. Beyond this point, there’s not really a whole lot of H4 support stopping the unit from reaching support priced in at 0.7414.
Thanks to recent movement, nevertheless, weekly price is seen trading within striking distance of weekly demand at 0.7371-0.7442, which happens to house a daily demand within its walls at 0.7371-0.7429. In which case, H4 price could find support earlier than expected around the 0.7440ish region (the top edge of the aforementioned weekly demand).
Areas of consideration:
Unless H4 price retests the underside of 0.75 and prints a healthy H4 bearish candle, selling this market is chancy. As highlighted above, you will, if you sell at current price, be shorting directly into potential weekly buying!
As for possible buying opportunities, the team has noted to keep eyes on the green H4 area marked at 0.7429/0.7414. This zone denotes the top edge of the aforesaid daily demand (which as we already know is sited within the current weekly demand) and H4 support mentioned above at 0.7414.
Today’s data points: RBA Assist Gov. Ellis speaks; US empire state manufacturing index; US industrial production m/m and capacity utilization rate; US prelim UoM consumer sentiment.
USD/JPY:
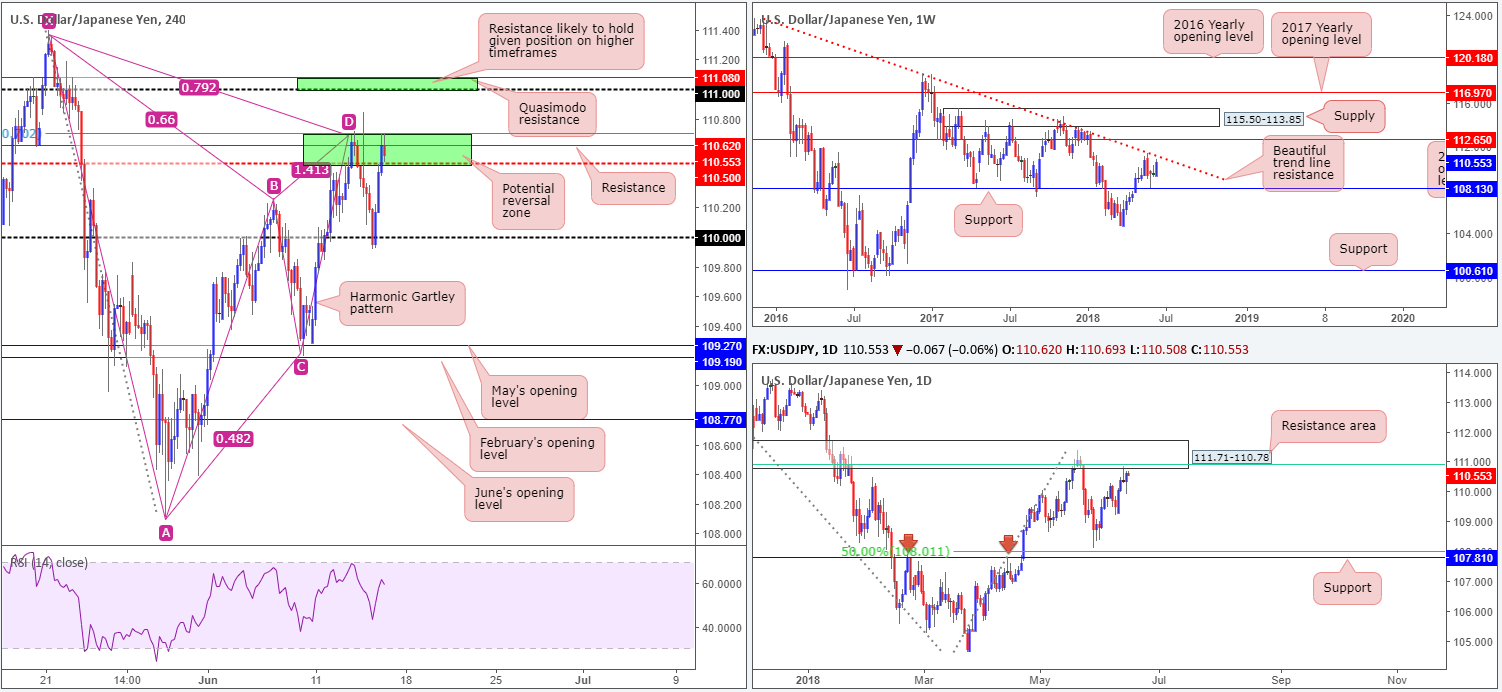
In recent sessions, the USD/JPY pared Wednesday’s losses after reacting beautifully off the 110 handle on the H4 timeframe. The recovery was a mixture of upbeat US retails sales data and a dovish ECB.
As shown on the H4 chart, recent movement has pulled price action back up to a potential reversal zone marked in green (lower area) at 110.72/110.50 (comprised of a H4 harmonic Gartley completion point: 78.6%, a H4 resistance level at 110.62 and a H4 mid-level resistance at 110.50).
Also supporting downside in this market is a daily resistance area planted at 111.71-110.78. Not only does this area fuse with a 61.8% daily Fib resistance value at 110.91 (green line), it also converges nicely with a weekly trend line resistance taken from the high 123.67.
Areas of consideration:
There are currently two areas of interest in this market for potential shorts:
- The first is the current area highlighted above at 110.72/110.50. The initial take-profit target from this region can be found around the 110 handle.
- The second zone, a little higher up and also marked in green, can be found at 111.08/111. Like the lower zone, this area also has strong connections to both weekly and daily structure mentioned above. From this point, we’d be looking at the 110.50ish region as a first take-profit area.
Today’s data points: US empire state manufacturing index; US industrial production m/m and capacity utilization rate; US prelim UoM consumer sentiment; BoJ monetary policy statement and press conference.
USD/CAD:
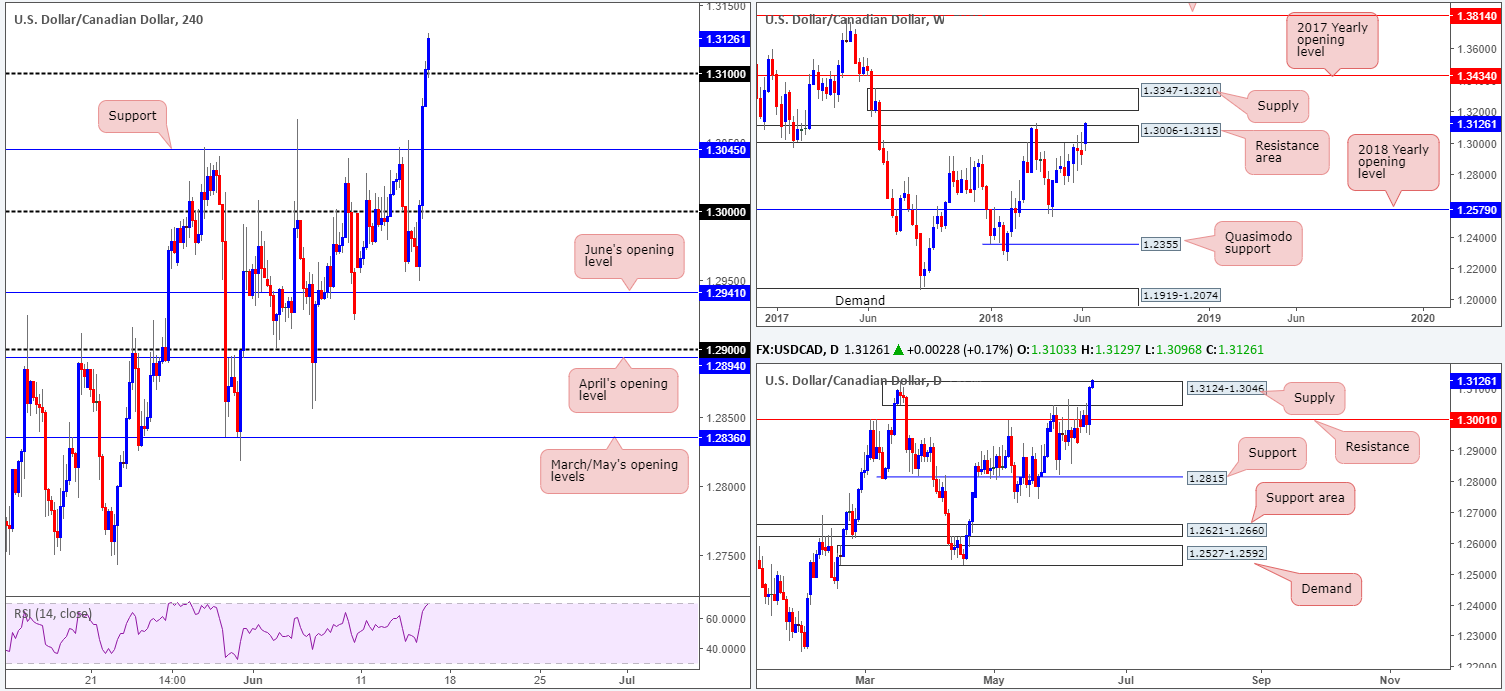
Influenced by a dovish ECB report, the USD spun off into a buying frenzy against its Canadian counterpart amid early US trade on Thursday. H4 price obliterated multiple levels of resistance and concluded the day closing marginally above the 1.31 handle. In terms of H4 structure, H4 resistance plotted at 1.3165 will likely be the next upside hurdle.
Higher-timeframe action, on the other hand, places the market around the top edge of a daily supply zone at 1.3124-1.3046, and also marginally above a weekly resistance area coming in at 1.3006-1.3115. Continued buying from this point has the daily resistance at 1.3207 to target (not seen on the screen), which happens to be planted directly beneath weekly supply drawn from 1.3347-1.3210.
Areas of consideration:
All three timeframes point to a possible continuation to the upside.
With that being the case, traders may want to consider entering long should H4 price retest the 1.31 handle as support, targeting the H4 resistance level mentioned above at 1.3165, followed then by daily resistance at 1.3207. We would advise waiting for H4 price to print a full or near-full-bodied bull candle off 1.30 before pulling the trigger, however, as psychological numbers are prone to fakeouts!
Today’s data points: US empire state manufacturing index; US industrial production m/m and capacity utilization rate; US prelim UoM consumer sentiment; CAD foreign securities purchases; CAD manufacturing sales m/m.
USD/CHF:
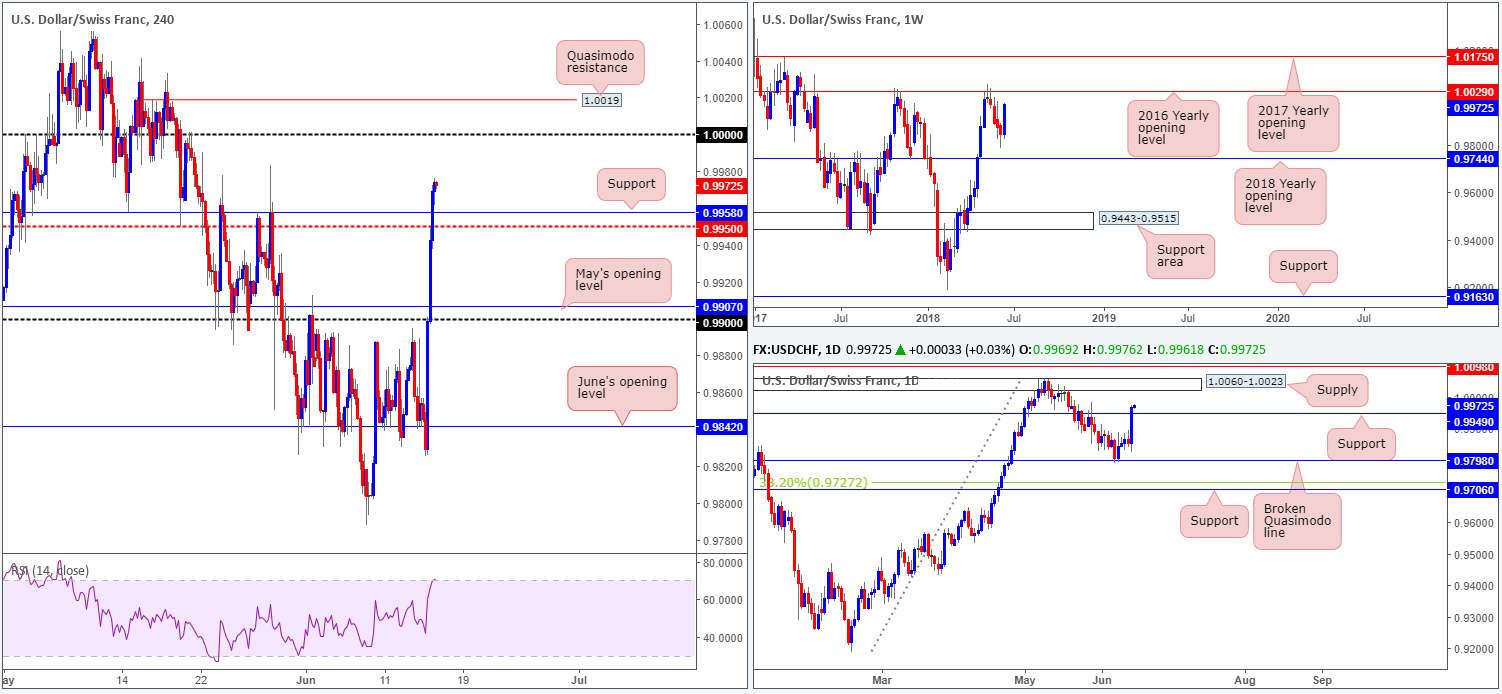
The USD/CHF, as is clearly evident from the charts, advanced aggressively during US trade on Thursday. The markets responded to yesterday’s ECB movement, placing the shared currency under heavy selling pressure, therefore allowing the greenback to find demand and gather strength against its peers.
From the weekly timeframe, we can see that price action is now trading within striking distance of the 2016 yearly opening level at 1.0029: a barrier which managed to hold price lower in early May of this year and late October in 2017. Moving down to the daily timeframe, resistance at 0.9949 (now acting support) was engulfed yesterday, potentially opening up the path north to daily supply drawn from 1.0060-1.0023. Recent activity over on the H4 chart, however, reveals parity (1.0000) is now in view, followed closely by a H4 Quasimodo resistance level visible at 1.0019. This became evident following a break above the H4 mid-level resistance 0.9950.
Areas of consideration:
Although the bulls certainly had the upper hand on Thursday, this may come to an end in the not so distant future as price action is seen approaching some rather significant resistance on all three timeframes we follow:
- The 2016 yearly opening level at 1.0029 on the weekly timeframe.
- The daily supply at 1.0060-1.0023.
- The key figure 1.0000 seen on the H4 timeframe, along with nearby H4 Quasimodo resistance level at 1.0019.
In light of this, selling from the aforementioned H4 Quasimodo resistance level may be of interest to some traders. We would advise placing stops above the daily supply at around the 1.0062ish mark. Yes, this may seem like a large stop-loss distance, but when one takes into consideration that we are effectively trading from higher-timeframe areas, the move lower from here could be extremely large (and profitable).
Today’s data points: US empire state manufacturing index; US industrial production m/m and capacity utilization rate; US prelim UoM consumer sentiment.
Dow Jones Industrial Average:
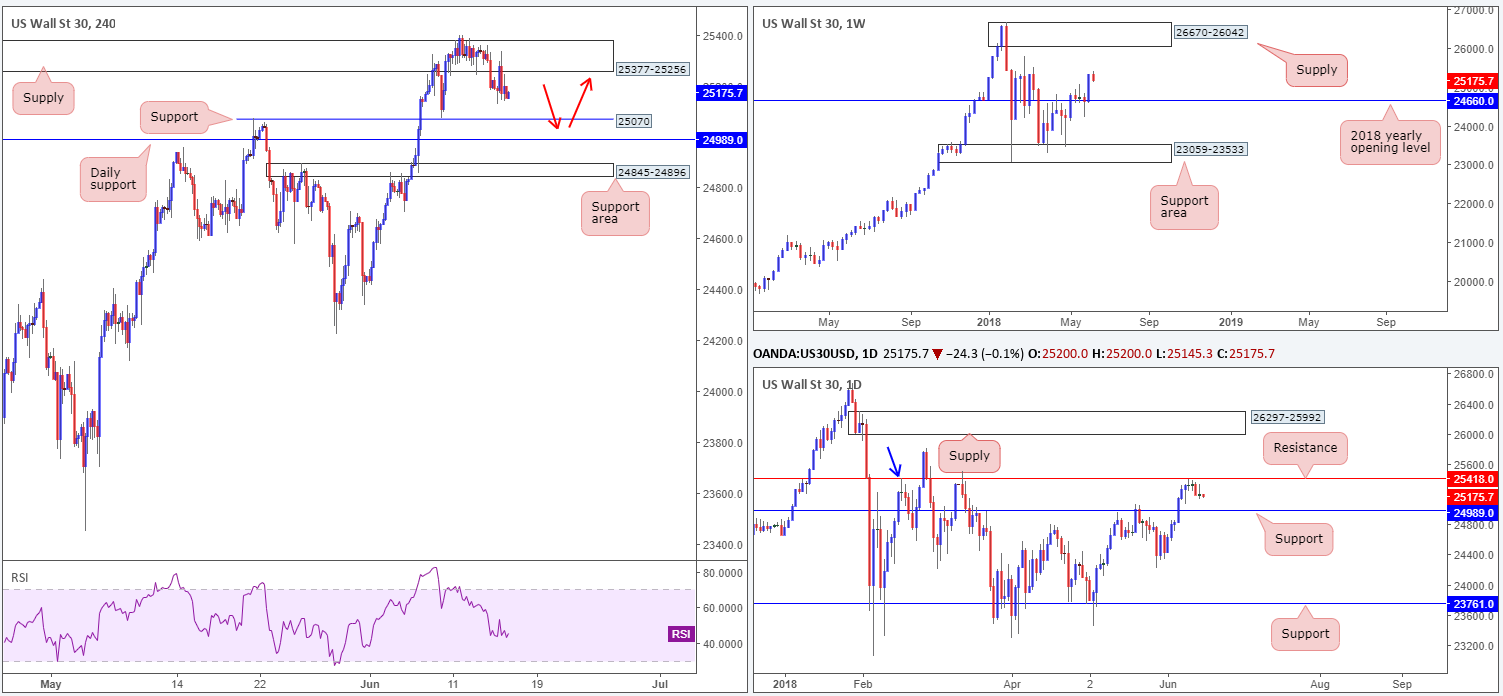
US equities are pretty much unchanged this morning, despite retesting nearby H4 supply at 25377-25256. Given this somewhat lackluster performance, much of the following report will echo thoughts put forward in yesterday’s analysis…
Neighboring support on the H4 timeframe can be seen at 25070, which already proved its worth back on June 8. What’s also notable from a technical perspective is that directly beneath the aforementioned H4 support level, there’s a daily support level seen at 24989, shadowed closely by a H4 support area priced in at 24845-24896. Contrary to H4 and daily action showing room to probe lower, weekly movement demonstrates little resistance ahead until we reach weekly supply drawn from 26670-26042, following a solid round of buying seen last week off of the 2018 yearly opening level at 24660.
Areas of consideration:
In light of recent trade, we feel H4 support mentioned above at 25070 may be brought into play today, with the possibility of a fakeout being seen through this level to the aforementioned daily support level. To our way of seeing things, this is a reasonably solid buying opportunity with upside targets positioned at the noted H4 supply, followed by daily resistance plotted at 25418.
Today’s data points: US empire state manufacturing index; US industrial production m/m and capacity utilization rate; US prelim UoM consumer sentiment.
XAU/USD (Gold)
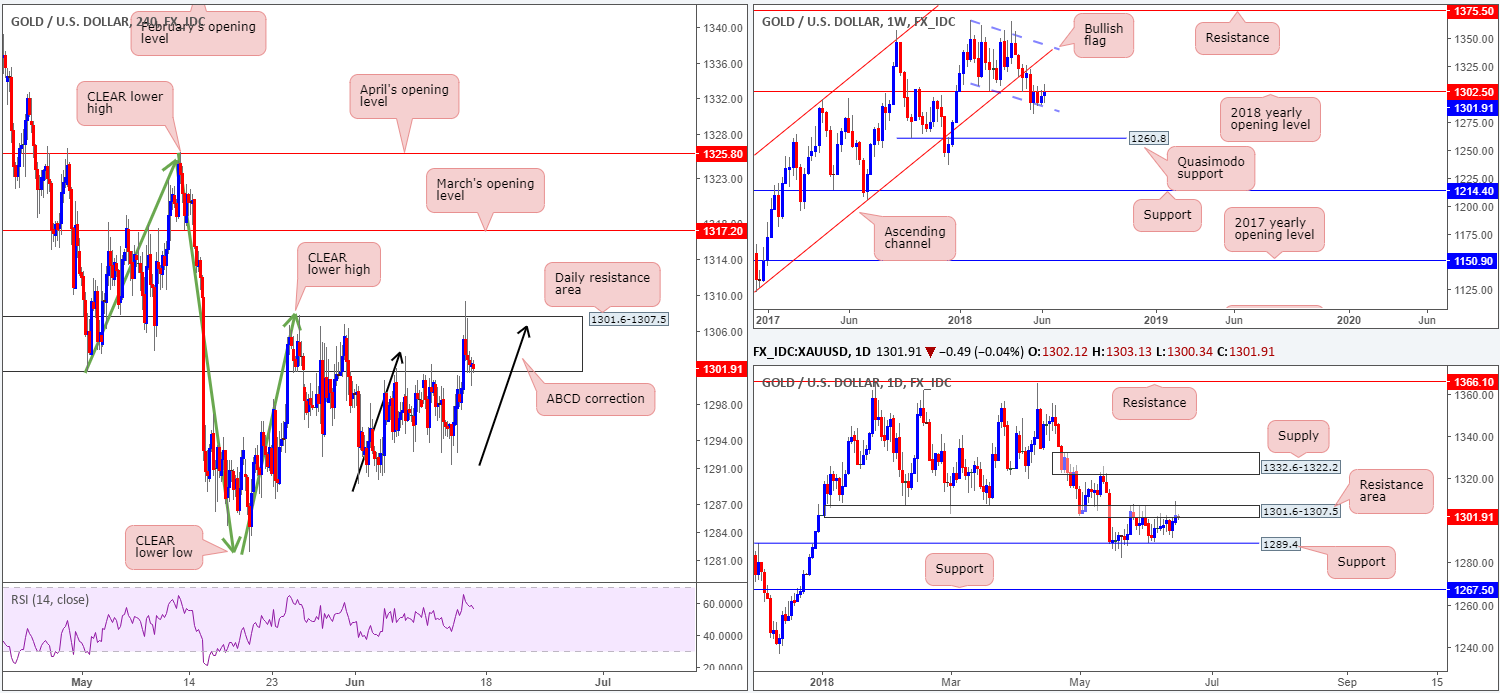
In the shape of a H4 ABCD correction (black arrows), the yellow metal advanced to highs of 1309.3 on Thursday, before mildly paring recent gains possibly due to a sharp rise in the dollar index, following the ECB's dovish taper announcement. Also, a better-than-expected US retail sales may have played a role in pushing prices lower.
Overall, H4 price has clearly broken the swing high seen at 1307.7, and at the same time, pierced through the top edge of a daily resistance area at 1301.6-1307.5. Despite this somewhat bullish vibe, the USD remains healthy (which could damper gold buying) and weekly price is seen capped by the 2018 yearly opening level at 1302.5.
Areas of consideration:
Having seen H4 price fail to close above the current daily resistance area, and put in a reasonably nice-looking ABCD correction to the upside, we see limited evidence supporting a long in this market. This is further bolstered by the fact that we also have the 2018 yearly opening level mentioned above at 1302.5 in play.
Going on the current technical picture, sellers may come into the market. Should a H4 full or near-full-bodied bearish candle present itself at current price we feel this would be a strong indication of lower prices, targeting daily support priced in at 1289.4.
The use of the site is agreement that the site is for informational and educational purposes only and does not constitute advice in any form in the furtherance of any trade or trading decisions.
The accuracy, completeness and timeliness of the information contained on this site cannot be guaranteed. IC Markets does not warranty, guarantee or make any representations, or assume any liability with regard to financial results based on the use of the information in the site.
News, views, opinions, recommendations and other information obtained from sources outside of www.icmarkets.com.au, used in this site are believed to be reliable, but we cannot guarantee their accuracy or completeness. All such information is subject to change at any time without notice. IC Markets assumes no responsibility for the content of any linked site. The fact that such links may exist does not indicate approval or endorsement of any material contained on any linked site.
IC Markets is not liable for any harm caused by the transmission, through accessing the services or information on this site, of a computer virus, or other computer code or programming device that might be used to access, delete, damage, disable, disrupt or otherwise impede in any manner, the operation of the site or of any user’s software, hardware, data or property.


