EUR/USD:
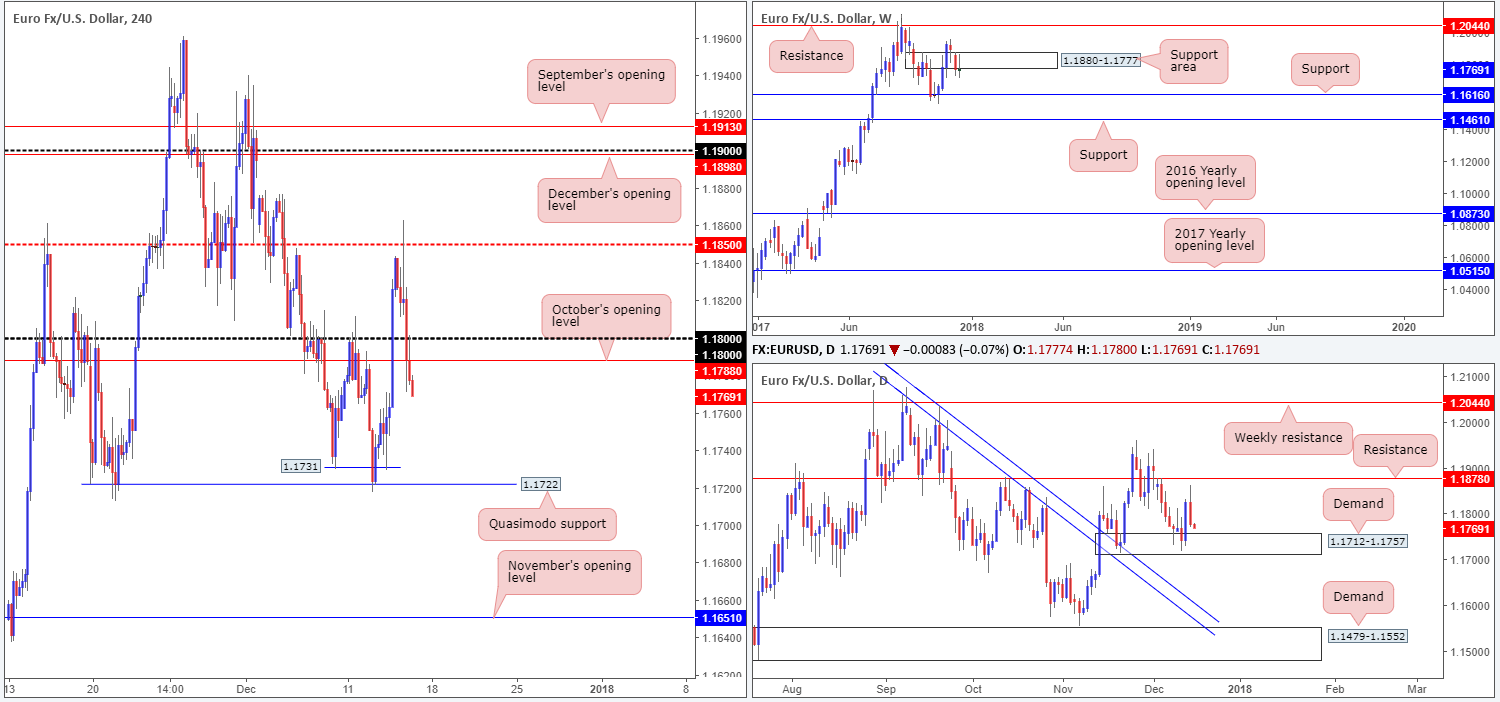
The shared currency experienced a rather aggressive selloff on Thursday after failing to muster enough strength to breach the H4 mid-level resistance at 1.1850. Upbeat US retail sales and weekly unemployment claims fuelled the decline, which eventually gnawed through both the 1.18 handle and October’s opening level on the H4 timeframe at 1.1788. At this stage, further downside is a possibility, with traders’ crosshairs likely fixed on the H4 Quasimodo support level at 1.1722.
Looking over at the bigger picture, nonetheless, we can see that weekly price is, once again, drifting around the lower edge of a weekly support area at 1.1880-1.1777. Ultimately, this could prompt a move down to a weekly support seen below at 1.1616. Daily action on the other hand, shows that daily demand at 1.1712-1.1757 is currently within striking distance, after coming within a few pips of connecting with daily resistance pegged at 1.1878.
Market direction:
With the aforesaid daily demand back in the spotlight, and weekly price somewhat undecided around the lower edge of the noted weekly support zone, this is a challenging market to trade, in our view. Sure, you could sell H4 price and ‘hope’ the unit reaches 1.1722, whilst ‘praying’ that price does not react to the top edge of the daily demand base, but this is not what trading should be about! Only take the best setups that offer high-probability moves.
This market, as far as we can see, presents little confluence to execute a trade.
Data points to consider: US empire state manufacturing index at 1.30pm; US industrial production m/m and capacity utilization rate at 2.15pm GMT.
Areas worthy of attention:
Supports: 1.1722; 1.1880-1.1777; 1.1712-1.1757.
Resistances: 1.1850; 1.1878; 1.18 handle; 1.1788.
GBP/USD:
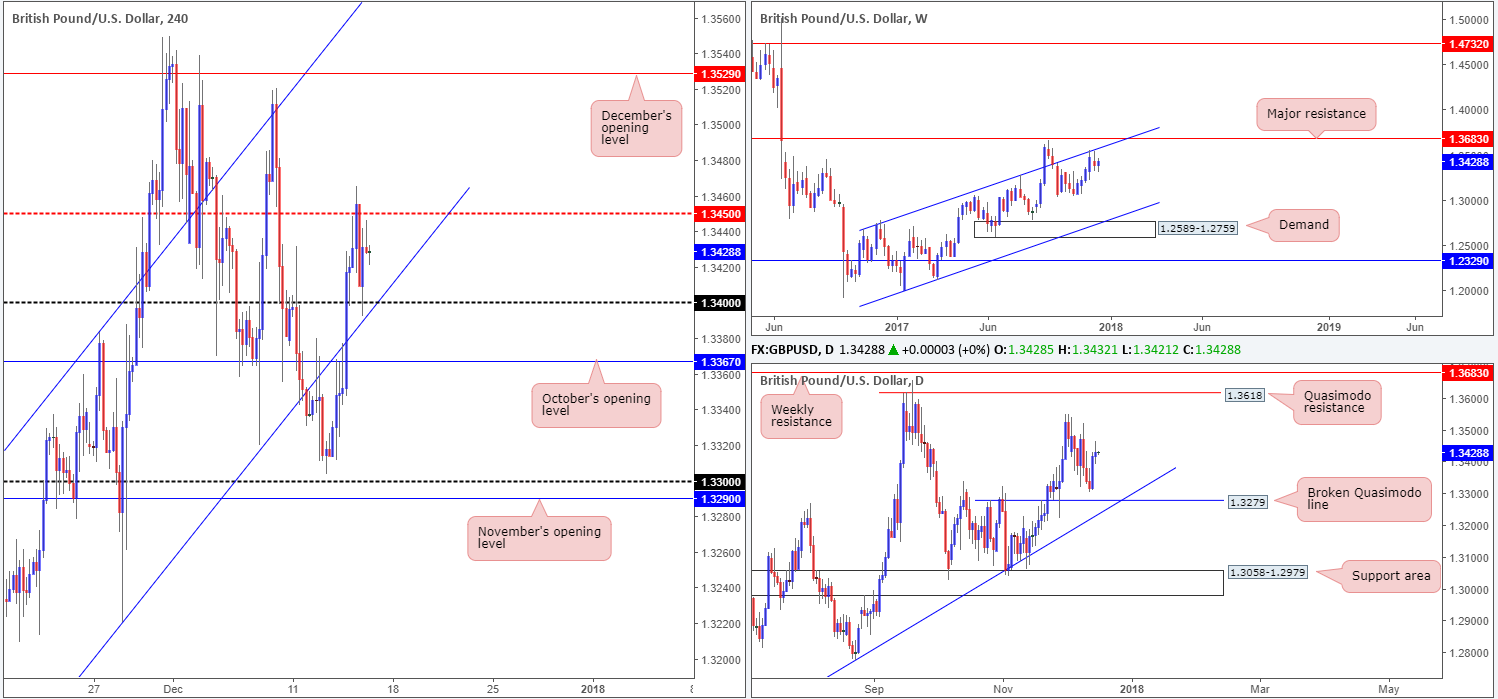
In recent trading, the GBP/USD sported a somewhat subdued tone. The Bank of England kept interest rates and asset purchase facility unchanged, (seen clearer on the M30 timeframe) prompting an intraday selloff to lows of 1.3409. However, the pair quickly recovered the knee-jerk slide after the British pound struck the 1.34 handle.
Moving over to the bigger picture, weekly price remains hovering beneath the weekly channel resistance etched from the high 1.2673. Daily movement on the other hand, lacks notable support or resistance according to our technicals. The nearest barriers we have noted down are the daily Quasimodo resistance at 1.3618 and the broken daily Quasimodo line coming in at 1.3279 (fuses with a daily trendline support taken from the low 1.2108).
Market direction:
A long above 1.3450 could be an option today, as the next upside target does not come into view until we reach December’s opening level seen on the H4 timeframe at 1.3529. However, it might be an idea to wait for H4 price to retest 1.3450 before buying since fakeouts tend to occur around psychological numbers.
Data points to consider: MPC member Haldane speaks at 1.15pm; US empire state manufacturing index at 1.30pm; US industrial production m/m and capacity utilization rate at 2.15pm GMT.
Areas worthy of attention:
Supports: 1.34 handle; 1.3271; daily trendline support taken from the low 1.2108.
Resistances: 1.3450; 1.3529; weekly channel resistance taken from the high 1.2673.
AUD/USD:
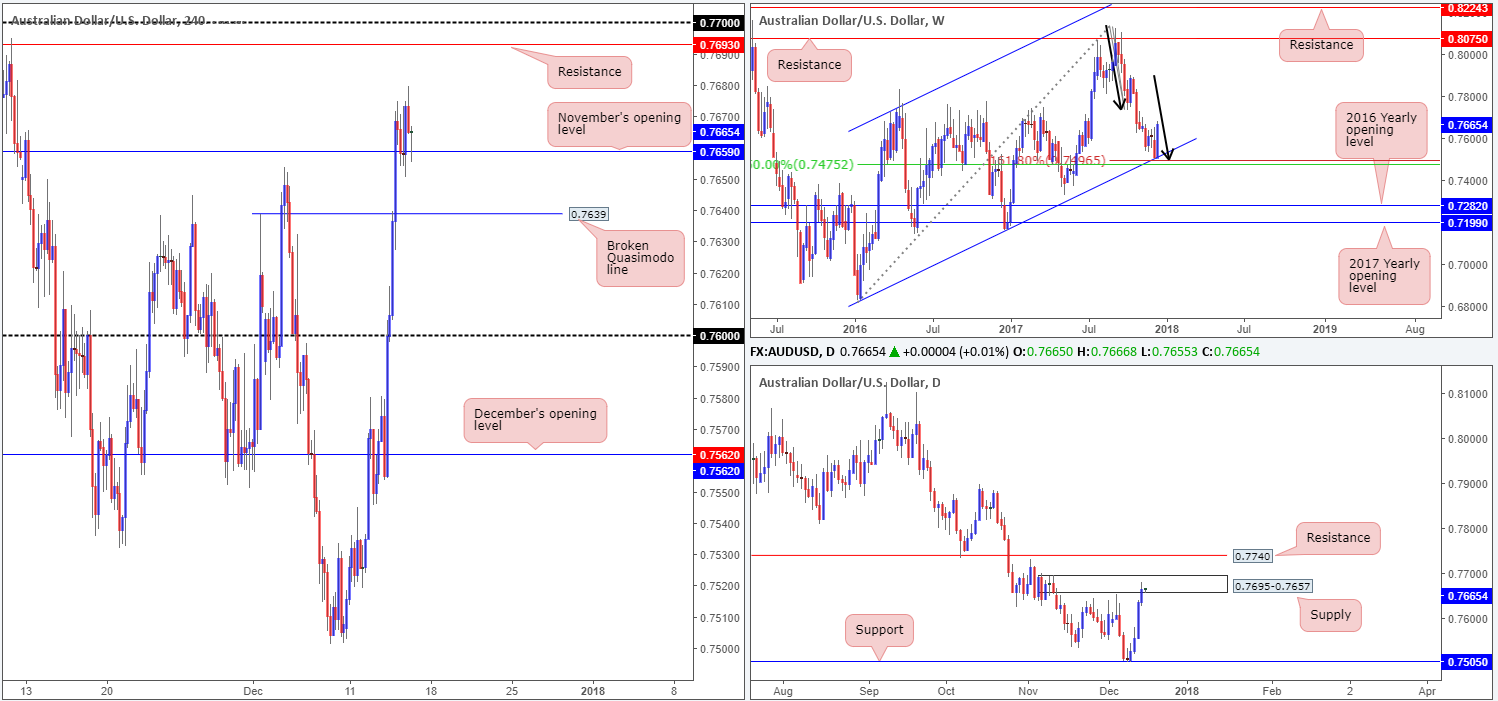
In the early hours of yesterday’s segment, Aussie economic data showed a strong increase (61.6K) in the labor market in November, following October’s bleak 7.8K. This prompted strong buying in the AUD/USD market, consequently ripping through both the H4 Quasimodo resistance level at 0.7639 (now acting support) and also November’s opening level at 0.7659. The pair, as you can see, managed to retain recent gains as price retested the monthly opening level and has held firm as support.
Should H4 bulls remain on the offensive today, the next port of call is likely to be H4 resistance plotted at 0.7693, shadowed closely by the 0.77 handle. In conjunction with the H4 timeframe, weekly action shows little resistance on the horizon after chalking up a solid response from the weekly channel support extended from the low 0.6827(merges closely with a weekly 50.0% value at 0.7475 taken from the high 0.8125, and a nice-looking weekly AB=CD [see black arrows] 161.8% Fib ext. point situated at 0.7496). Hindering potential upside from the H4 level, however, is the current daily supply base fixed at 0.7695-0.7657.
Market direction:
Given November’s opening level has the backing of weekly buyers, and daily price has yet to print anything noteworthy from the aforementioned daily supply, further buying is likely on the cards. In fact, H4 price is in the process of penciling in a H4 buying tail – this could be an ideal opportunity to enter the market on the close.
Data points to consider: US empire state manufacturing index at 1.30pm; US industrial production m/m and capacity utilization rate at 2.15pm GMT.
Areas worthy of attention:
Supports: weekly channel support extended from the low 0.6827; weekly AB=CD 161.8% Fib ext. point situated at 0.7496; 0.7639; 0.7659.
Resistances: 0.7693; 0.77 handle; 0.7695-0.7657.
USD/JPY:
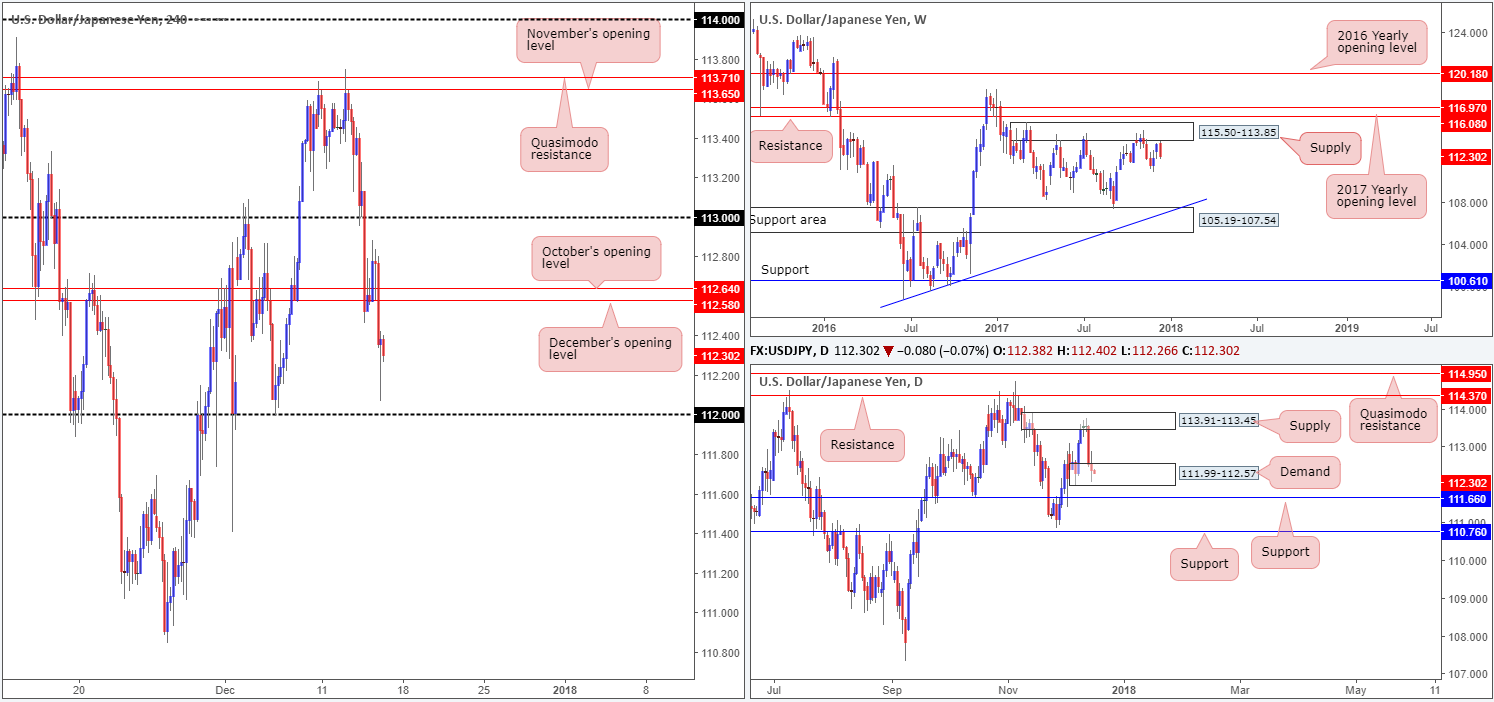
The USD/JPY sustained further losses on Thursday, despite an earnest attempt to push higher from December/October’s opening levels seen on the H4 timeframe at 112.58/112.64 (bolstered by upbeat US retail sales and weekly unemployment claims). Alongside the US equity market, the USD/JPY tumbled lower as we entered the US session, reaching a low of 112.06, missing the 112 handle by a hair.
As is evident from the weekly timeframe, this week’s selling, technically speaking, is likely due to price trading around a conspicuous weekly supply zone at 115.50-113.85. The flipside to this, of course, is daily action is currently seen lurking within the walls of a daily demand base coming in at 111.99-112.57. A violation of this area will, almost immediately, place the daily candles within striking distance of a daily support drawn from 111.66.
Market direction: Selling on the basis of weekly structure is chancy. Besides the noted daily demand, we also have the 112 handle plotted nearby. Waiting for a break below the 112 handle to short would also be an awkward setup to pull off, since directly below this number is the aforementioned daily support! In regard to buying, it is unlikely that the bulls will print anything of note from the current daily demand given the position of price on the weekly timeframe!
Therefore, opting to remain on the sidelines may be the best path to take.
Data points to consider: US empire state manufacturing index at 1.30pm; US industrial production m/m and capacity utilization rate at 2.15pm GMT.
Areas worthy of attention:
Supports: 112 handle; 111.99-112.57; 111.66.
Resistances: 112.58; 112.64; 113.91-113.45; 115.50-113.85.
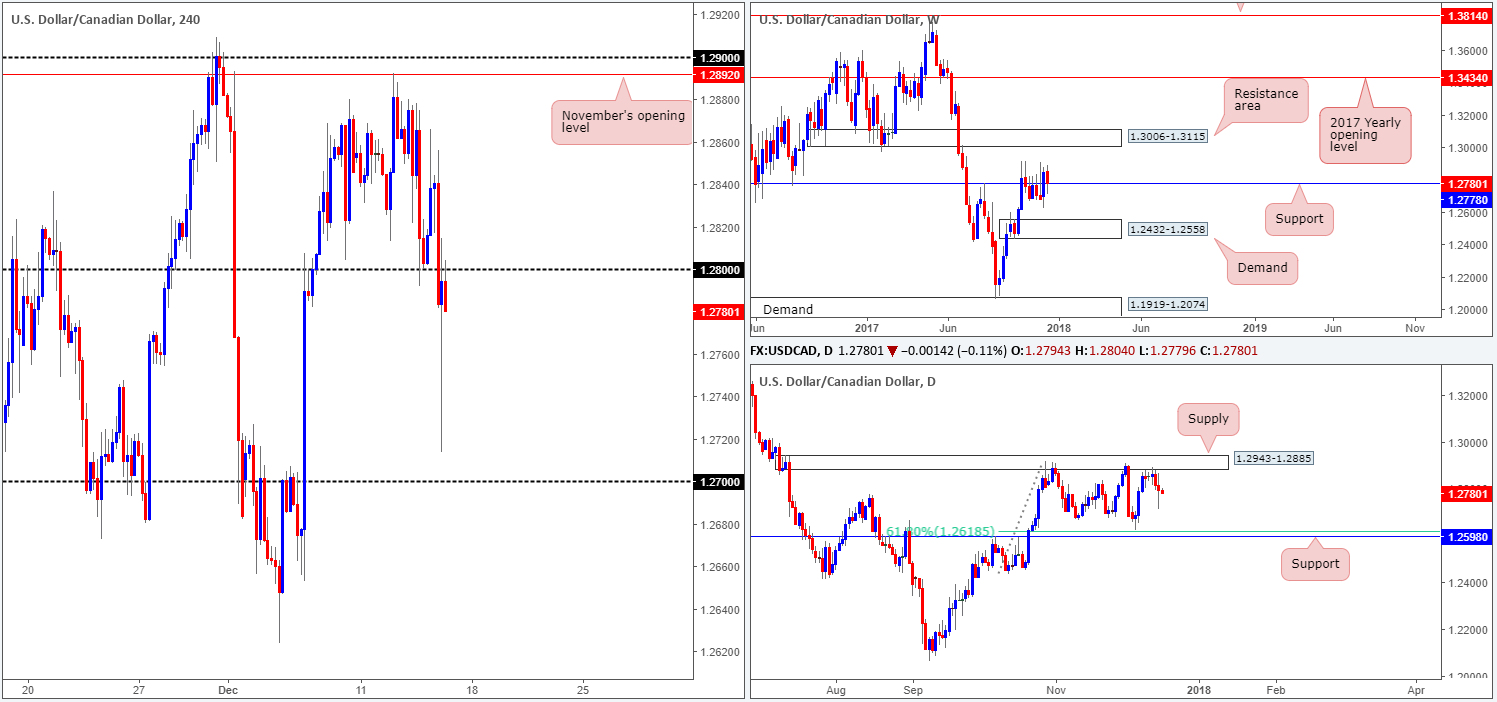
USD/CAD:
Looking at this market from the top this morning, we can see that weekly support at 1.2778 remains in the fray. A strong bid from this area could lead to weekly price challenging the weekly resistance area pegged at 1.3006-1.3115. Daily price, on the other hand, continues to form a somewhat bearish tone after selling off from a daily supply area at 1.2943-1.2885 earlier in the week.
A closer look at price action on the H4 timeframe shows that the USD/CAD experienced heavy selling pressure in the later hours of US trading on Thursday, following hawkish comments from BoC Gov. Poloz. After striking a low of 1.2713, the couple managed to recover relatively quickly and rejoin the 1.28 handle into the closing bell.
Market direction:
Should H4 price remain bearish sub 1.28 today, this could be a sign that further selling is on the cards. Let’s keep in mind here that daily price shows room to move as far south as daily support coming in at 1.2598 (merges with a 61.8% daily Fib support at 1.2618). Nevertheless, before the bears can move into second gear, the weekly buyers will need to be taken out around 1.2778! As such, why not consider waiting for a H4 close below the weekly support to take shape, before considering a sell. That way, the path south is likely going to be relatively free down to at least 1.27, and quite possibly beyond.
Data points to consider: US empire state manufacturing index at 1.30pm; US industrial production m/m and capacity utilization rate at 2.15pm; CAD manufacturing sales m/m at 1.30pm GMT.
Areas worthy of attention:
Supports: 1.2778; 1.2598; 1.27 handle.
Resistances: 1.28 handle; 1.2943-1.2885.
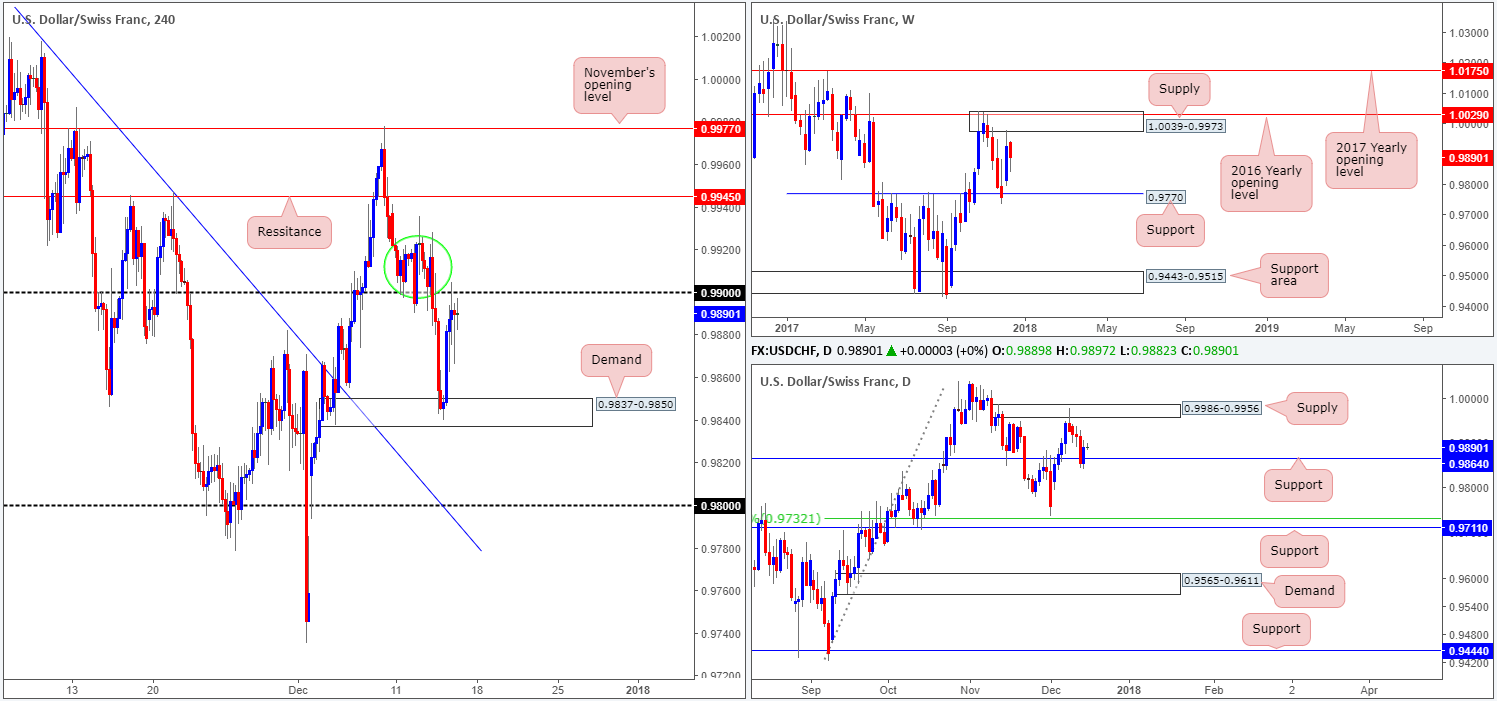
USD/CHF:
During the course of yesterday’s sessions, the SNB announced that it’s maintaining its expansionary policy with the aim of stabilizing price developments and supporting economic activity. This sparked a round of USD/CHF buying from H4 demand at 0.9837-0.9850, and attracted fresh bids into the market, with the day concluding around the 0.99 handle.
As you can probably see, yesterday’s move was backed by the fact that daily price was interacting with an interesting level on the daily timeframe at 0.9864. How long this level will remain bid is difficult to judge, however, simply because weekly price has spent the majority of this week extending last week’s reaction to weekly supply painted at 1.0039-0.9973.
Market direction:
A selloff from 0.99 could be seen today, as let’s remember that weekly price remains in a bearish position from weekly supply mentioned above at 1.0039-0.9973. However, there’s not much room to play with here since directly below sits daily support at 0.9864.
A buy above 0.99 is the alternative. With that being said, nevertheless, you’ll initially have to chop through a solid base of H4 price ranging from 0.9925/0.99 (green circle). Not only this, you’ll also have to contend with potential weekly selling!
Neither a long nor short seems attractive at current prices.
Data points to consider: US empire state manufacturing index at 1.30pm; US industrial production m/m and capacity utilization rate at 2.15pm GMT.
Areas worthy of attention:
Supports: 0.9837-0.9850; 0.9864.
Resistances: 0.99 handle; 1.0039-0.9973.
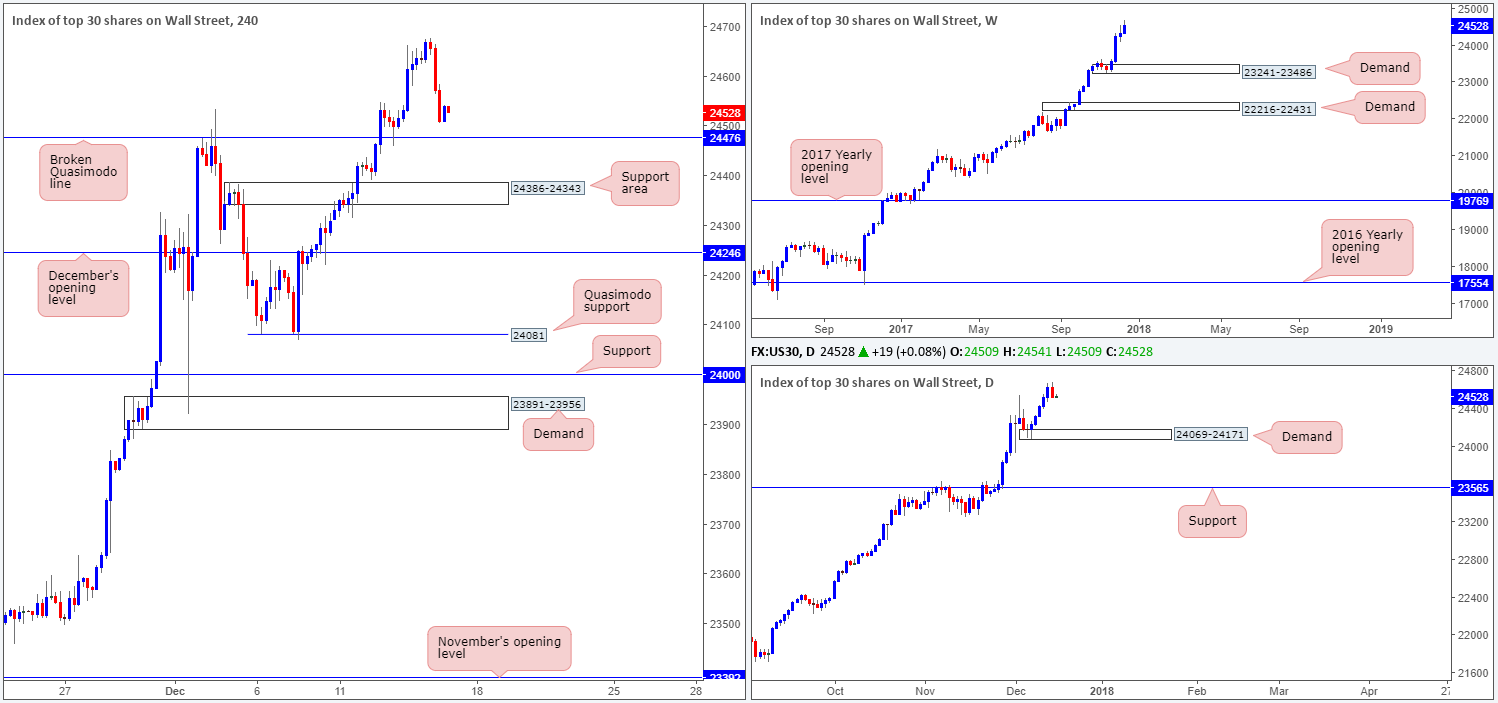
DOW 30:
US equities took a hit to the mid-section on Thursday, erasing all of Wednesday’s gains in the process. Uncertainties surrounding the tax bill triggered the selloff, which, as can be seen on the H4 timeframe, has placed price back within striking distance of the H4 broken Quasimodo line at 24476.
Despite yesterday’s descent breaking a five-day bullish phase, we personally feel this is only a temporary blip in the grand scheme of things. Should the current H4 support fail to hold, the next base of H4 support is seen close by at 24386-24343: a supply-turned support area.
Market direction:
With 24476 now a proven support level (the retest seen in the early hours of Wednesday), one may want to keep a tab on this level today for a possible second retest. Waiting for additional candle confirmation from here, however, is something to consider since buy orders may be weak, and therefore could encourage a move lower.
Data points to consider: US empire state manufacturing index at 1.30pm; US industrial production m/m and capacity utilization rate at 2.15pm GMT.
Areas worthy of attention:
Supports: 24476; 24386-24343.
Resistances: …
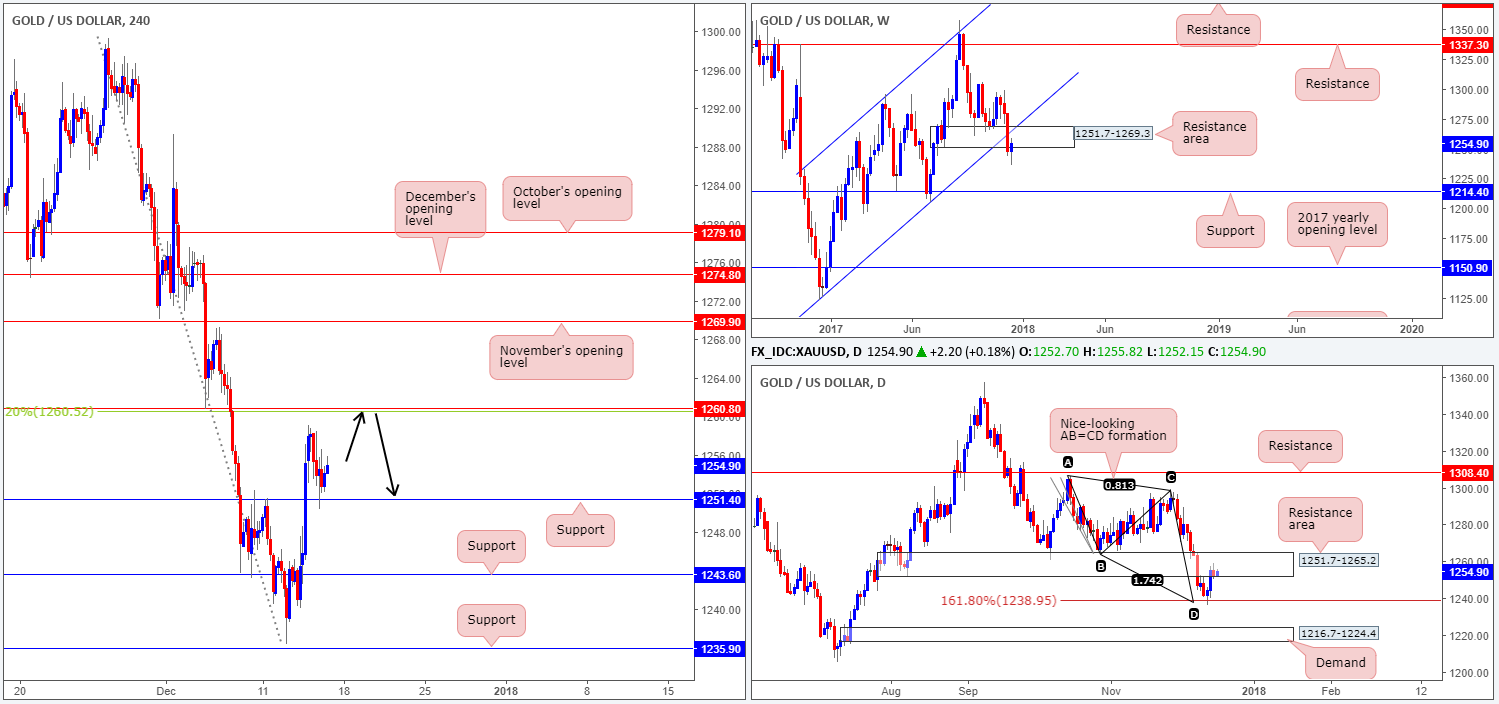
GOLD (XAU/USD):
The bounce from the daily AB=CD 161.8% Fib ext. point at 1238.9 attracted fresh buying in recent trade, pushing the daily candles back up to a daily resistance area coming in at 1251.7-1265.2. Traders might have also noticed that surrounding this daily zone is a larger resistance area plotted on the weekly timeframe at 1251.7-1269.3 that intersects with the underside of a weekly channel support-turned resistance taken from the low 1122.8.
In spite of the two areas of resistance currently in play, H4 price recently retested 1251.4 as support, and shows room to advance up to at least H4 resistance penciled in at 1260.8. Beyond this level, we have an eyeball on November’s opening level seen at 1269.9 (essentially marks the top edge of the noted weekly resistance area).
Market direction:
A long at current prices is considered a risky deal, in our book. Aside from the higher-timeframe resistance areas in motion, there’s also the current downtrend to take into consideration. Since topping at highs of 1357.5 in early September, this market has struggled to print anything of note to the upside.
On account of the above, could a sell at the next upside H4 resistance (1260.8) be an option? It could, considering that it fuses nicely with a 38.2% H4 Fib resistance at 1260.5. To be on the safe side, however, waiting for additional H4 candle confirmation, preferably in the shape of a full or near-full-bodied formation, might be the better path to take. This will help avoid any fakeout above the resistances!
Areas worthy of attention:
Supports: 1251.4; 1238.9.
Resistances: 1251.7-1269.3; 1251.7-1265.2; 1260.8.


