Waiting for lower timeframe confirmation is our main tool to confirm strength within higher timeframe zones, and has really been the key to our trading success. It takes a little time to understand the subtle nuances, however, as each trade is never the same, but once you master the rhythm so to speak, you will be saved from countless unnecessary losing trades. The following is a list of what we look for:
- A break/retest of supply or demand dependent on which way you’re trading.
- A trendline break/retest.
- Buying/selling tails/wicks – essentially we look for a cluster of very obvious spikes off of lower timeframe support and resistance levels within the higher timeframe zone.
- Candlestick patterns. We tend to stick with pin bars and engulfing bars as these have proven to be the most effective.
We typically search for lower-timeframe confirmation between the M15 and H1 timeframes, since most of our higher-timeframe areas begin with the H4. Stops are usually placed 1-3 pips beyond confirming structures.
EUR/USD:
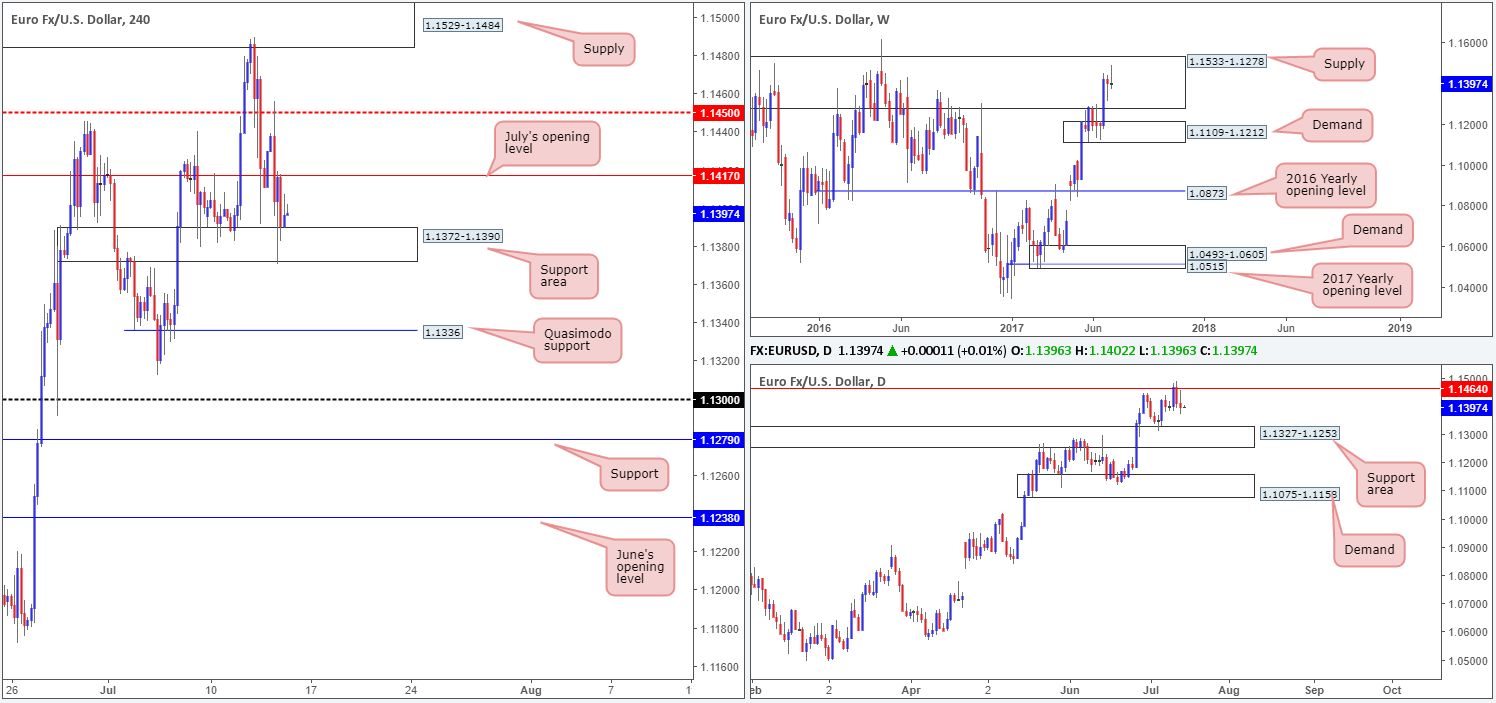
Despite the single currency clocking a session high of 1.1455 on Thursday, price ended the day challenging the H4 support area seen below at 1.1372-1.1390. While this zone is seen holding ground right now, we believe the odds of price breaching this area is high. Our reasoning lies within the higher-timeframe structures. Weekly price remains loitering within the walls of a major supply drawn from 1.1533-1.1278 (that has capped upside since May 2015), and appears to be on course to print a strong-looking selling wick. In addition to this, we can also see daily action showing room to trade down to at least the support area coming in at 1.1327-1.1253.
For those who have been following recent reports on the EUR/USD you may recall that our desk is currently short from 1.1484. 50% of the position has already been liquidated around July’s opening level at 1.1417 and the stop-loss order is now located at breakeven.
Our suggestions: The final take-profit level for our trade is set at the H4 Quasimodo support pegged from 1.1336, positioned just nine pips above the top edge of the aforementioned daily support area.
Although we feel the current H4 support area is vulnerable, trying to join the sellers at current price is still considered risky since we can never really know how many active buyers reside here. Therefore, other than the short trade currently in play, we do not see much else to hang our hat on at the moment.
Data points to consider: French banks will be closed in observance of National Day. US Inflation and Retail sales figures scheduled to be released at 1.30pm. FOMC member Kaplan speaks at 2.30pm GMT+1.
Levels to watch/live orders:
- Buys: Flat (stop loss: N/A).
- Sells: 1.1484 (stop loss: breakeven).
GBP/USD:
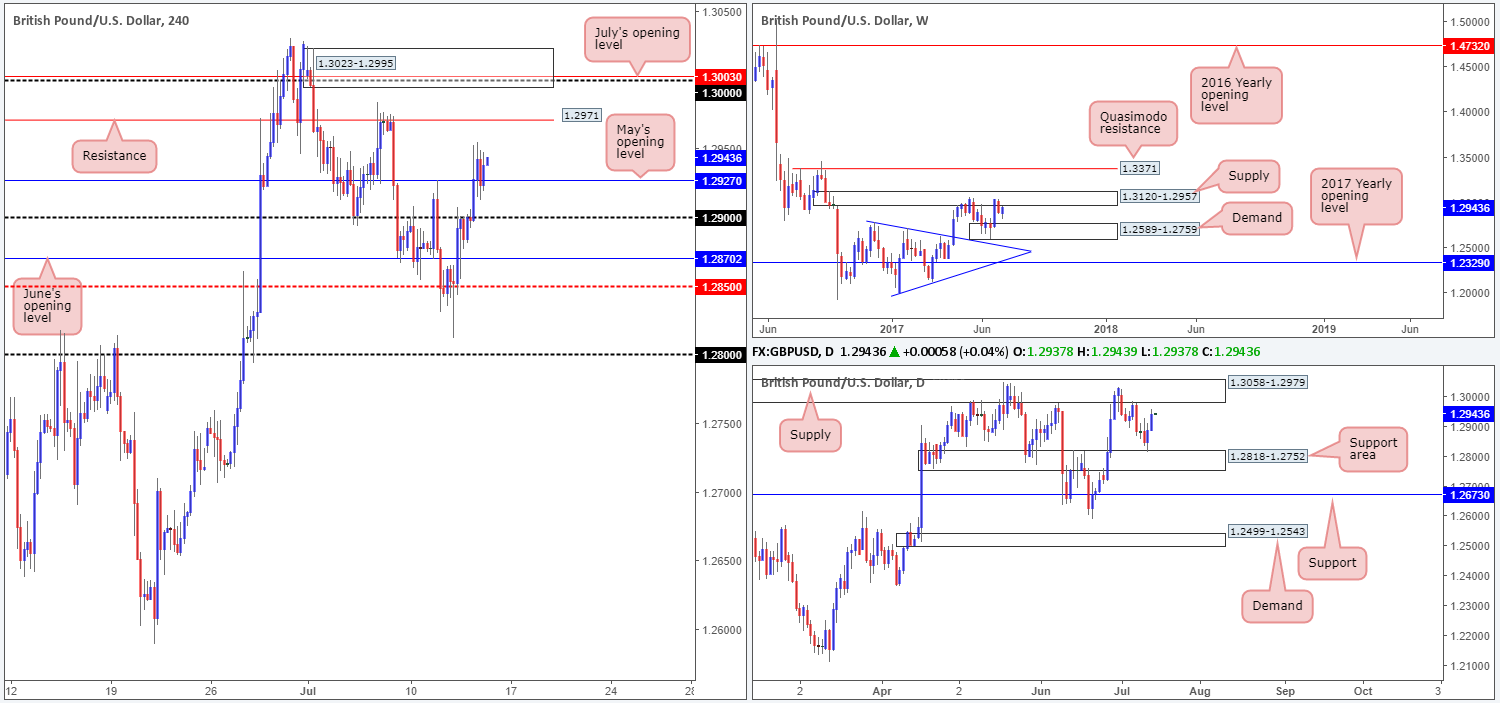
Pound sterling advanced north for a second consecutive day on Thursday, reaching a high of 1.2954. As a result of this, the weekly timeframe shows price to be revisiting the underside of supply at 1.3120-1.2957. What’s also notable is that daily action is seen trading within touching distance of supply coming in at 1.3058-1.2979, which happens to be positioned within the said weekly supply.
Sweeping across to the H4 candles, the major is currently seen bid above May’s opening level at 1.2927. Should the bulls remain dominant, the next upside target from here is a H4 resistance at 1.2971, followed closely by the large psychological line at 1.30, July’s opening level at 1.3003 and a H4 supply at 1.3023-1.2995.
Our suggestions: The only area our desk has expressed interest in this morning is the H4 supply mentioned above at 1.3023-1.2995. Not only because of its surrounding H4 confluence, but also due to it being positioned within both of the above said weekly and daily supply areas!
As we are currently short the EUR/USD, we will probably pass on this setup. However, if we had no active positions, this would be an area we’d sell using a pending order at 1.30, with a stop placed above at 1.3025.
Data points to consider: US Inflation and Retail sales figures scheduled to be released at 1.30pm. FOMC member Kaplan speaks at 2.30pm GMT+1.
Levels to watch/live orders:
- Buys: Flat (stop loss: N/A).
- Sells: 1.3023-1.2995 (sells from here do not require additional confirmation).
AUD/USD:
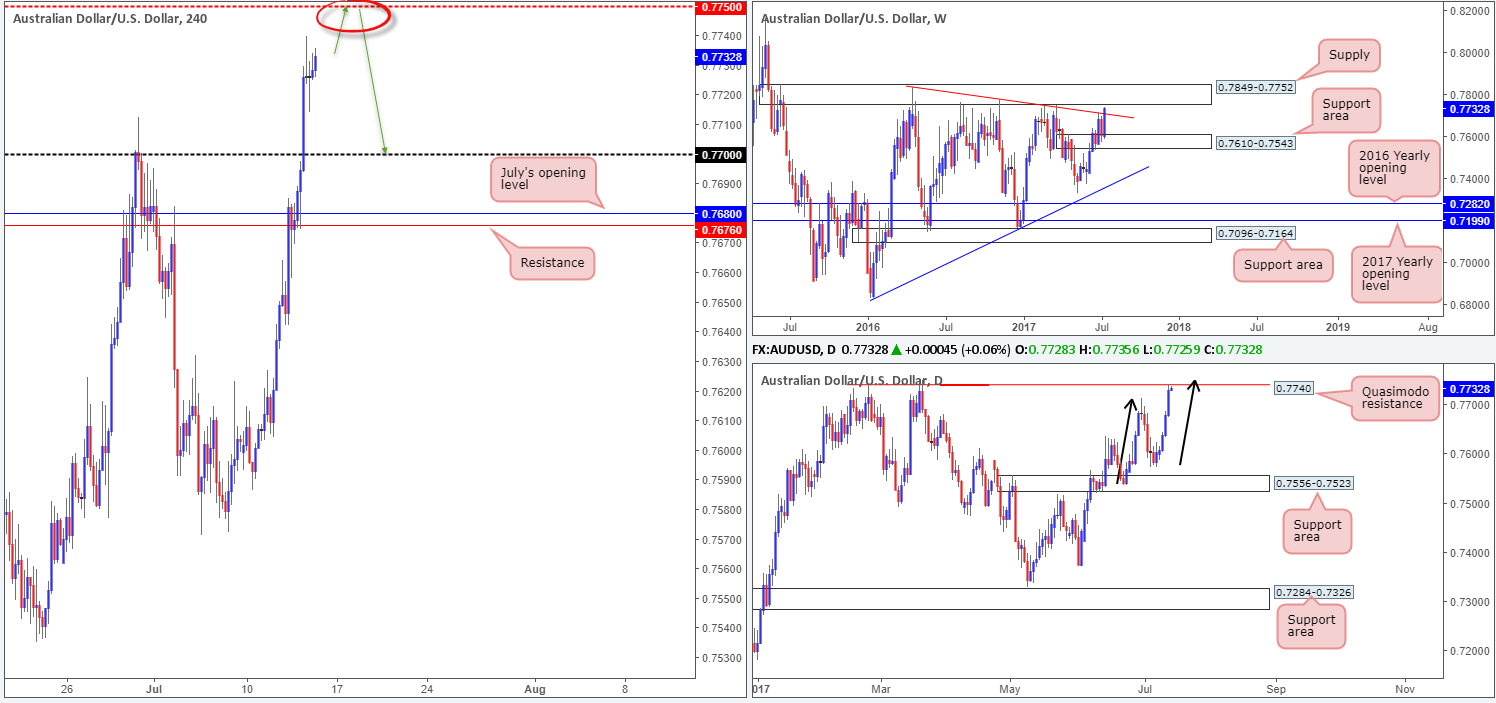
Coming in from the top this morning, we can see that weekly price is trading marginally above the trendline resistance drawn from the high 0.7835, and is now positioned within striking distance of a supply area at 0.7849-0.7752. Daily price on the other hand, is seen responding to a Quasimodo resistance marked at 0.7740. The interesting thing here is that not only is this Quasimodo level planted 12 pips below the said weekly supply, it also converges extremely close with an AB=CD formation (black arrows).
A closer look at price action on the H4 chart shows the commodity currency to be on course to challenge 0.7750. By itself, this number has extraordinary historical significance as a resistance, thus likely being a level traders are going to be watching this morning.
Our suggestions: Put simply, the team believes that 0.7750 will hold the Aussie lower. In regard to stop-loss placement, we would likely position it above the high formed back on the 8th Nov 2016 at 0.7778. The first take-profit level would, for us at least, be the 0.77 vicinity.
Data points to consider: US Inflation and Retail sales figures scheduled to be released at 1.30pm. FOMC member Kaplan speaks at 2.30pm GMT+1.
Levels to watch/live orders:
- Buys: Flat (stop loss: N/A).
- Sells: 0.7750 region (stop loss: 0.7780).
USD/JPY:
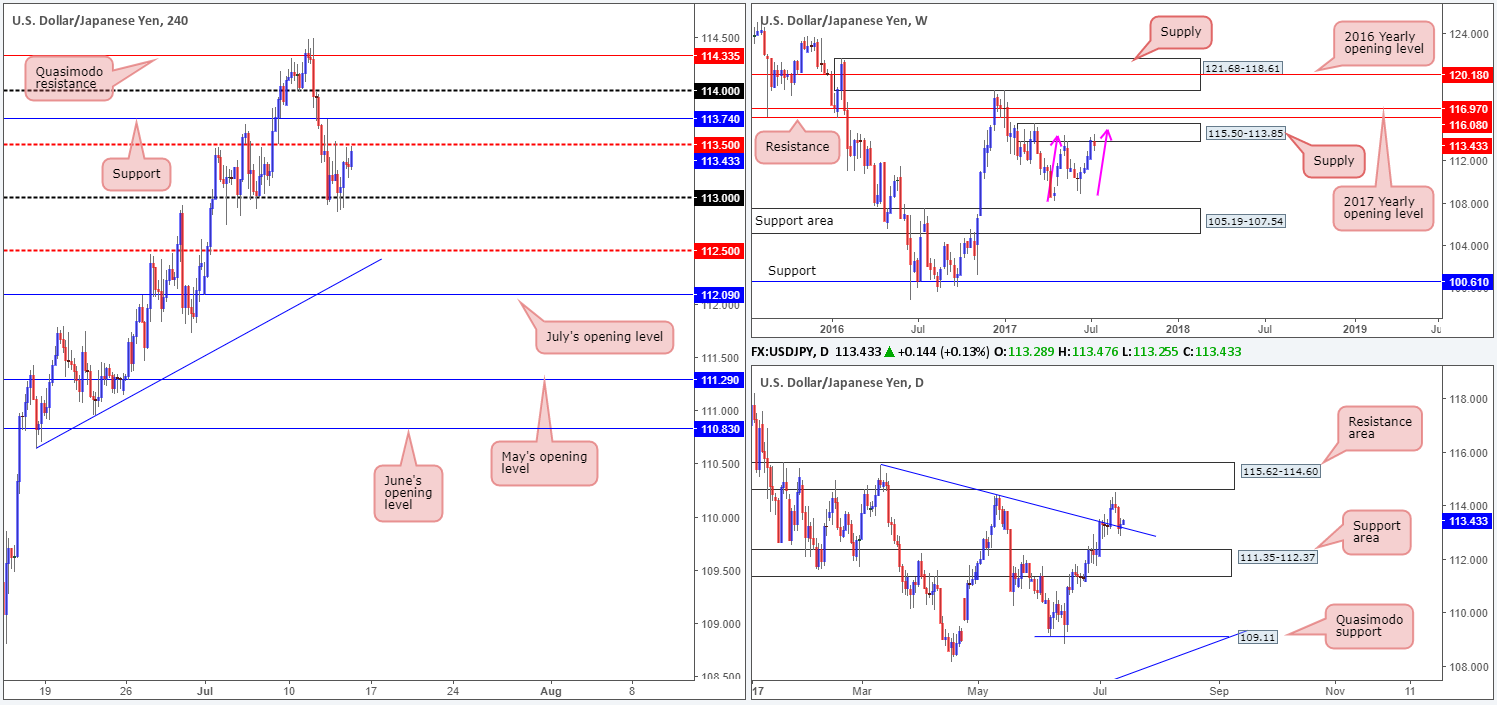
The USD/JPY, as you can see, is currently underpinned by a psychological level at 113. Alongside this, however, we can also see the overhead H4 mid-level resistance at 113.50 is putting up a good fight!
As highlighted in Thursday’s report, this market is a tricky beast to trade at the moment. On the one hand, we have weekly action suggesting that further selling may be on the cards from the supply zone at 115.50-113.85, while on the other hand daily price is seen trading from a trendline support etched from the high 115.50.
While we do believe the weekly sellers will eventually force the unit lower, it is just too much of a risk to sell right now when daily price is challenging a trendline support.
Our suggestions: On account of the above, we’ll remain flat into the weekend.
Data points to consider: US Inflation and Retail sales figures scheduled to be released at 1.30pm. FOMC member Kaplan speaks at 2.30pm GMT+1.
Levels to watch/live orders:
- Buys: Flat (stop loss: N/A).
- Sells: Flat (stop loss: N/A).
USD/CAD:
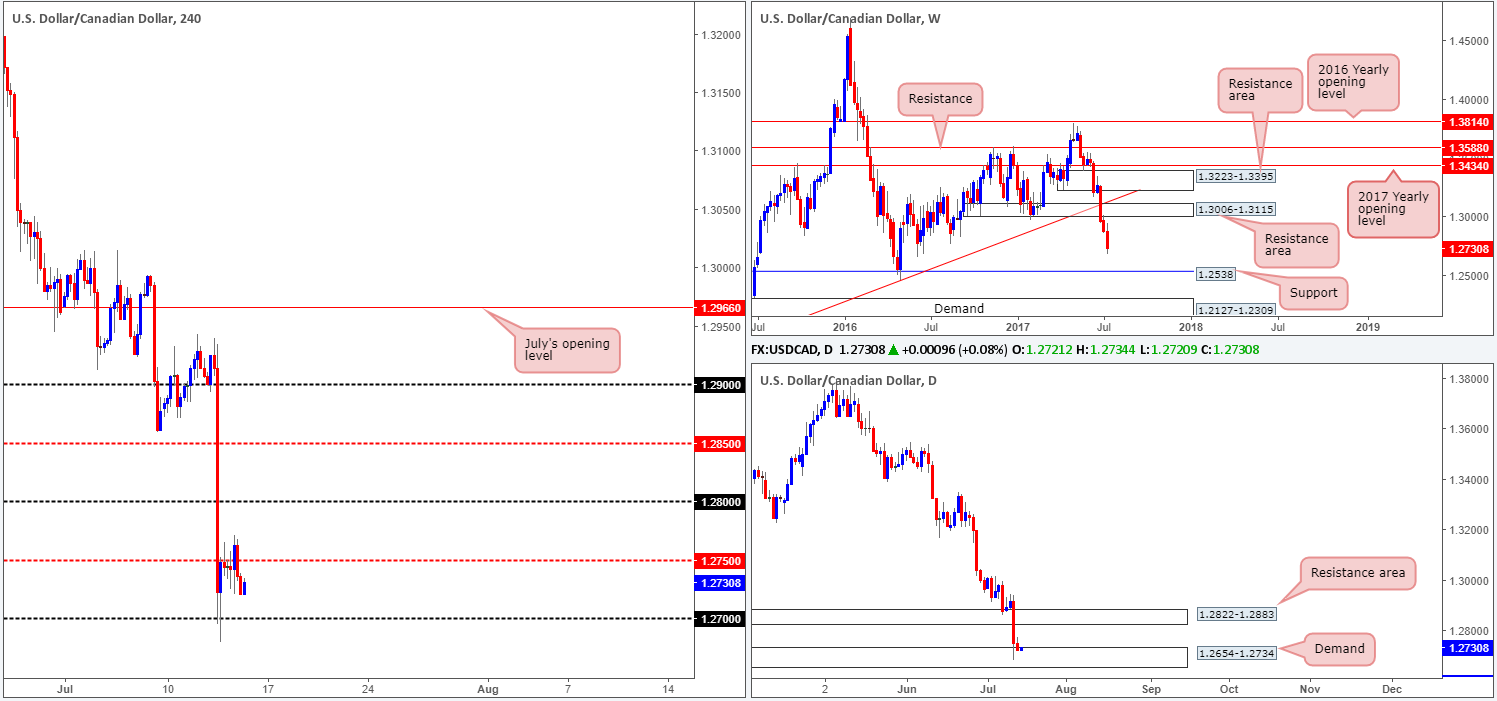
The USD/CAD took on more of a sober approach yesterday in comparison to Wednesday’s aggressive move south. H4 price remains afloat above the 1.27 handle, but has failed to generate much follow through momentum beyond the nearby mid-level resistance line at 1.2750. Consequent to yesterday’s rather lackluster performance, much of the following report will echo thoughts put forward in Thursday’s analysis.
The weekly technicals show space to continue pressing south all the way down to support coming in at 1.2538. While this sounds great, it might be worth noting that weekly sellers have to contend with not only a daily demand base at 1.2654-1.2734, but also a daily Quasimodo support level seen just below it at 1.2592 (not seen on the screen).
Our suggestions: Watch for a decisive H4 close beyond the 1.27 handle. This would, in our view, signal seller strength on the weekly chart and buyer weakness within the current daily demand, and therefore potentially open up the possibility for a sell trade on any retest seen at 1.27.
Data points to consider: US Inflation and Retail sales figures scheduled to be released at 1.30pm. FOMC member Kaplan speaks at 2.30pm GMT+1.
Levels to watch/live orders:
- Buys: Flat (Stop loss: N/A).
- Sells: Watch for H4 price to engulf the 1.27 handle and then look to trade any retest seen thereafter ([waiting for a H4 bearish candle – preferably in the form of a full, or near-full-bodied candle – to form following the retest is advised] stop loss: ideally beyond the candle’s wick).
USD/CHF:
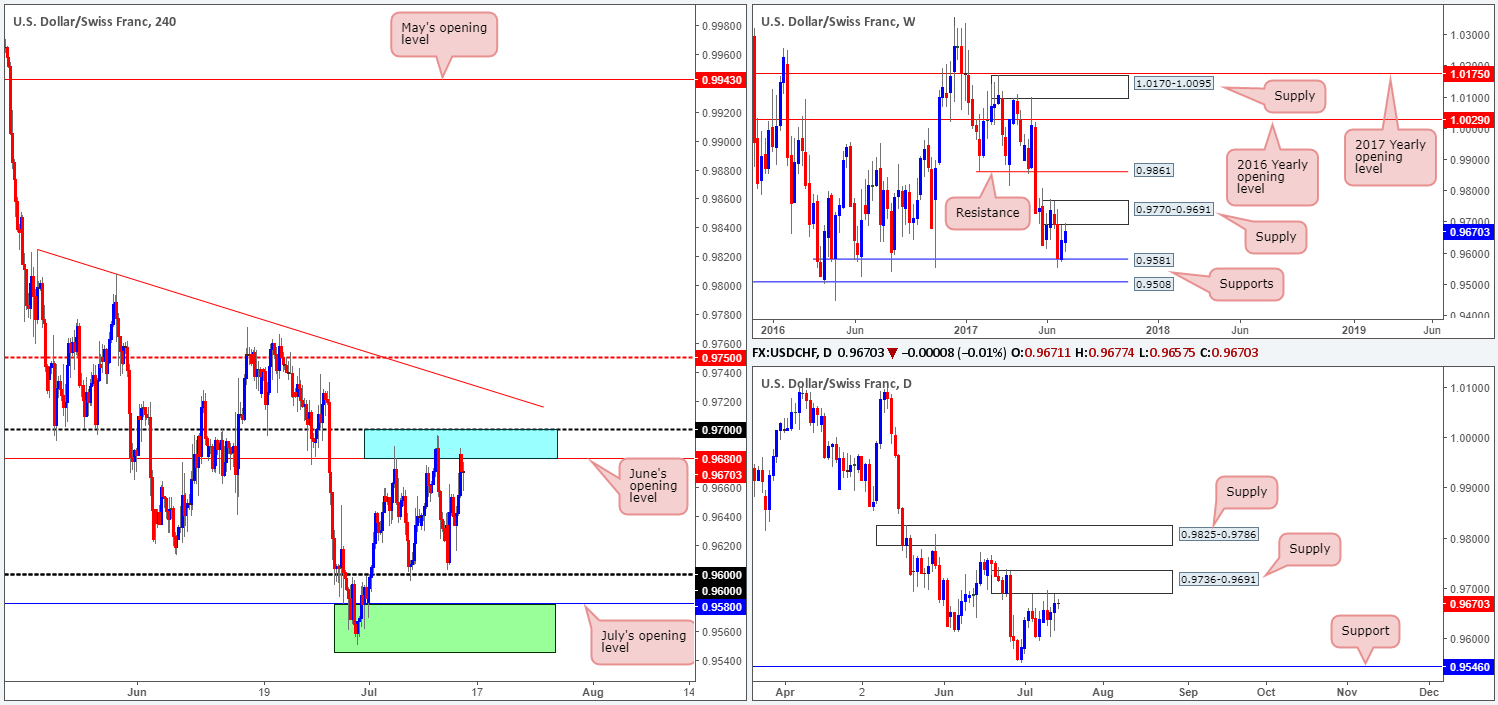
As can be seen from the H4 chart this morning, price remains consolidating between 0.97/0.9680 (round number/June’s opening level – blue zone) and the 0.96 handle, and has been since the 5th May. In Thursday’s report, we noted that it’s difficult to judge which way this range will eventually break. This is because on the weekly chart, price is also seen loitering between a supply at 0.9770-0.9691 and a support formed at 0.9581.
With this in mind, we remain interested in the two following zones for potential trades:
- The first is the blue resistance zone mentioned above at 0.97/0.9680, which is being retested as we write. We’ve selected this area since not only is this barrier lodged around the underside of the said weekly supply, but there’s also a partner supply seen on the daily timeframe at 0.9736-0.9691 that’s in play.
- The second zone is a support area marked in green comprised of a daily support at 0.9546 and the weekly support at 0.9581, which also happens to converge closely with July’s opening level at 0.9580.
Our suggestions: To initiate a trade at either of the above noted zones, nevertheless, we would require H4 candle confirmation, preferably in the shape of a full, or near-full-bodied candle. This is just a way to confirm that there are other speculators interested in the same zone as we are!
Data points to consider: US Inflation and Retail sales figures scheduled to be released at 1.30pm. FOMC member Kaplan speaks at 2.30pm GMT+1.
Levels to watch/live orders:
- Buys: 0.9546/0.9581 ([waiting for a H4 bull candle – preferably a full, or near full-bodied candle – to form is advised] stop loss: ideally beyond the candle’s tail).
- Sells: 0.97/0.9680 ([waiting for a H4 bear candle – preferably a full, or near full-bodied candle – to form is advised] stop loss: ideally beyond the candle’s wick).
DOW 30:
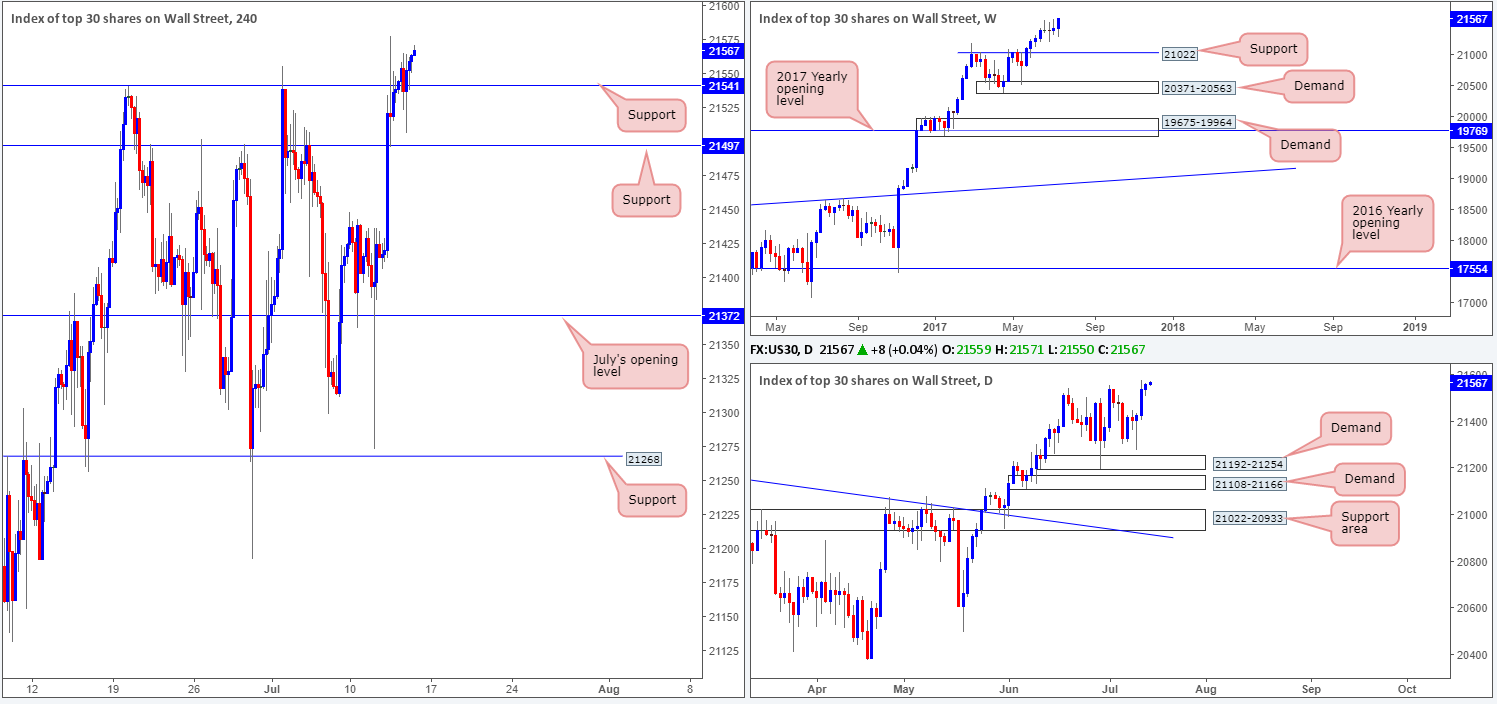
In recent trading, the H4 candles closed above resistance at 21541, and aggressively tested the line as support. This, for our team at least, signals further upside is likely on the cards today and possibly into next week.
Initially, we were looking to trade long on any retest seen at 21541, following a break higher. However, given that the retest of this level was so violent and deep, we refrained from buying this market.
Overhead, there is absolutely no resistance seen on either the H4, daily or weekly timeframes. To that end, should we see H4 price retest 21541 again today, and hold firm, we would have no hesitation in pulling the trigger this time.
Our suggestions: Should the above scenario come to fruition, our desk has noted that they would look to trail the position, in the hope of joining the rather steep uptrend the DOW is currently entrenched within right now (see weekly chart).
Data points to consider: US Inflation and Retail sales figures scheduled to be released at 1.30pm. FOMC member Kaplan speaks at 2.30pm GMT+1.
Levels to watch/live orders:
- Buys: 21541 ([waiting for a H4 bull candle – preferably a full, or near full-bodied candle – to form is advised] stop loss: ideally beyond the candle’s tail).
- Sells: Flat (stop loss: N/A).
GOLD:
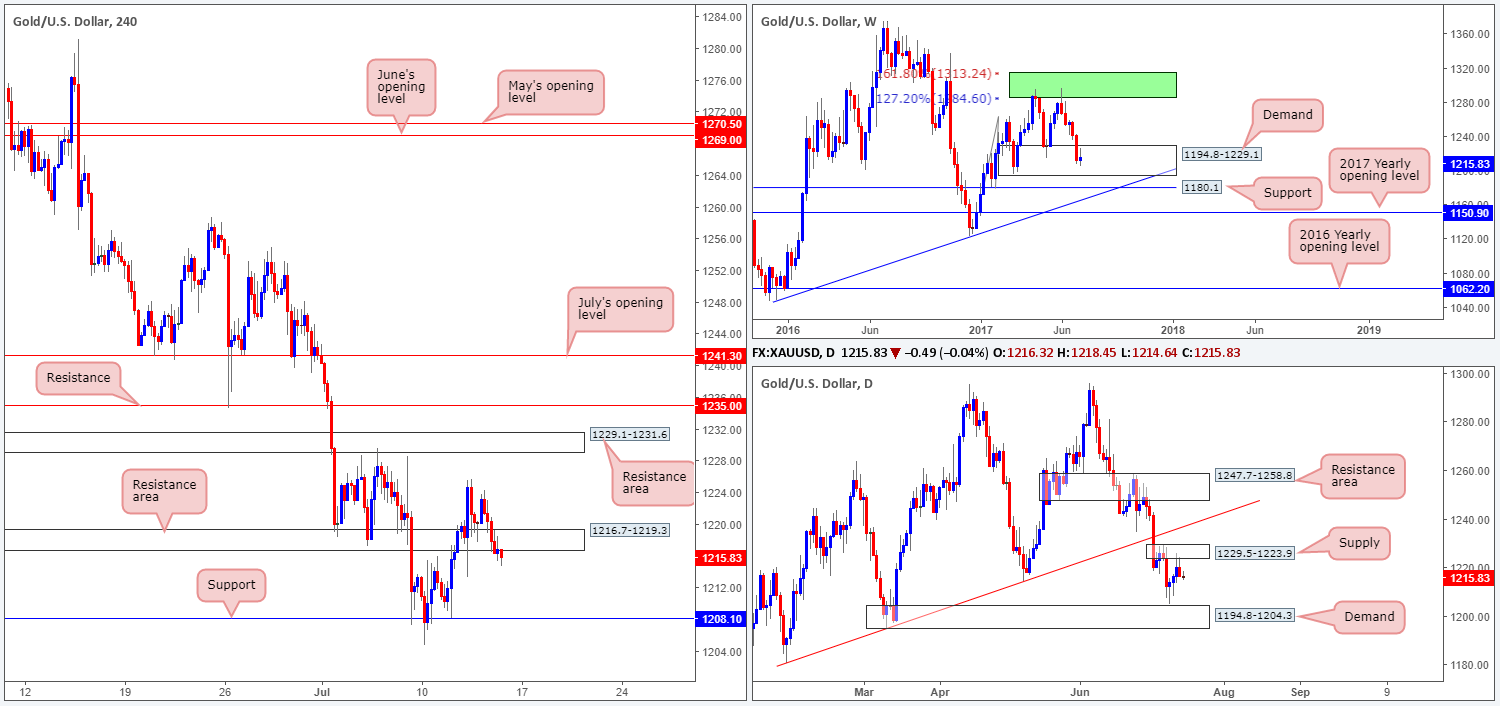
Despite seeing weekly price trading within demand at 1194.8-1229.1 right now, the daily supply area at 1229.5-1223.9 is doing a superb job in holding the candles lower. In conjunction with this daily zone, we can also see that H4 price is trading back below the support area drawn from 1216.7-1219.3.
With both daily and H4 structure signaling potential weakness within the current weekly demand, our desk is reluctant to take any long positions in this market. With that being the case, we feel there’s a strong possibility that H4 flow may drive lower and reconnect with support at 1208.1 again.
Our suggestions: Given current structure, we are not keen to get involved with this market today. Therefore, we’re going to remain flat and reassess structure going into Monday’s session.
Levels to watch/live orders:
- Buys: Flat (stop loss: N/A).
- Sells: Flat (stop loss: N/A).