Waiting for lower timeframe confirmation is our main tool to confirm strength within higher timeframe zones, and has really been the key to our trading success. It takes a little time to understand the subtle nuances, however, as each trade is never the same, but once you master the rhythm so to speak, you will be saved from countless unnecessary losing trades. The following is a list of what we look for:
- A break/retest of supply or demand dependent on which way you’re trading.
- A trendline break/retest.
- Buying/selling tails/wicks – essentially we look for a cluster of very obvious spikes off of lower timeframe support and resistance levels within the higher timeframe zone.
We typically search for lower-timeframe confirmation between the M15 and H1 timeframes, since most of our higher-timeframe areas begin with the H4. Stops are usually placed 1-3 pips beyond confirming structures.
EUR/USD:
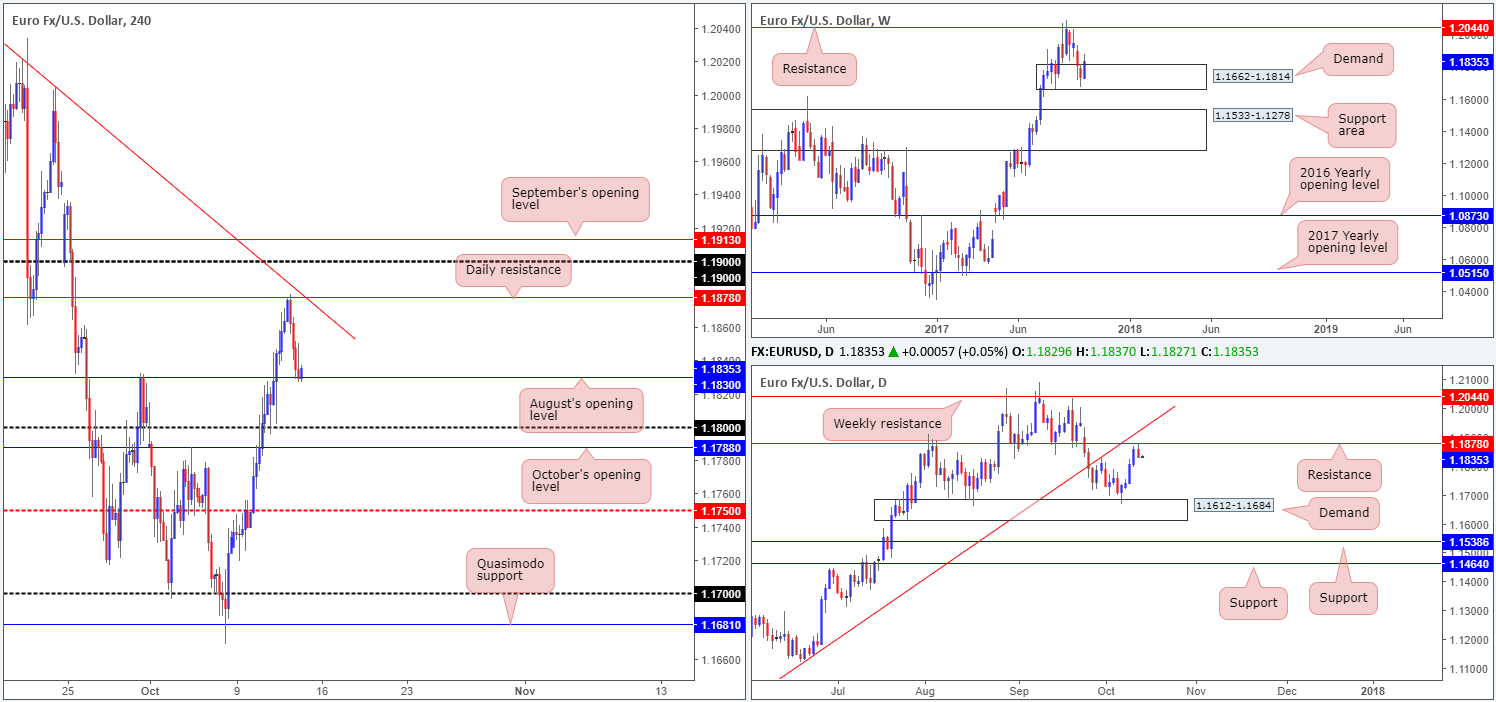
In the early hours of London, the single currency staged a meaningful recovery from the daily resistance at 1.1878, and ended the day shaking hands with August’s opening level at 1.1830. A short from this level was further confirmed by a H4 bearish engulfing candle. Fundamentally speaking, the move was also influenced by better-than-expected US initial jobless claims at 243K and a PPI increase of 2.6% on a yearly basis. Well done to any of our readers who managed to catch this move.
As of current price, H4 bulls are trying to defend August’s opening level. A violation of this barrier, however, could lead to a move down to the 1.18 neighborhood, followed closely by October’s opening level at 1.1788.
Suggestions: To our way of seeing things, the H4 chart shows room for the unit to rally back up to the daily resistance. While this may be the case, it might be worth noting that a buy from this angle would entail selling into potential daily flow from the noted resistance. On the other side of the coin, a move below Aug’s opening level is also somewhat restricted, given 1.18. In addition to this, a sell beneath the monthly hurdle places you in direct conflict with weekly buyers from demand!
Considering the above, opting to stand on the sidelines may very well be the best path to take today.
Data points to consider: US Inflation and retail sales figures m/m at 1.30pm; US Prelim UoM consumer sentiment at 3pm; FOMC member Evans speaks at 3.25pm; FOMC member Kaplan speaks at 4.30pm GMT+1.
Levels to watch/live orders:
- Buys: Flat (stop loss: N/A).
- Sells: Flat (stop loss: N/A).
GBP/USD:
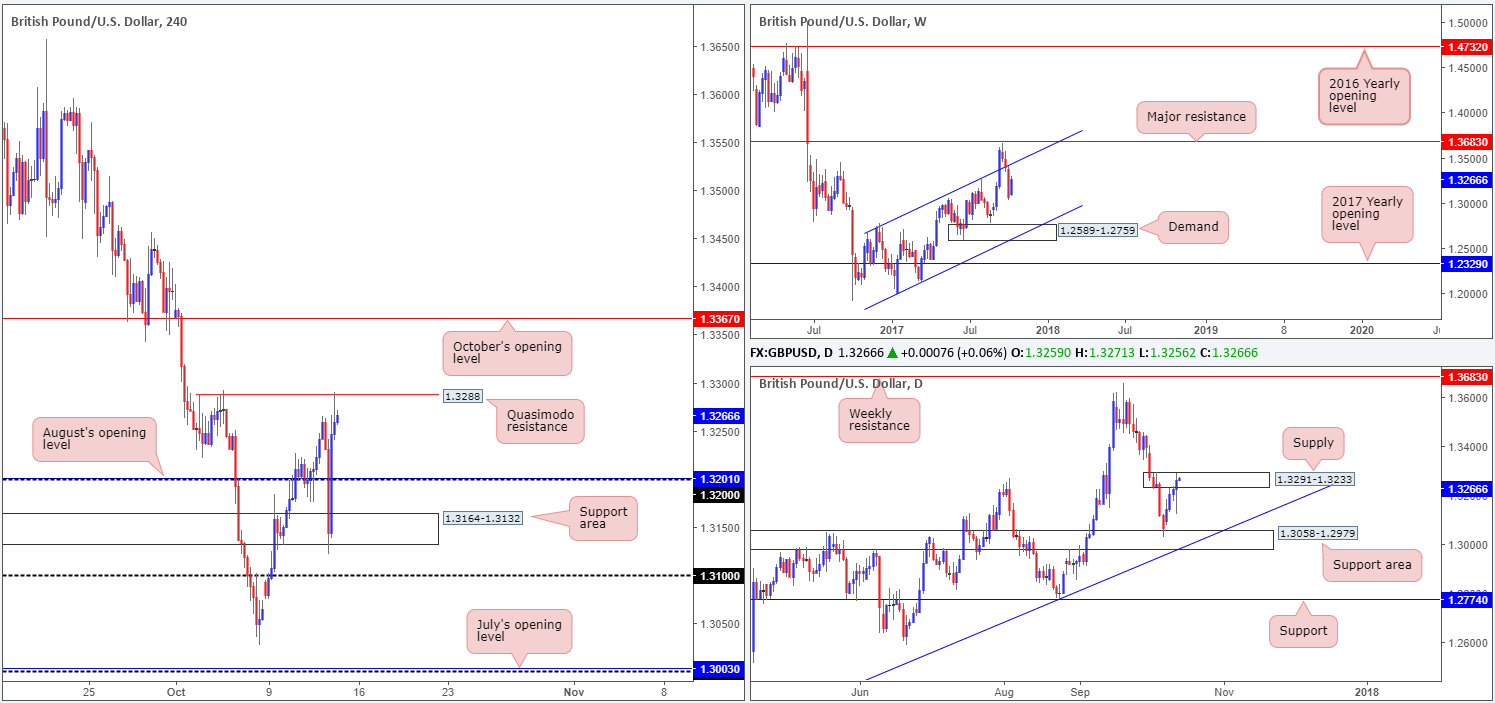
Trade update: Stopped out for a small loss at 1.3252.
The British pound, as you can see from the H4 timeframe this morning, plummeted in the early hours of yesterday’s London trade. The 1.32 handle was demolished, allowing the unit to challenge a support area coming in at 1.3164-1.3132. It was from here, despite the aggressive drop in price, the pair managed to recover relatively quickly and conclude the day testing a minor H4 Quasimodo resistance level at 1.3288. As far as we can see, recent volatility was due to uncertainty surrounding the ‘Brexit’ negotiations.
Suggestions: With weekly price still showing potential to the downside and daily price fixed within supply at 1.3291-1.3233, our bias, for the time being, remains bearish. However, selling from the current H4 Quasimodo resistance is challenging. For a short to be confirmed, at least for us, the 1.3240 low seen on the m15 timeframe would need to be consumed. This, unless you’re able to pin down a setup that requires a stop of less than 20 pips, would be a difficult trade as the take-profit level is at 1.32.
Data points to consider: US Inflation and retail sales figures m/m at 1.30pm; US Prelim UoM consumer sentiment at 3pm; FOMC member Evans speaks at 3.25pm; FOMC member Kaplan speaks at 4.30pm GMT+1.
Levels to watch/live orders:
- Buys: Flat (stop loss: N/A).
- Sells: Possible shorts from the H4 Quasimodo resistance at 1.3288 (stop loss: dependent on where one confirms this level)
AUD/USD:
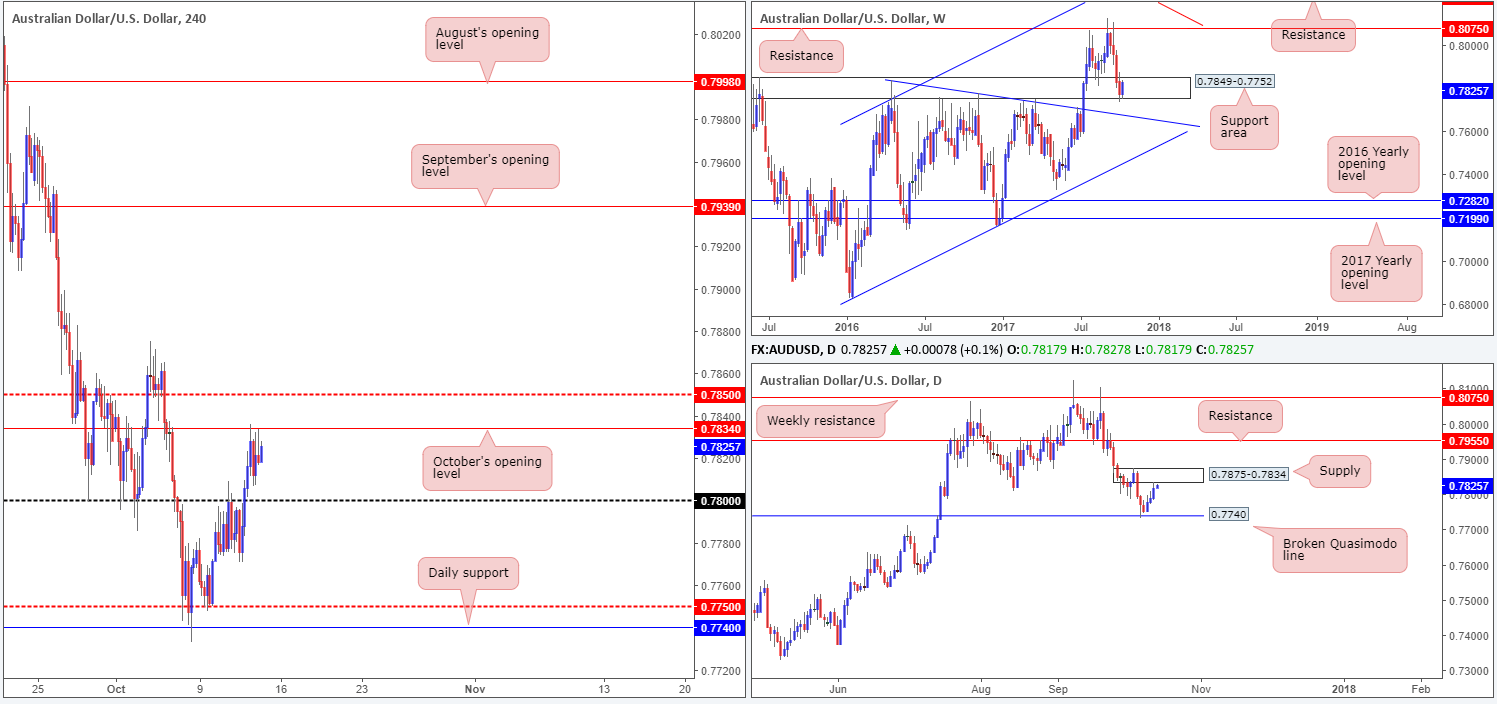
The commodity currency gravitated higher for a third consecutive day on Thursday, clocking a high of 0.7836. From our technical perspective, this recent surge in buying is likely due to weekly price trading from within the walls of a support area pegged at 0.7849-0.7752. For all that though, weekly buyers may start to feel the pinch today/next week. On the H4 timeframe, the candles are currently seen capped by October’s opening level at 0.7834, while over on the daily timeframe price is seen hugging the underside of a supply drawn from 0.7875-0.7834.
Suggestions: In our book, this is a limited market. To the upside, we not only have the noted resistances on both the daily and H4 timeframes to contend with, we also have a H4 mid-level resistance lurking just above at 0.7850. Therefore, to long this market based on where weekly price is trading from would be a minefield! To the downside, a selloff to the 0.78 handle may be on the cards given the resistances offered on both H4/daily timeframes. Unfortunately, a sell from here would provide a meager 34 pips to play with, and at the same time would have you selling into potential weekly flow.
Not the best of odds on either side this morning!
Data points to consider: RBA Financial stability review at 1.30; Chinese Trade balance (tentative); US Inflation and retail sales figures m/m at 1.30pm; US Prelim UoM consumer sentiment at 3pm; FOMC member Evans speaks at 3.25pm; FOMC member Kaplan speaks at 4.30pm GMT+1.
Levels to watch/live orders:
- Buys: Flat (stop loss: N/A).
- Sells: Flat (stop loss: N/A).
USD/JPY:
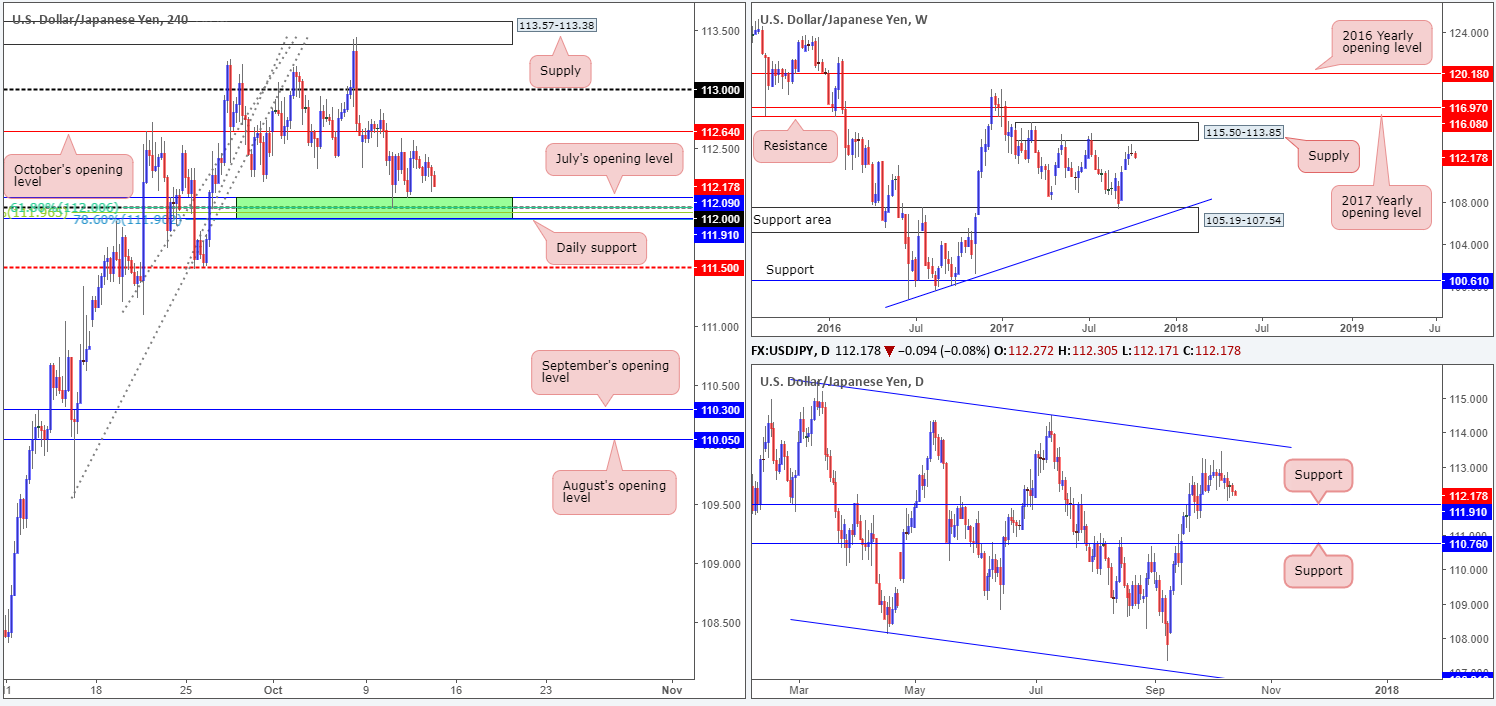
Since price struck our H4 buy zone (green) at 111.91-112.09 (10th Oct), movement has been somewhat stationary. As highlighted in previous posts, the reasoning behind underlining this buy zone comes down to the following structures:
- Positioned directly above daily support at 111.91.
- Located just below July’s opening level at 112.09.
- Sited nearby a Fibonacci cluster comprised of a 38.2% support at 111.96 taken from the low 109.54, a 61.8% support at 112 from the low 111.09 and a 78.6% support at 111.90 drawn from the low 111.47.
Despite the recent lackluster performance, we feel the noted buy zone will continue to hold going into the week’s close. Would we consider taking a long position from here? Probably not, since it is difficult to judge whether weekly sellers are entering the fray just ahead of supply drawn from 115.50-113.85.
Suggestions: Right now, we do not have much to hang our hat on. Our plan is therefore to remain flat and reassess structure following today’s inflation and retail sales figures.
Data points to consider: US Inflation and retail sales figures m/m at 1.30pm; US Prelim UoM consumer sentiment at 3pm; FOMC member Evans speaks at 3.25pm; FOMC member Kaplan speaks at 4.30pm GMT+1.
Levels to watch/live orders:
- Buys: Flat (stop loss: N/A).
- Sells: Flat (stop loss: N/A).
USD/CAD:
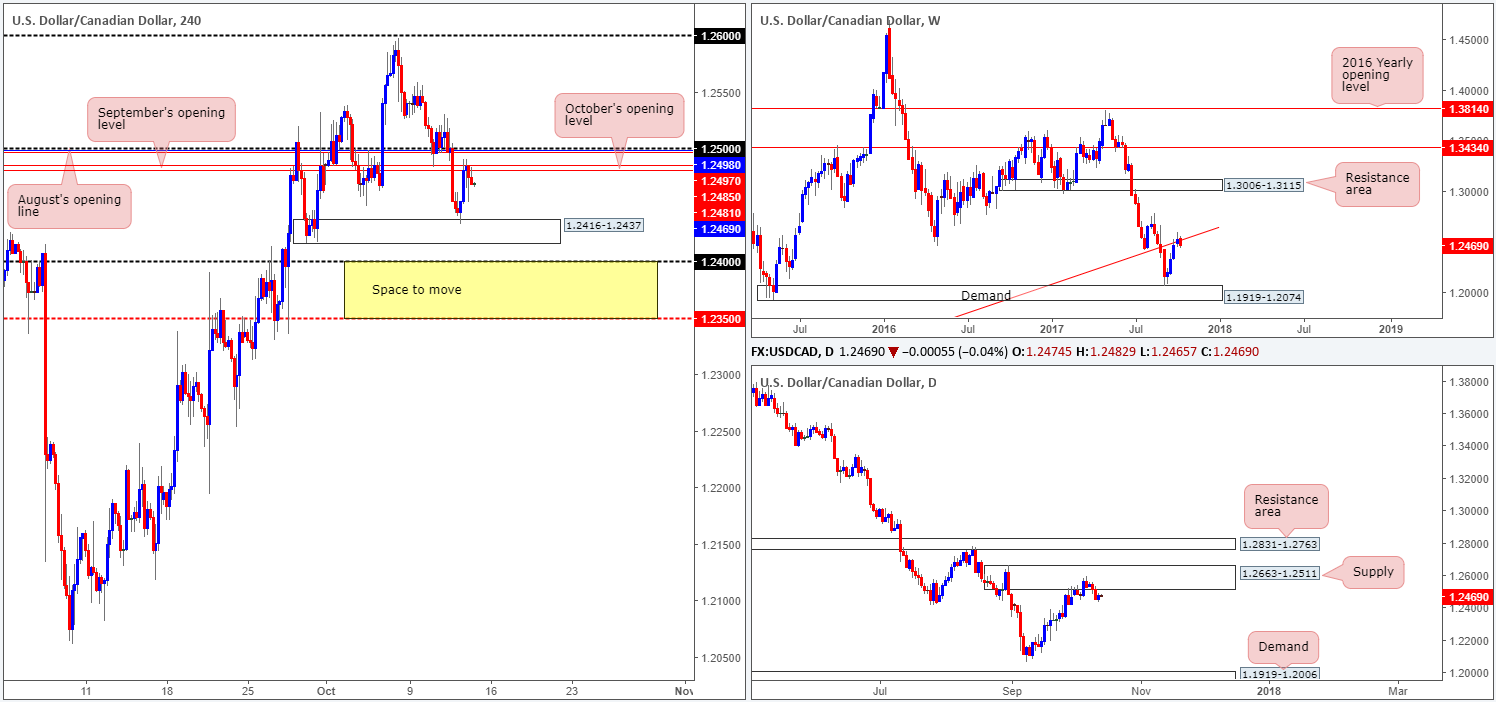
H4 demand at 1.2416-1.2437 held steady on Thursday, lifting the USD/CAD up to September/October’s opening levels at 1.2485/1.2481. These levels – coupled with August’s opening level seen directly above at 1.2497 and the 1.25 handle – will likely hold ground into the week’s end. This is largely because weekly price is seen trading from a trendline resistance etched from the low at 0.9633, along with daily action seen selling off from a supply zone pegged at 1.2663-1.2511.
However, knowing that this market is likely to remain bearish and trading it is two different things entirely. A sell from current price not only has the aforesaid H4 demand to contend with, there’s also the 1.24 handle seen directly below it.
Suggestions: Similar to Thursday’s report, the only point of interest in this market is a H4 close below 1.24. A decisive push below this number, combined with a retest and a lower-timeframe sell signal (see the top of this report for information on how to use the lower timeframes as a means of entry) would, in our book, be enough evidence to sell down to the H4 mid-level support penciled in at 1.2350 as an initial take-profit target.
Data points to consider: US Inflation and retail sales figures m/m at 1.30pm; US Prelim UoM consumer sentiment at 3pm; FOMC member Evans speaks at 3.25pm; FOMC member Kaplan speaks at 4.30pm GMT+1.
Levels to watch/live orders:
- Buys: Flat (stop loss: N/A).
- Sells: Watch for H4 price to engulf 1.24 and then look to trade any retest seen thereafter ([waiting for a lower-timeframe sell signal to form following the retest is advised] stop loss: dependent on where one confirms the number).
USD/CHF:
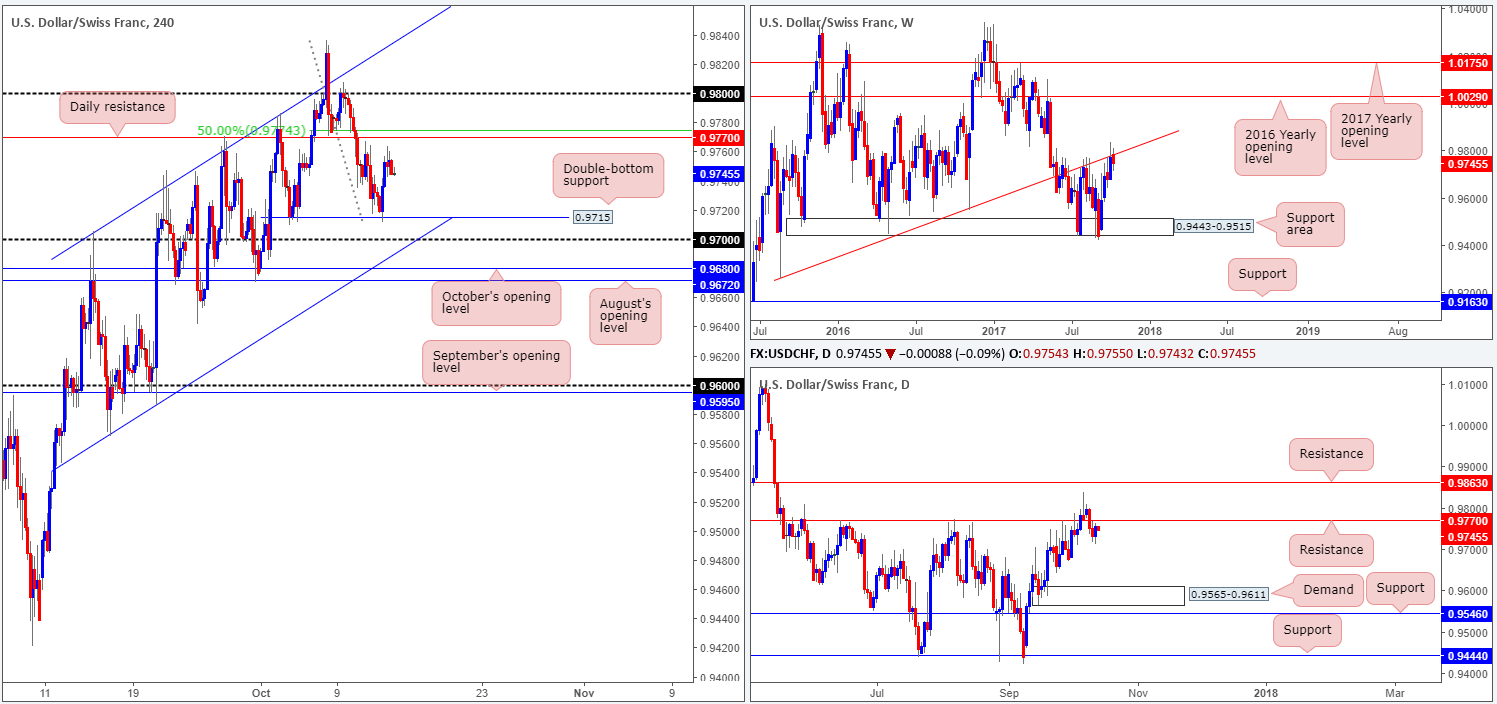
During the course of yesterday’s sessions, the USD/CHF found a floor of support around the 0.9715ish mark (now a double-bottom support) and rotated to a session high of 0.9763. Despite the weekly candles seen trading from the underside of a trendline resistance drawn from the low 0.9257, recent buying was able to bring daily flow up to within striking distance of resistance coming in at 0.9770. Therefore, we feel further buying is doubtful from a technical view point.
Suggestions: The current daily resistance – coupled with the H4 50.0% resistance at 0.9774 taken from the high 0.9836 – will likely entice sellers into the market today. To take advantage of this possible fade, we would strongly advise waiting for additional H4 confirmation in the form of a full or near-full-bodied bearish candle. This will help confirm seller intent and likely bring the Swissie down to at least 0.9715/0.97.
Data points to consider: US Inflation and retail sales figures m/m at 1.30pm; US Prelim UoM consumer sentiment at 3pm; FOMC member Evans speaks at 3.25pm; FOMC member Kaplan speaks at 4.30pm; CHF PPI m/m at 8.15am GMT+1.
Levels to watch/live orders:
- Buys: Flat (stop loss: N/A).
- Sells: 0.9770 region ([waiting for a reasonably sized H4 bearish candle to form – preferably a full, or near-full-bodied candle – is advised] stop loss: ideally beyond the candle’s wick).
DOW 30:
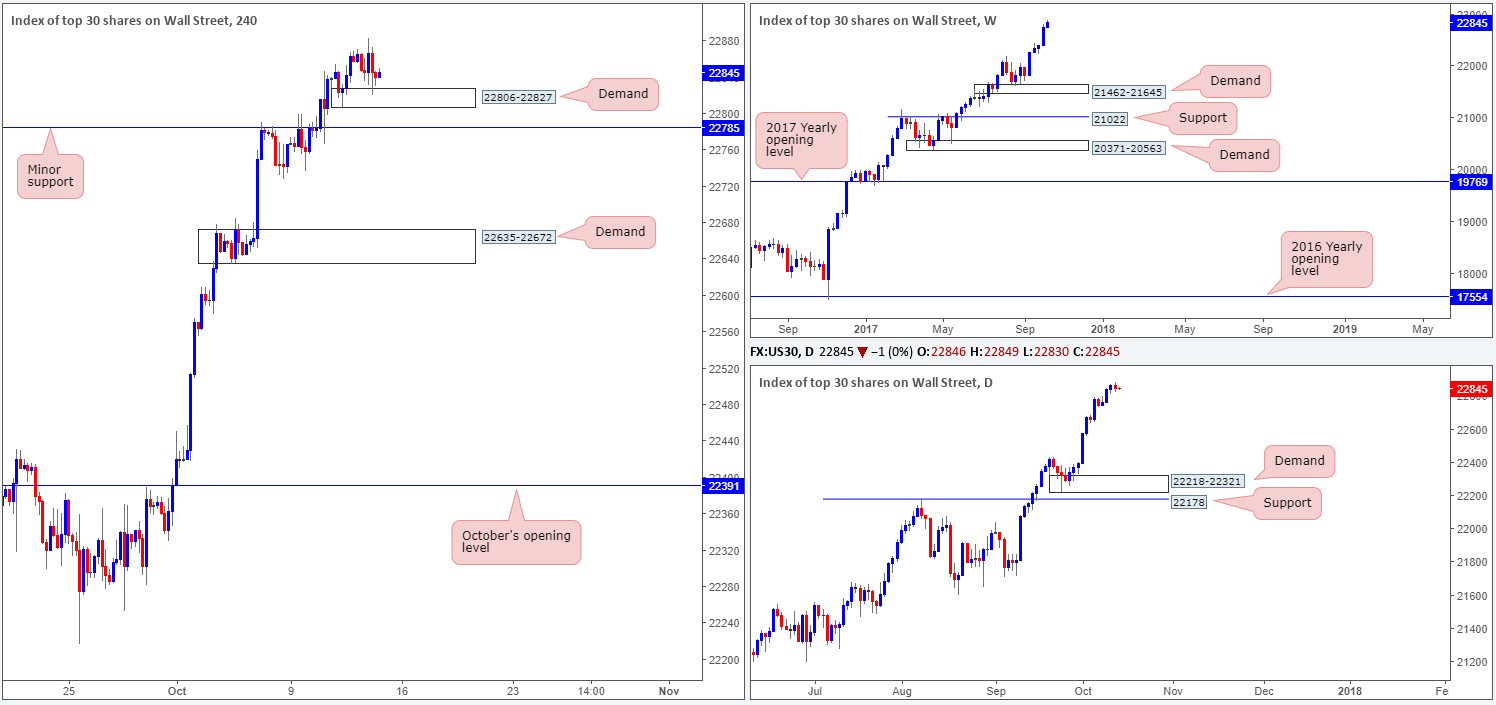
Breaking a three-day bullish phase, US equities turned marginally lower on Thursday. The DJIA, as you can see on the H4 timeframe, found active buyers at the newly-formed demand drawn from 22806-22827. Owing to the strong uptrend this market is in right now, the noted H4 area could help provide a floor to buy from today.
Suggestions: Watch for H4 price to form a full or near-full-bodied bull candle around the aforementioned H4 demand area. This will, of course, not guarantee you a winning trade, but what it will do is show buyer intent and therefore increases the odds of price moving in your favor.
Data points to consider: US Inflation and retail sales figures m/m at 1.30pm; US Prelim UoM consumer sentiment at 3pm; FOMC member Evans speaks at 3.25pm; FOMC member Kaplan speaks at 4.30pm GMT+1.
Levels to watch/live orders:
- Buys: 22806-22827 region ([waiting for a reasonably sized H4 bullish candle to form – preferably a full, or near-full-bodied candle – is advised] stop loss: ideally beyond the candle’s tail).
- Sells: Flat (stop loss: N/A).
GOLD:
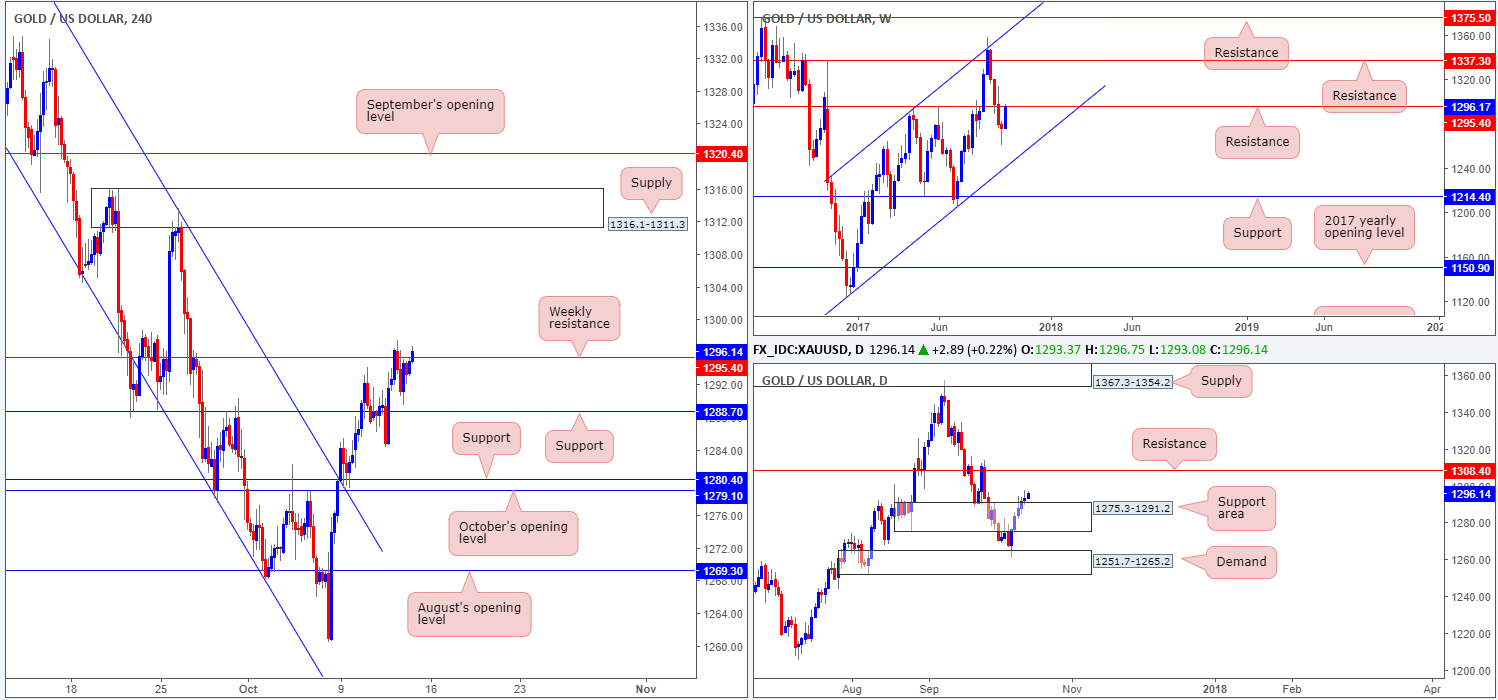
In recent dealings, the price of gold crossed swords with weekly resistance at 1295.4. Viewing the action from the H4 timeframe, it’s relatively clear to see that the sellers appear to be lacking oomph here. This could have something to do with daily flow recently crossing above a resistance area at 1275.3-1291.2 (now acting support zone) and opening up the path north to resistance at 1308.4. In addition to this, we also see that there’s little support seen on the USDX H4 chart till the 92.66 neighborhood (a move lower on the dollar could translate to higher prices on gold).
A decisive push beyond the current weekly resistance could, according to H4 technicals, lead to the metal approaching supply pegged at 1316.1-1311.3. But, is this a move worthy of a buy? Well, looking at it from a daily perspective, it is. However, from the weekly timeframe, a long directly above a weekly resistance is, for lack of a better word, a daredevil trade! The reason being is that it is impossible, even with daily and H4 price indicating further buying may be ahead, to know whether weekly sellers are consumed.
Suggestions: Personally, given the overall picture, we feel this market is best left on the back burner for now.
Levels to watch/live orders:
- Buys: Flat (stop loss: N/A).
- Sells: Flat (stop loss: N/A).