Friday 13th May: Heavy action expected on the U.S. dollar around midday today.
A note on lower timeframe confirming price action…
Waiting for lower timeframe confirmation is our main tool to confirm strength within higher timeframe zones, and has really been the key to our trading success. It takes a little time to understand the subtle nuances, however, as each trade is never the same, but once you master the rhythm so to speak, you will be saved from countless unnecessary losing trades. The following is a list of what we look for:
- A break/retest of supply or demand dependent on which way you’re trading.
- A trendline break/retest.
- Buying/selling tails/wicks – essentially we look for a cluster of very obvious spikes off of lower timeframe support and resistance levels within the higher timeframe zone.
- Candlestick patterns. We tend to only stick with pin bars and engulfing bars as these have proven to be the most effective.
We search for lower timeframe confirmation between the M15 the H1 timeframes, since most of our higher timeframe areas begin with the H4 right up to the weekly chart. Stops usually placed 5-10 pips beyond your confirming structures.
EUR/USD:
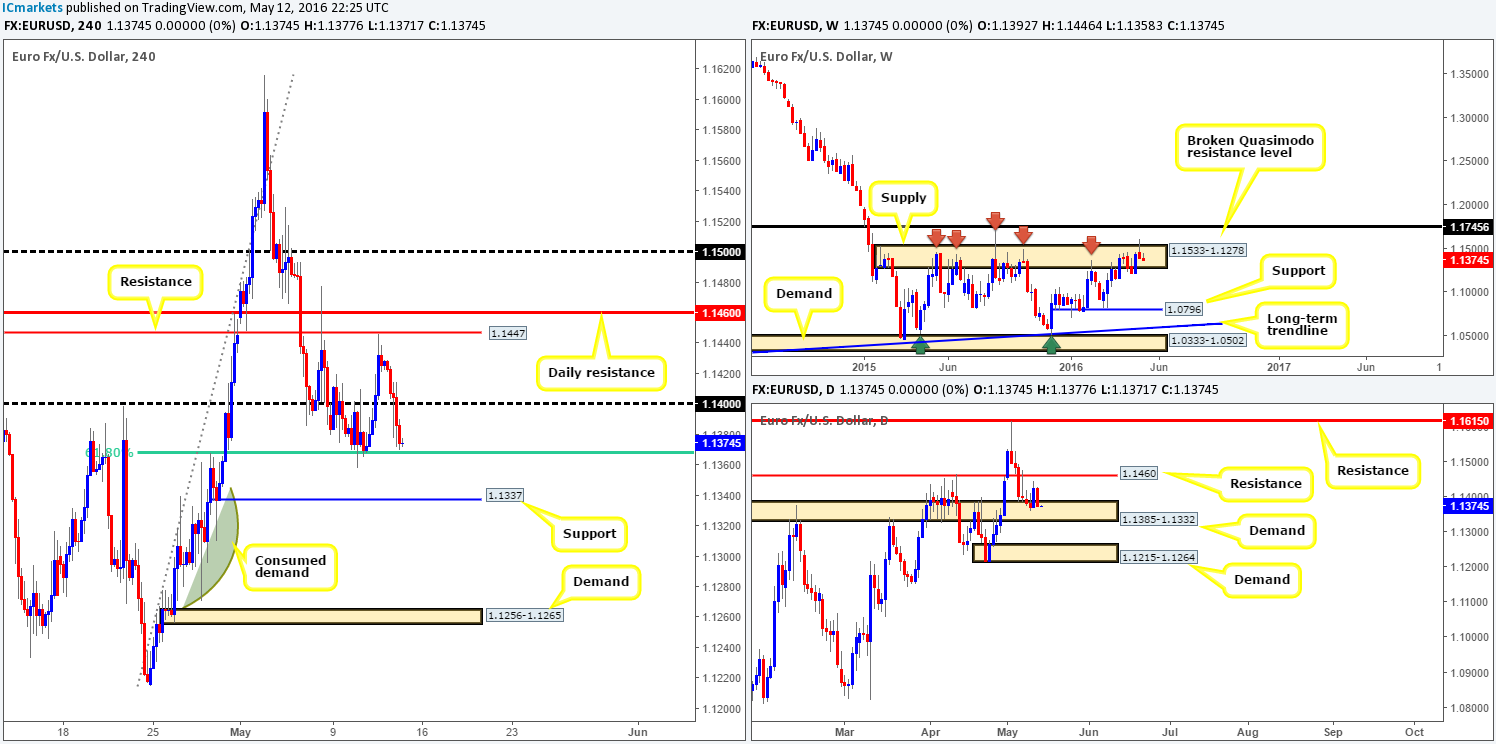
Ok, taking it from the top this morning, we can see that weekly action has yet to register anything concrete following last week’s bearish selling wick seen within the weekly supply zone at 1.1533-1.1278. What we will say, however, is this area has managed to hold the single currency lower since May 2015, so the bulls will likely have their work cut out for them if they wish to push higher. Looking down to the daily picture, the EUR is seen trading within daily demand coming in at 1.1385-1.1332. Wednesday’s response from here was, as you can see, bullish, engulfing three prior daily bear candle bodies! Nevertheless, yesterday’s candle clawed back these gains and slammed the market right back where it started – the daily demand base!
Moving over to the H4 chart, the EUR, as anticipated, sold-off during the course of yesterday’s sessions. Price found some support around the 1.14 handle (likely due to high U.S. unemployment figures coming out), but was unable to stop the pair from driving down to lows of 1.1370 on the day.
In that price is now trading around Tuesday’s support formed from a 61.8% H4 Fibonacci line at 1.1368, would we consider a buy from here? In short, no. Granted, we are in daily demand, but let’s not forget that we’re also trading from weekly supply (see above) and have the 1.14 handle lurking just above as a potential area for strong offers to be hiding. Ultimately, we still feel this pair want’s to drive lower, so does that mean we look for a sell beyond the H4 Fibonacci support? Not for us since there’s H4 support just below at 1.1337. Where we would consider going short, nevertheless, is on the break below and (confirmed) retest of this H4 support. Here’s why:
- 1.1337 marks the lower edge of the current daily demand, so a break below this H4 support would also mean a break below the daily zone.
- Between 1.1337 and the H4 demand seen at 1.1256-1.1265, we see very little active demand. Also take note that this H4 demand sits within the confines of daily demand chalked in at 1.1215-1.1264, which is the next downside target on the daily timeframe!
In regard to looking for lower timeframe confirmation (as we mentioned before) it could be in the form of either an engulf of demand and subsequent retest, a break/retest of a trendline or simply a collection of selling wicks around a lower-timeframe resistance hurdle. Also one final point to consider is that we have core U.S. retail sales and PPI data due to be released later on – do take care during those times as technicals may likely take a back seat!
Levels to watch/live orders:
- Buys: Flat (Stop loss: N/A).
- Sells: Watch for price to close below 1.1337 and look to trade any retest seen thereafter (lower timeframe confirmation required).
GBP/USD:
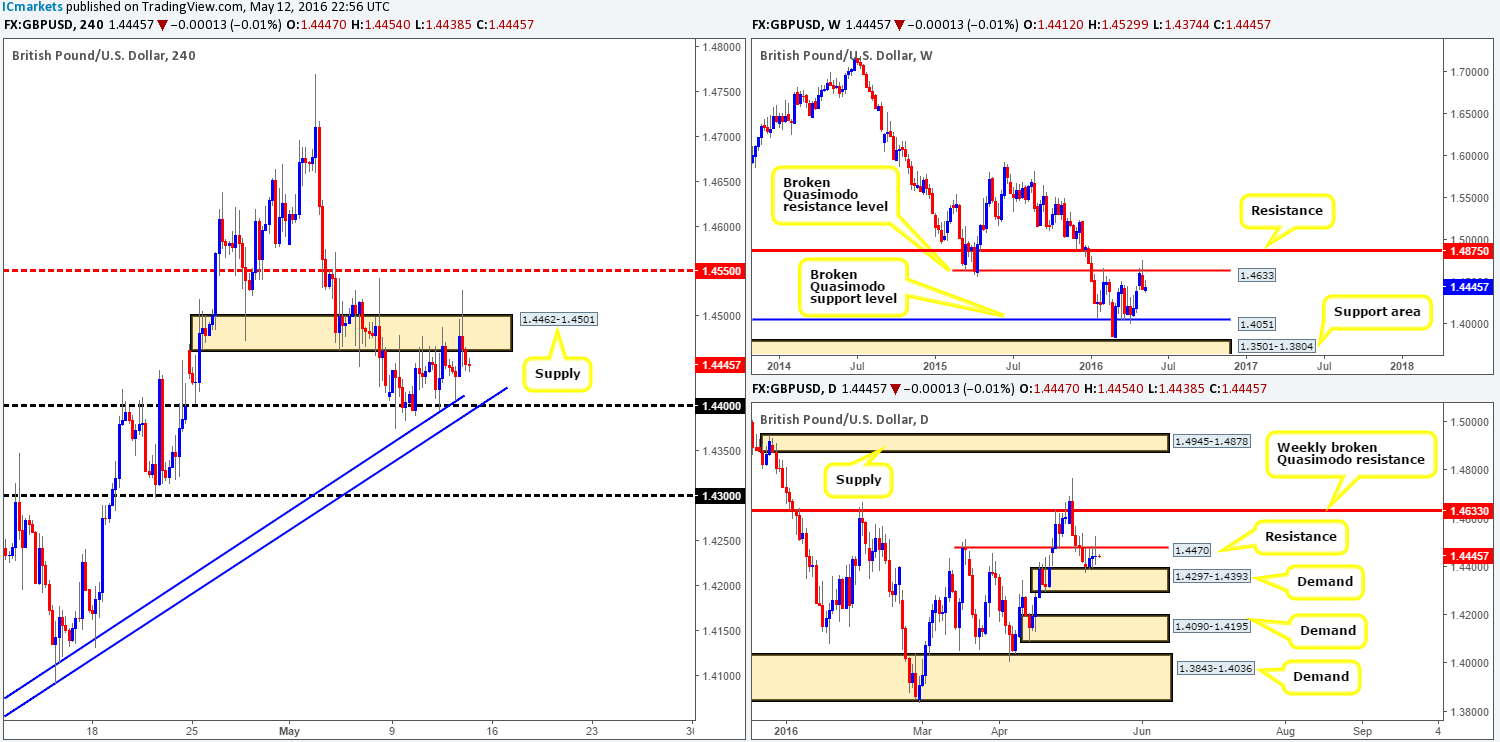
Going into yesterday’s American session (London afternoon session) sterling rose to highs of 1.4529 but failed to sustain these gains before collapsing to lows of 1.4439 by the day’s end. Despite BoE comments, price remains consolidating between H4 supply at 1.4462-1.4501 and the psychological support line at 1.44. Consequent to this, much of the following report will echo similar thoughts put forward in our previous analysis…
Technicals over on the weekly chart indicate further selling could be on the cards. Last week’s bearish engulfing candle seen off the back of a broken weekly Quasimodo resistance line at 1.4633 shows price may be heading down towards support at 1.4051 – another broken weekly Quasimodo line. Daily action on the other hand, continues to sandwich itself between daily demand chalked up at 1.4297-1.4393 and daily resistance drawn from 1.4470.
In light of the above information, a break above the current H4 supply will be treated cautiously due to price trading from weekly resistance (see above), whilst a close below 1.44 could be an important bearish cue. If the pound closes below 1.44 and retests the underside of this barrier as resistance, selling this market down to the 1.43 hurdle could be something to consider. Granted, by doing so you’d effectively be shorting into daily demand, but let’s not forget that supporting this trade is both the daily and weekly resistances, as well as the large weekly bearish engulfing candle (see above). To be on the safe side though, we would recommend only pulling the trigger here should one be able to spot a nice-looking lower timeframe sell setup (for confirmation techniques, please see the top of this report) following the retest of 1.44, since fakeouts are common around fixed psychological numbers such as these!
Levels to watch/live orders:
- Buys: Flat (Stop loss: N/A).
- Sells: Watch for price to close below 1.44 and look to trade any retest seen thereafter (lower timeframe confirmation required).
AUD/USD:
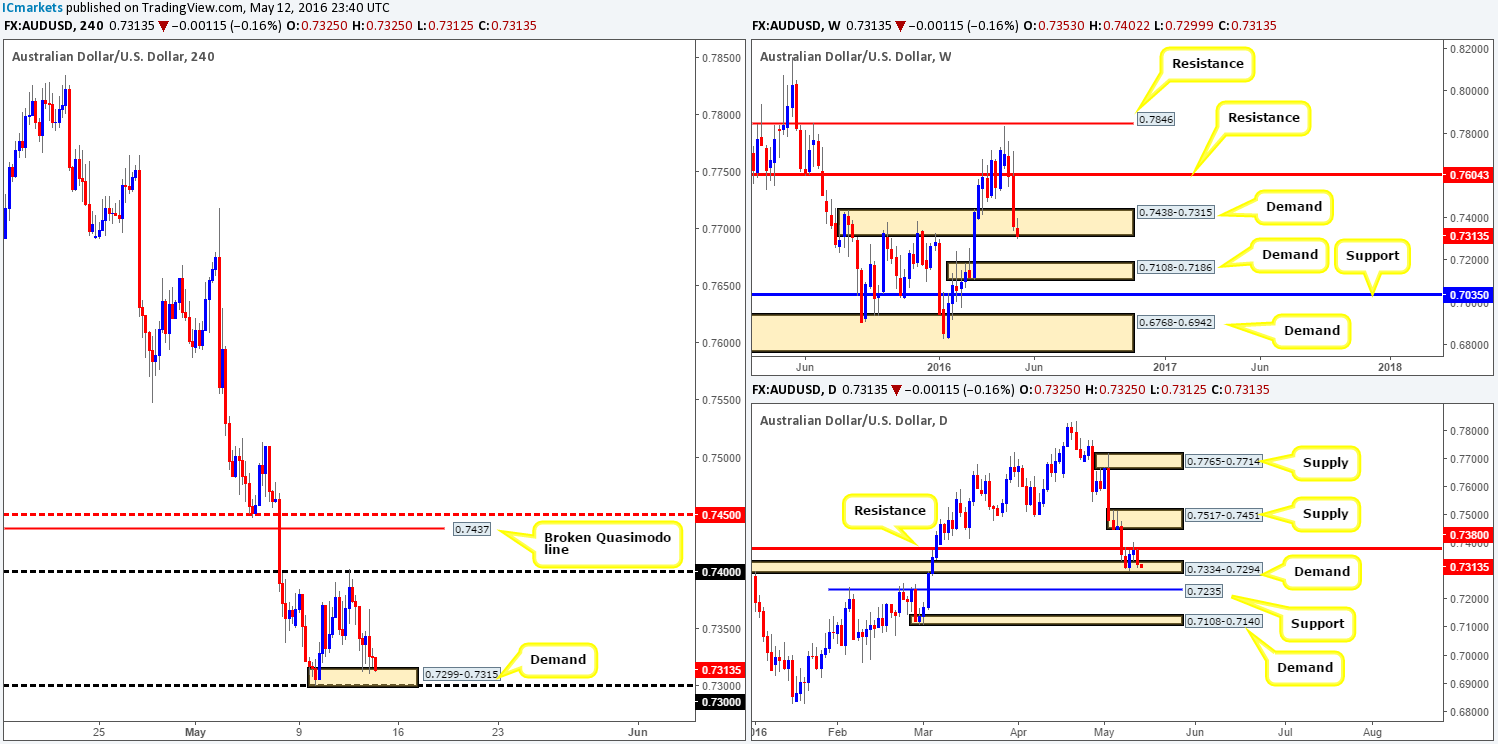
During the early hours of yesterday morning the commodity currency sold-off, quickly bringing price down into the jaws of a H4 demand zone coming in at 0.7299-0.7315. As can be seen on the H4 chart, price tested this area multiple times throughout the day, and was unable to close lower or produce any meaningful advance.
So, where does this leave us? Well, up on the weekly chart, demand at 0.7438-0.7315 appears to really be struggling to hold at the moment. However, before one can say that this zone has had its day, we feel it may be best to wait and see where the weekly candle closes for the week. Daily resistance at 0.7380 may have something to do with the bullish weakness we’re seeing up on the weekly chart at the moment. Check out yesterday’s bearish response from this line on the daily chart, as it managed to push the bulls back into a small area of daily demand at 0.7334-0.7294, which has already been tested once this week already!
To answer the question above in bold, buying from the current H4 demand is risky in our opinion. Going against daily selling from the aforementioned daily resistance, and with little bullish meaning yet to be registered at the above said weekly demand is not really what we would consider ideal buying conditions. A close below the H4 demand, however, could open the path down to H4 support at 0.7241. A H4 close lower would likely clear daily demand, and also confirm weekly bulls have thrown in the towel. Therefore, a close below the H4 demand followed by a (confirmed) retest as supply could be something to watch out for today (for confirmation techniques, please see the top of this report).
Levels to watch/live orders:
- Buys: Flat (Stop loss: N/A).
- Sells: Watch for price to close below 0.7299-0.7315 and look to trade any retest seen thereafter (lower timeframe confirmation required).
USD/JPY:
Following Wednesday’s reaction from the H4 demand zone at 108.27-108.44, yesterday’s trading saw the USD/JPY extend its bounce from here up to H4 supply coming in at 109.26-109.49. Aided by an increase in U.S. jobless claims, the pair then fell from here down to lows of 108.62 on the day.
Despite this unit now lurking around both H4 supply and a daily supply drawn from 109.26-109.83, our team has no interest in selling. The reasoning behind this approach stems from the weekly chart. Check out how aggressive the weekly bulls have been since rebounding from weekly demand at 105.19-107.54. Furthermore, notice that there’s ample space on this timeframe for price to continue driving north until weekly supply at 113.80-111.59. To that end, what we’re watching for at the moment is a close above the 110 handle. This would, as far as we see it, achieve the following:
- Open the H4 path north up to H4 resistance at 110.84.
- Push price above the current daily supply at 109.26-109.83 and potentially clear the runway up to daily resistance at 110.96 – a few pips above the H4 line 110.84.
In addition to these two points it would also allow traders the chance to enter long on any retest seen of 110 as per the green arrows. For us to be given the green light to buy, nonetheless, we would require a lower timeframe buy setup to form following the retest of 110. This could be in the form of an engulf of supply, a trendline break/retest or even simply a collection of buying tails around the 110 number. Of course, this trade may not come to fruition today, but we believe it is certainly something to have noted down in your watch lists for next week!

Levels to watch/live orders:
- Buys: Watch for price to close above 110 and look to trade any retest seen thereafter (lower timeframe confirmation required).
- Sells: Flat (Stop loss: N/A).
USD/CAD:
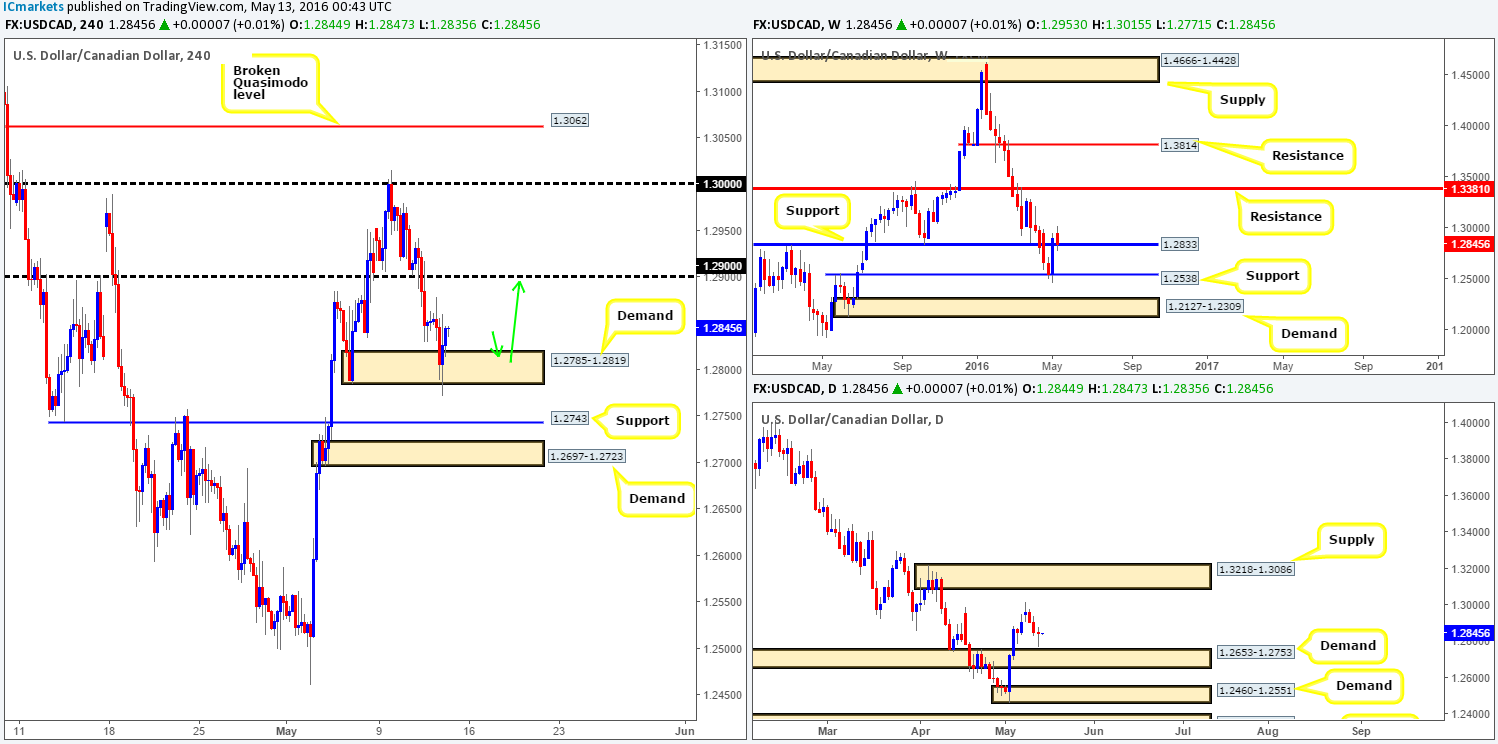
Reporting directly from the weekly chart this morning, one can see that weekly support at 1.2833 continues to hold steady. Moving down to the daily chart, price came within twenty pips of connecting with daily demand at 1.2653-1.2753 yesterday, before rallying higher and forming a relatively nice-looking buying tail. What this buying tail did over on the H4 chart, however, was whipsaw through H4 demand at 1.2785-1.2819, likely stopping out a truckload of traders in the process.
In light of the above points, what direction do we see the Loonie heading today? With oil now trading from daily supply at 48.33-46.53 and the USD/CAD trading from weekly support at 1.2833, as well as from just above daily demand at 1.2653-1.2753, this pair is likely heading higher. An ideal buy entry for us would be on a retest of the current H4 demand, targeting the 1.29 handle as per the green arrows. Assuming that we manage to pin down a lower timeframe buy entry within this H4 area today (for confirmation techniques, please see the top of this report), our final take-profit target would be somewhere around the broken H4 Quasimodo line seen at 1.3062 which lurks twenty or so pips below daily supply at 1.3218-1.3086.
Levels to watch/live orders:
- Buys: 1.2785-1.2819 [Tentative – confirmation required] (Stop loss: dependent on where one confirms this area).
- Sells: Flat (Stop loss: N/A).
USD/CHF:
(Slight change in structure)
Beginning with a quick look at the weekly chart, resistance at 0.9760 was recently brought into the action and is currently holding this market lower. On the assumption that the bulls weaken here, we could see the Swissy drive down to weekly support at 0.9508. Climbing down into the pits of the daily chart, nevertheless, price is seen trading mid-range between daily supply at 0.9787-0.9755 and daily demand coming in at 0.9584-0.9640. Seeing as how the daily supply converges with weekly resistance at 0.9760, more weight is given to this zone.
Looking across to the H4 chart, the pair is now trading around the underside of a H4 supply zone penciled in at 0.9725-0.9711. Given that price recently rebounded from weekly resistance, a short from this H4 supply could be something to consider. However, there are two other possibilities seen directly above this zone. The first is a H4 Quasimodo resistance line at 0.9735, the second a H4 supply seen at 0.9762-0.9751. One would, of course, need a crystal ball to know which of these zones will react, if at all. Therefore, the best our team can do is watch how each zone responds to lower timeframe price action (essentially looking for confirmation). If a sell setup is seen at either H4 zone, we’ll take the short ultimately targeting 0.9652 – a H4 support that sits just above daily demand at 0.9584-0.9640. Again, for confirmation techniques please see the top of this report.
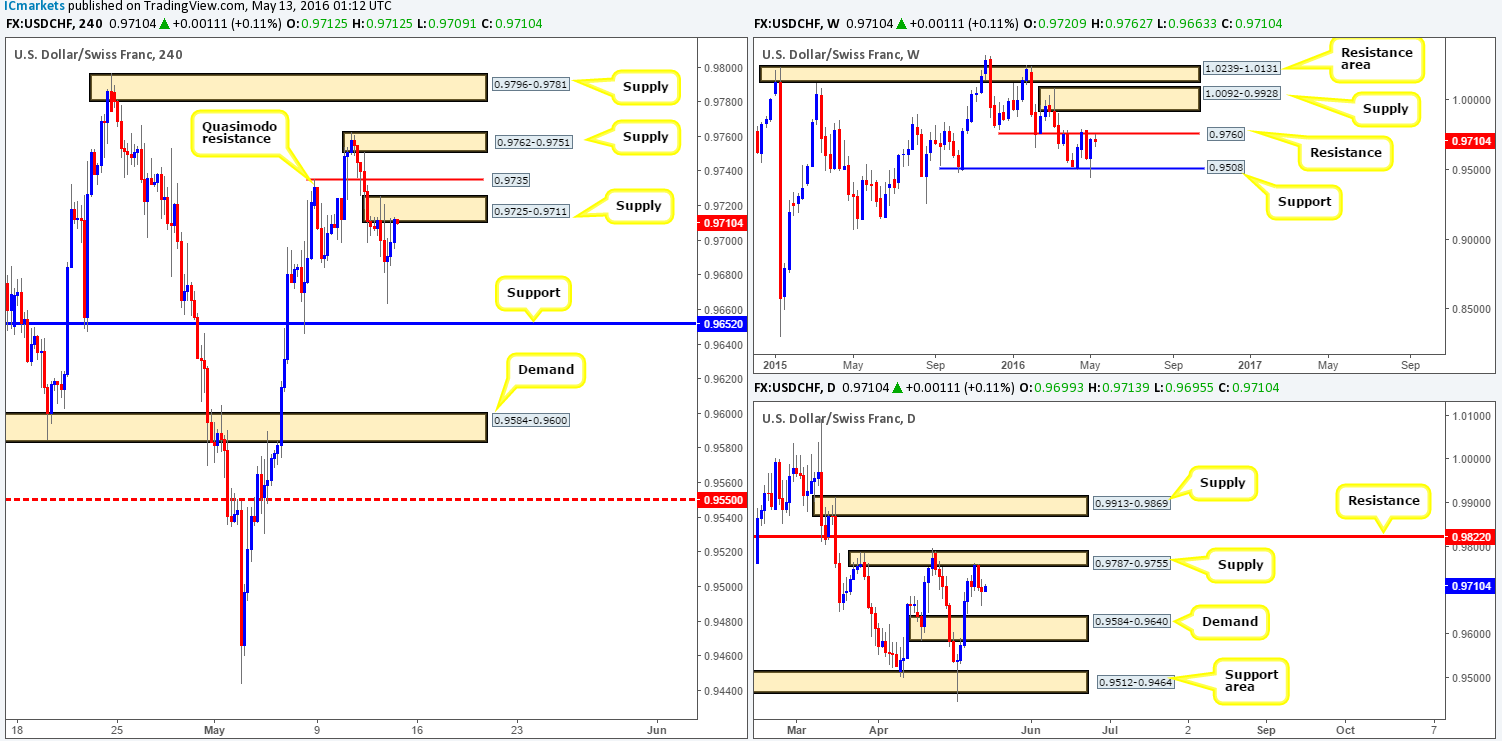
Levels to watch/live orders:
- Buys: Flat (Stop loss: N/A).
- Sells: 0.9725-0.9711 [Tentative – confirmation required] (Stop loss: dependent on where one confirms this area). 0.9735 region [Tentative – confirmation required] (Stop loss: dependent on where one confirms this area). 0.9762-0.9751 [Tentative – confirmation required] (Stop loss: dependent on where one confirms this area).
DOW 30:
In recent trading, we can see that the DOW struck a H4 resistance coming in at 17789 which shortly after saw a rather violent sell-off to lows of 17622. To keep this analysis on point we’re going to dive right in and show the area that we’re currently watching…
- The H4 Quasimodo support at 17606 which ties in perfectly with weekly support.
- A H4 demand at 17575 that is positioned around twenty points above daily demand at 17396-17554.
These two H4 levels seen highlighted with a yellow zone (17575/17606), coupled with H4 price forming a relatively nice-looking AB=CD approach (green arrows) forms a very interesting buy zone to keep an eyeball on today. Due to the AB=CD pattern extending slightly beyond our buy zone to around the 17563 region, however, and the daily demand at 17396-17554 (as we mentioned above) sitting twenty or so points below, lower timeframe buying confirmation is necessary before we commit capital to this idea. To see how we look for lower timeframe confirmation, please see the the top of this report.
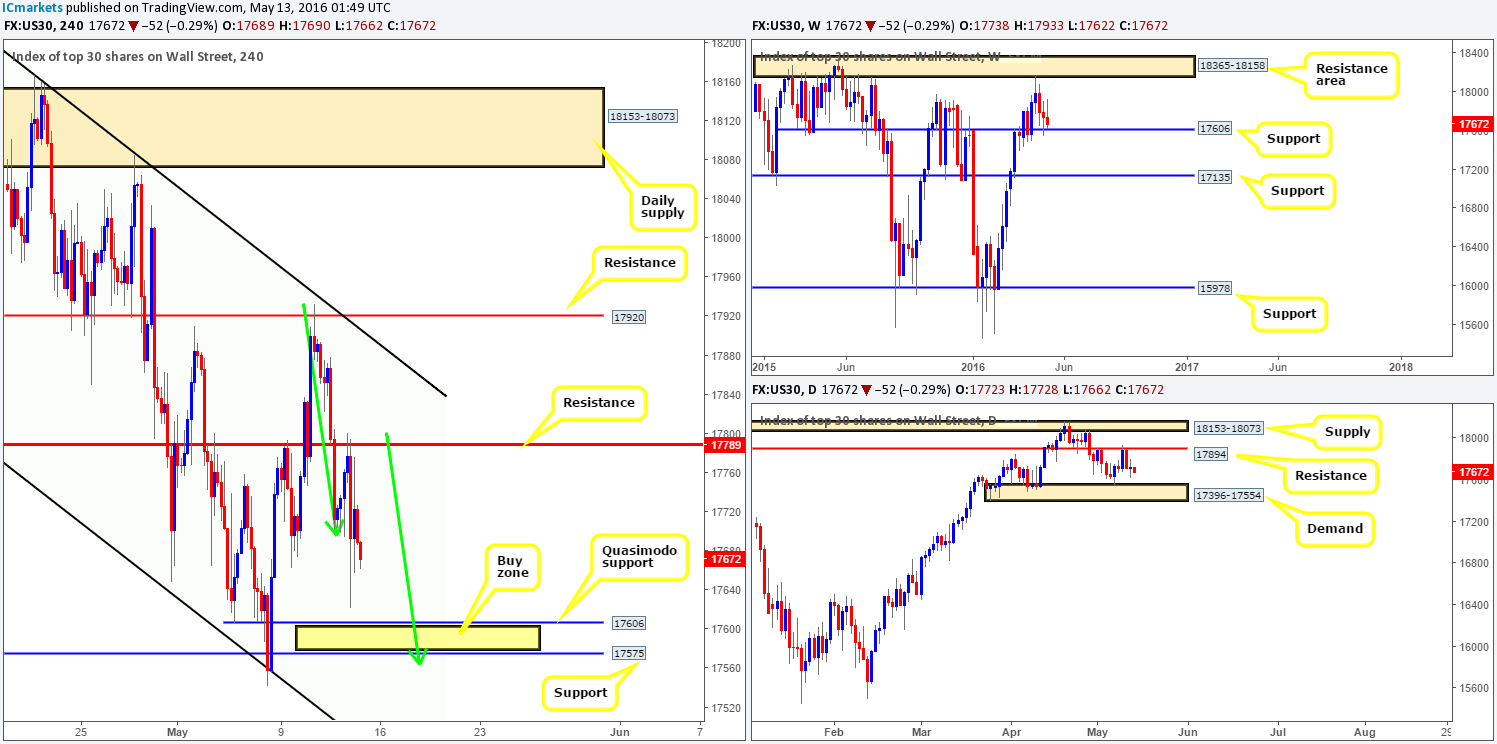
Levels to watch/live orders:
- Buys: 17575/17606 [Tentative – confirmation required] (Stop loss: dependent on where one confirms this area).
- Sells: Flat (Stop loss: N/A).
GOLD:
Starting from the weekly chart this morning, gold continues to reflect bearish intentions from weekly supply logged in at 1307.4-1280.0. On the other side of the field, daily action is seen trading from within daily demand penciled in at 1270.8-1257.5. Be that as it may, given yesterday’s daily bearish engulfing candle, this demand is very likely on shaky ground. The next area to keep an eye on beyond this demand falls in at 1223.7-1233.3 – another daily demand which has already held price once already back on the 22nd April.
Stepping across the pond to the H4 chart, support at 1269.6 (now acting resistance) was taken out during yesterday’s sell-off, potentially clearing the rubble south for price to challenge H4 demand at 1252.9-1256.8. In view of the higher-timeframe picture (see above), our team is going to be looking for shorting opportunities around the current H4 resistance line today. Should this trade idea come to fruition, bullion could potentially drive beyond the first take-profit target (1252.9-1256.8) and hit H4 demand at 1237.5-1243.9, which sits just above daily demand at 1223.7-1233.3.
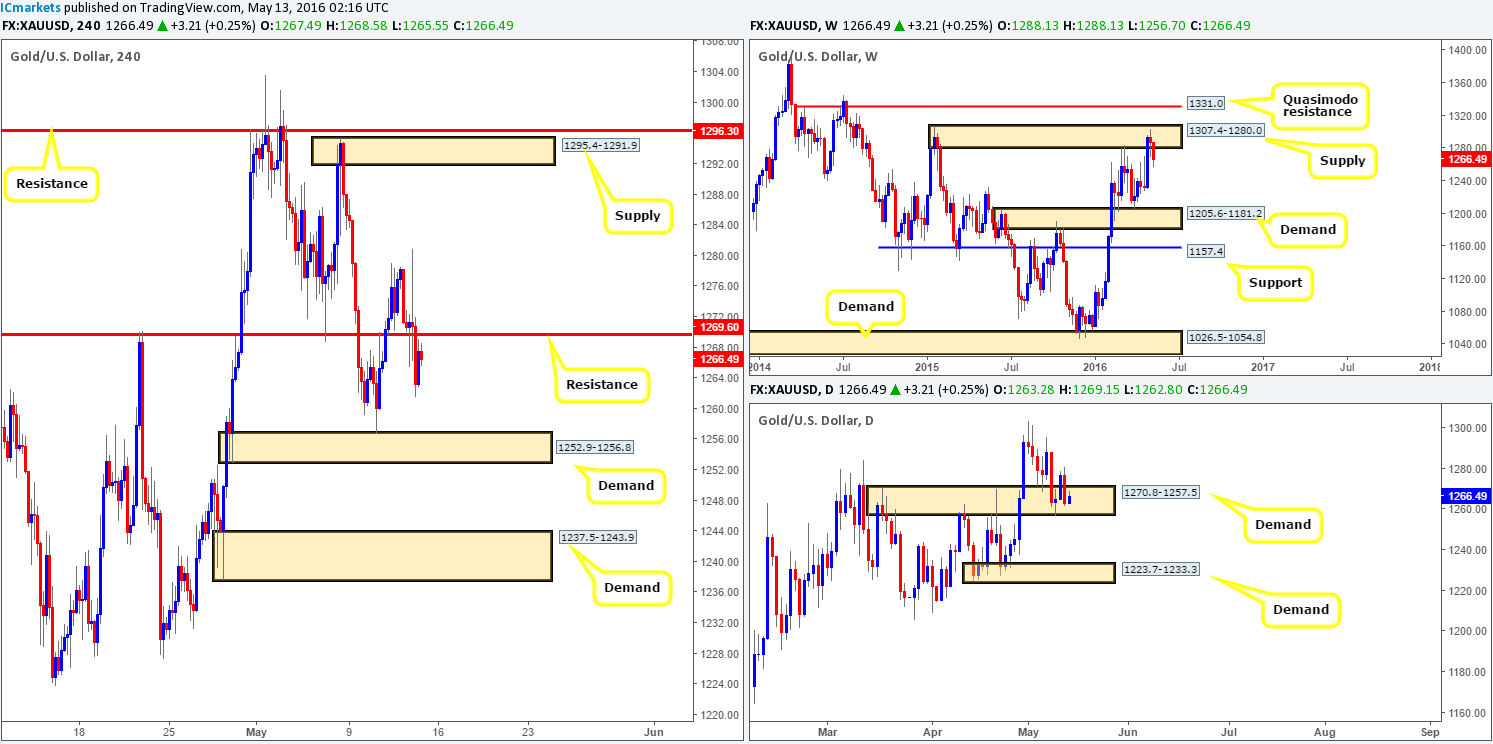
Levels to watch/live orders:
- Buys: Flat (Stop loss: N/A).
- Sells: 1269.6 region [Tentative – confirmation required] (Stop loss: dependent on where one confirms this area).


