EUR/USD:
The euro rotated lower in relatively strong fashion on Thursday, consequently breaking a four-day bullish phase. Pressured lower on comments from ECB’s Coeure regarding current monetary policy and a disappointing EU industrial production print, the EUR/USD concluded the day surpassing April’s opening level on the H4 timeframe at 1.2320 and revisiting the 1.23 handle. In the event that buyers remain positive above April’s opening level today, the next upside objective can be seen in the shape of a H4 trend line resistance etched from the high 1.2476. A push below 1.23, on the other hand, will likely see price action target a nearby H4 demand plotted at 1.2260-1.2277.
Turning the attention over to the daily timeframe, the pair, as far as we can see, is currently trading in no man’s land amid a daily Quasimodo resistance at 1.2446 and a well-established daily support zone at 1.2246-1.2164. Overhead on the weekly timeframe, nevertheless, the unit remains captive within the walls of a major-league weekly supply at 1.2569-1.2287.
Potential trading zones:
According to higher-timeframe structure, the euro’s uptrend which began early 2017 is currently capped by weekly supply. As a result, medium/long-term positions are restricted at this time.
Short-term movements, however, may see the H4 candles establish support off of April’s opening level at 1.2320 this morning, targeting the aforementioned H4 trend line resistance. We must point out, though, that this level holds limited confluence in terms of structure and would be considered a low-level trade setup.
Data points to consider today: US prelim UoM consumer sentiment.

GBP/USD:
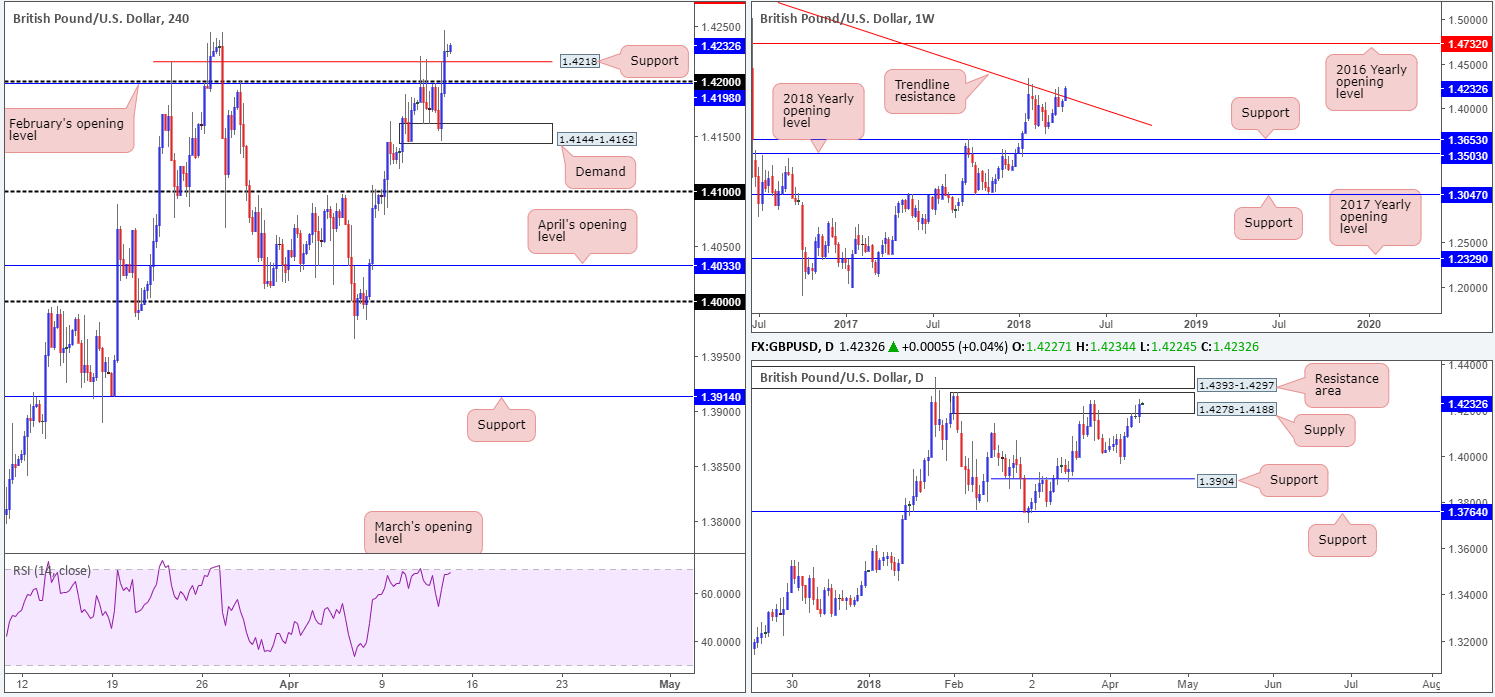
Despite USD strength, Thursday’s movement witnessed the British pound gain momentum to the upside. The pair bounced sharply after challenging a H4 demand area positioned at 1.4144-1.4162, consequently taking out 1.42 and nearby H4 resistance plotted at 1.4218.
What yesterday’s advance also accomplished was lifting daily action into the walls of a daily supply zone at 1.4278-1.4188. Traders might also want to note that this area is positioned directly beneath a daily resistance area at 1.4393-1.4297. In addition to this, weekly price is on track to close above a long-term weekly trend line resistance taken from the high 1.5930. Do bear in mind that this line has not witnessed a close higher since late 2015! In the event that this occurs, the next upside target can be seen at 1.4732: the 2018 yearly opening level.
Potential trading zones:
Should H4 support at 1.4218 hold firm today, this could be considered a sign of bullish intent. A move higher from this point may, from an intraday perspective, look to test H4 resistance at 1.4278. However, buying this market is challenging given daily structure lurking overhead!
Technically speaking, we feel this market may be best left on the back burner today. Buying into daily supply, no matter what weekly or H4 structure is suggesting, is just too much of a risk, in our humble view. There are likely far better opportunities elsewhere.
Data points to consider today: US prelim UoM consumer sentiment.
AUD/USD:
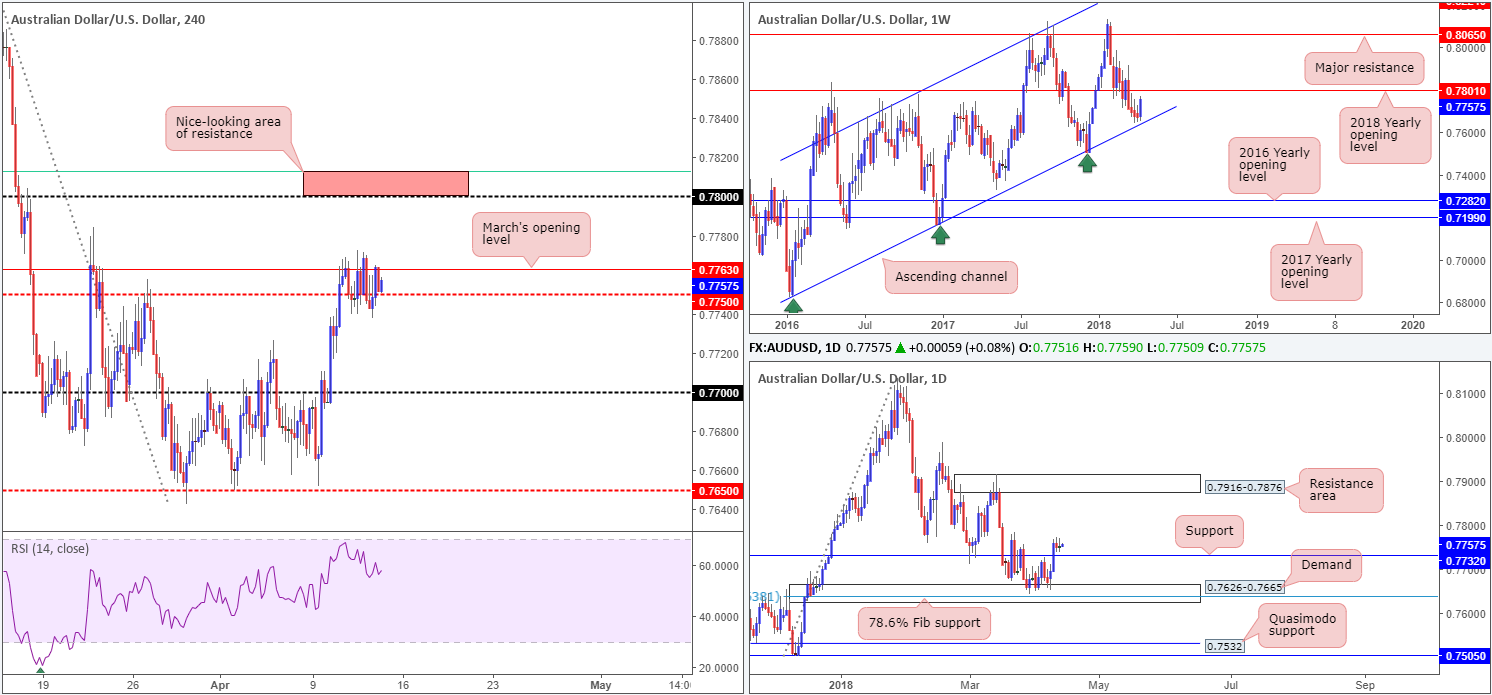
As of late, the AUD/USD has found little reason to move. The pair hesitated for a second consecutive day’s trade, remaining within a tight consolidation between March’s opening level at 0.7763 seen on the H4 timeframe and a H4 mid-level support at 0.7750. With RBA’s financial stability review and Chinese trade data just around the corner, though, this could drastically alter current price action.
In terms of the team’s outlook, our bias remains unchanged. Beyond 0.7763 there’s a reasonably clear path north to the 0.78 handle, which is not only positioned nearby a 61.8% H4 Fib resistance at 0.7813 (green line), it also represents the 2018 yearly opening level found on the weekly timeframe at 0.7801.
Potential trading zones:
0.7813/0.78 (marked in red) remains of interest for shorts this morning.
As 0.7813/0.78 is a relatively small zone, a fakeout through this area is possible. To help avoid getting snagged, consider waiting for H4 price to stabilize around the zone before pulling the trigger. Ideally, a H4 full or near-full-bodied bearish candle would be best. As for take-profit targets, the next logical zone, as of current price, is March’s opening level mentioned above at 0.7763.
Data points to consider today: RBA’s financial stability review; Chinese trade data; US prelim UoM consumer sentiment.
USD/JPY:
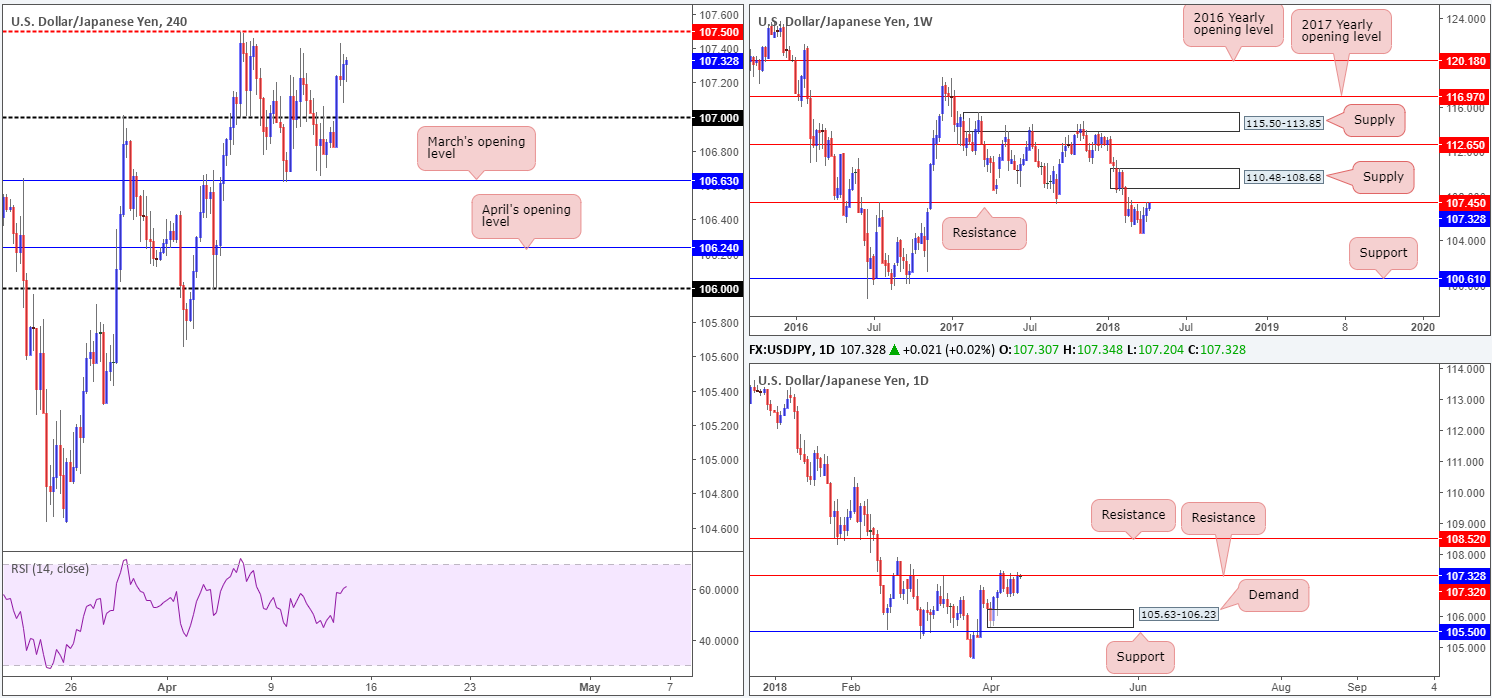
The US dollar advanced against its Japanese counterpart on Thursday, boosted by US President Trump’s tweets which put Syrian tensions to ease. H4 action cleared orders around the 107 handle and managed to find a top just south of a H4 mid-level resistance at 107.50. Also seen in play is daily resistance coming in at 107.32, followed closely by weekly resistance at 107.45. Both levels boast reasonably sound history.
Weekly price shows potential to push as far south as weekly support plotted at 100.61, while daily action has priced in its next downside target at 105.63-106.23: a daily demand area that’s sited just north of a daily support at 105.50.
Potential trading zones:
As both weekly and daily charts suggest further selling is in store, selling the market on the H4 timeframe could be possible from 107.50. Given the H4 trend is pointing in a northerly direction, though, we would adopt a cautious approach. Waiting for H4 price to print a full or near-full-bodied bearish candle off of 107.50 is one alternative, targeting the 107 handle as the initial take-profit zone.
Data points to consider today: US prelim UoM consumer sentiment.
USD/CAD:
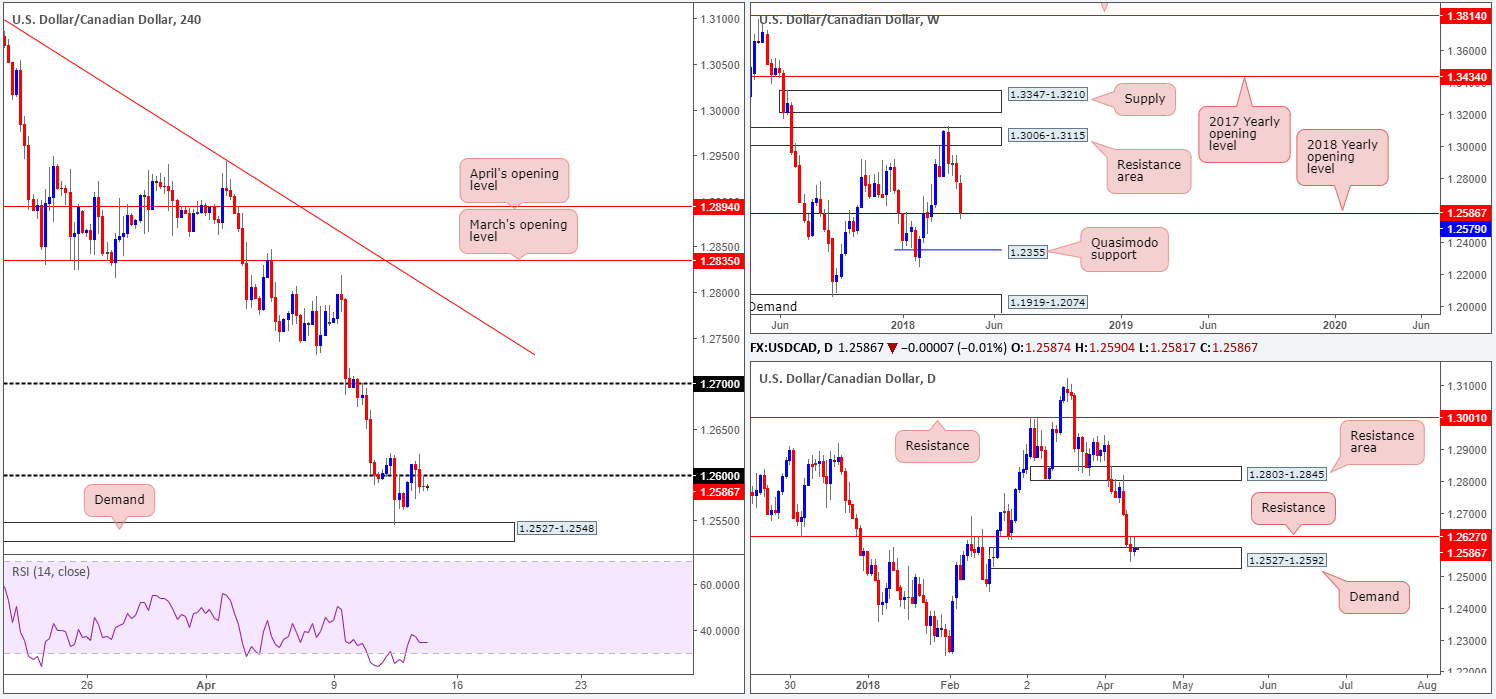
Coming in from the top this morning, recent movement has seen weekly price come into contact with the 2018 yearly opening level at 1.2579. A violation of this line could eventually see weekly action shake hands with a weekly Quasimodo support noted at 1.2355. Turning the focus down to the daily timeframe, we can see that the piece is seen trading from a daily demand zone at 1.2527-1.2592, but struggling to register bullish intent beyond nearby daily resistance at 1.2627.
Moving across to the H4 candles, H4 demand at 1.2527-1.2548, as you can see, remains in play. Subdued oil prices, weak Canadian NHPI data along with a stronger dollar, helped the USD/CAD market print marginal gains on Thursday.
Potential trading zones:
As price action is clearly finding 1.26 a troublesome barrier to overcome, along with clear interest being seen from daily resistance mentioned above at 1.2627, this is a difficult market to consider buying. Nevertheless, with the 2018 yearly opening level in play at 1.2579, there’s still a healthy chance that we may witness an upside move.
To confirm upside, however, we would want to see a DAILY close beyond the daily resistance level mentioned above at 1.2627. At that point, the next upside target on the H4 timeframe would sit at 1.27.
Data points to consider today: US prelim UoM consumer sentiment.
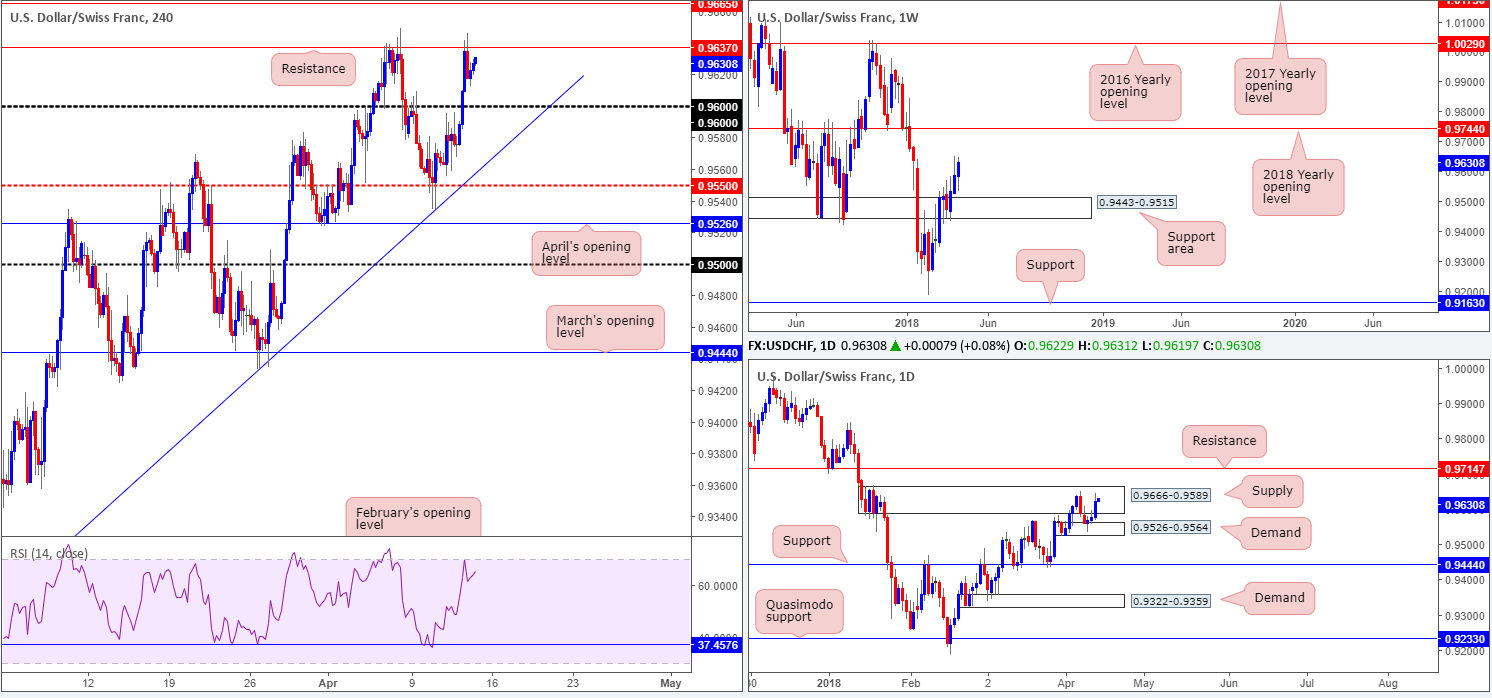
USD/CHF:
The USD gained momentum against the majority of its trading peers on Thursday, but found a top off of a key H4 resistance level at 0.9673 after reports of US airstrikes in Syria, consequently mildly paring gains into the close.
From a technical standpoint, the pair could potentially extend gains according to weekly price. After a push higher from a weekly support area at 0.9443-0.9515, the unit shows room to punch as far north as the 2018 yearly opening level at 0.9744. Upside on the daily timeframe, nevertheless, is restricted due to a daily supply zone seen at 0.9666-0.9589, followed by a nearby daily resistance level at 0.9714. Beyond the current H4 resistance, there is limited wiggle room on the H4 timeframe, with the next resistance seen at 0.9665.
Potential trading zones:
To our way of seeing things, this market is a tad cramped! Neither a long nor short seems attractive right now. Irrespective of the direction you select, you’ll be faced with notable opposing structure.
Data points to consider today: US prelim UoM consumer sentiment.
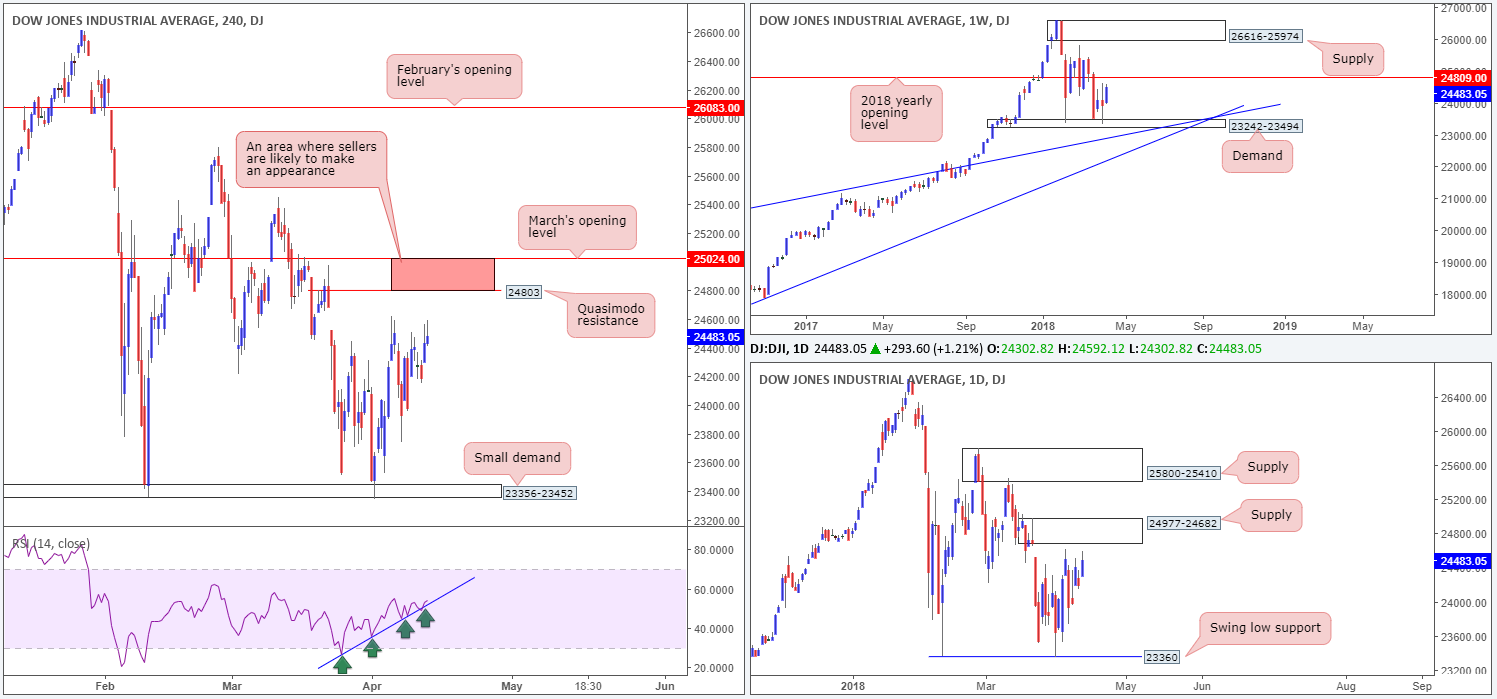
DOW 30:
US equities traded higher amid Thursday’s session, strengthened by US President Trump’s tweets which somewhat helped put Syrian tensions to ease. Although the index is on track to wrap up the week in the green, technical structure remains unchanged.
Weekly price is on course to challenge the 2018 yearly opening level at 24809. Daily movement is seen trading just beneath a daily supply zone coming in at 24977-24682, which happens to house the noted 2018 yearly opening level within. On the H4 timeframe, a H4 Quasimodo resistance at 24803 continues to station itself above current price, followed by March’s opening level at 25024.To the downside, we see a small H4 demand plotted within the current weekly demand at 23356-23452. It might also be worth noting that the H4 RSI trend line support remains intact.
Potential trading zones:
The area between March’s opening level at 25024 and the H4 Quasimodo resistance at 24803 remains of interest this morning (marked in red). Not only does the area house the 2018 yearly opening level mentioned above at 24809, it also has connections with the current daily supply zone. For this reason, selling could materialize from 25024/24803.
Data points to consider today: US prelim UoM consumer sentiment.
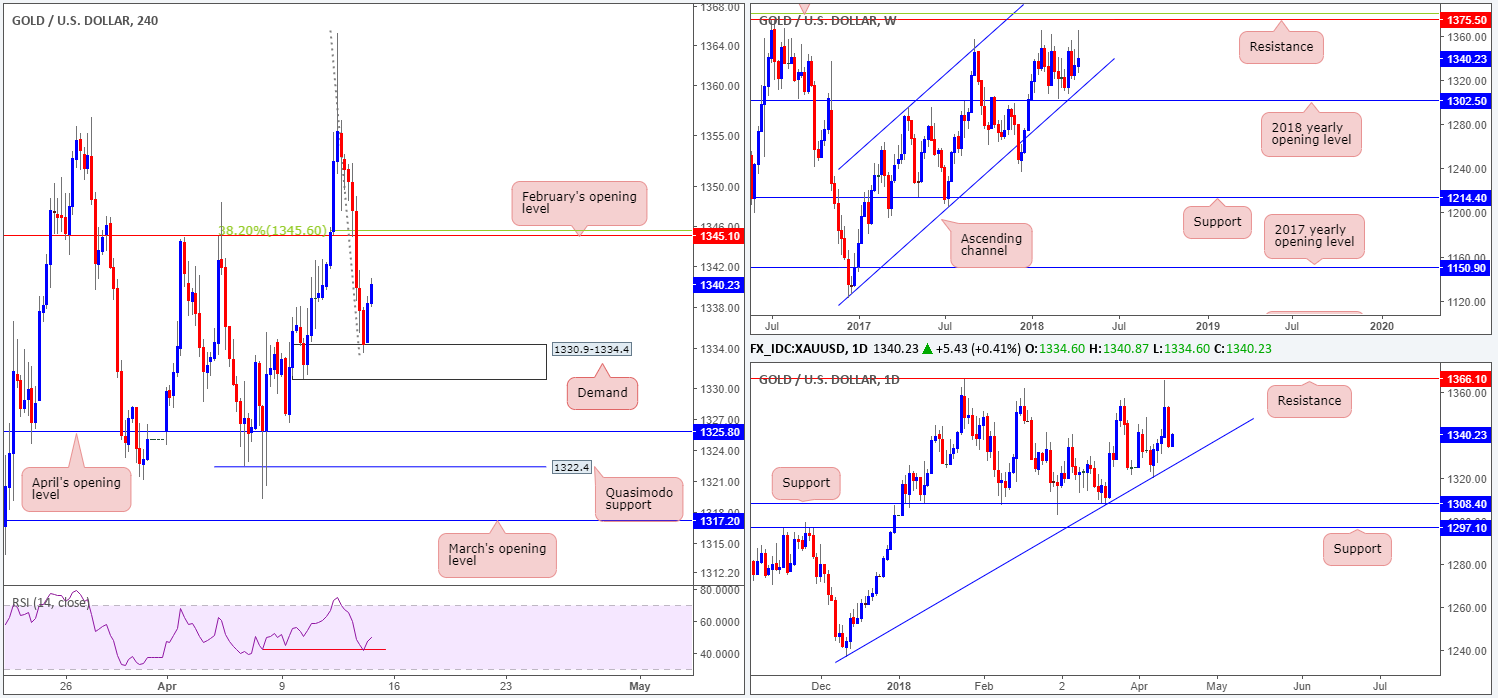
GOLD:
Although the yellow metal experienced a brief flicker of activity off February’s opening level seen on the H4 timeframe at 1345.1, Thursday’s price action continued to plunge lower. Largely influenced by USD strength, bullion dropped to shake hands with a H4 demand area at 1330.9-1334.4, which, as you can see, has so far held firm and boasts H4 RSI divergence. Beyond this area, however, we see April’s opening level at 1325.8, shadowed closely by a H4 Quasimodo support at 1322.4.
While H4 price looks poised to retest the underside of February’s opening level, daily action is seen lurking just north of a daily trend line support extended from the low 1236.6. The story on the weekly timeframe, nonetheless, places the yellow metal between the 2018 yearly opening level at 1302.5 (fuses closely with a long-term weekly channel support etched from the low 1122.8) and a weekly resistance pegged at 1375.5/38.2% weekly Fib resistance at 1381.0 (green line).
Potential trading zones:
Although the H4 demand is looking incredibly strong right now, we really like April’s opening level positioned just beneath it, due to it fusing nicely with the current daily trend line support. For those also expressing interest in trading this level, you’ll need to prepare for the possibility of a fakeout into the nearby H4 Quasimodo support mentioned above at 1322.4. Therefore, we would strongly recommend not using pending orders to enter. Rather, wait for H4 price to approach, and analyze the action to avoid getting stopped on a fakeout (a full or near-full-bodied H4 bull candle would be an ideal buy signal).
Intraday moves from the underside of February’s opening level are also possible today, seeing as it fuses closely with a 38.2% H4 Fib resistance at 1345.6. Similar to the setup posted above, though, waiting and seeing if H4 price can print a reasonably sized full or near-full-bodied bearish candle before pulling the trigger is advised.
This site has been designed for informational and educational purposes only and does not constitute an offer to sell nor a solicitation of an offer to buy any products which may be referenced upon the site. The services and information provided through this site are for personal, non-commercial, educational use and display. IC Markets does not provide personal trading advice through this site and does not represent that the products or services discussed are suitable for any trader. Traders are advised not to rely on any information contained in the site in the process of making a fully informed decision.
This site may include market analysis. All ideas, opinions, and/or forecasts, expressed or implied herein, information, charts or examples contained in the lessons, are for informational and educational purposes only and should not be construed as a recommendation to invest, trade, and/or speculate in the markets. Any trades, and/or speculations made in light of the ideas, opinions, and/or forecasts, expressed or implied herein, are committed at your own risk, financial or otherwise.
The use of the site is agreement that the site is for informational and educational purposes only and does not constitute advice in any form in the furtherance of any trade or trading decisions.
The accuracy, completeness and timeliness of the information contained on this site cannot be guaranteed. IC Markets does not warranty, guarantee or make any representations, or assume any liability with regard to financial results based on the use of the information in the site.
News, views, opinions, recommendations and other information obtained from sources outside of www.icmarkets.com.au, used in this site are believed to be reliable, but we cannot guarantee their accuracy or completeness. All such information is subject to change at any time without notice. IC Markets assumes no responsibility for the content of any linked site. The fact that such links may exist does not indicate approval or endorsement of any material contained on any linked site.
IC Markets is not liable for any harm caused by the transmission, through accessing the services or information on this site, of a computer virus, or other computer code or programming device that might be used to access, delete, damage, disable, disrupt or otherwise impede in any manner, the operation of the site or of any user’s software, hardware, data or property.


