Waiting for lower timeframe confirmation is our main tool to confirm strength within higher timeframe zones, and has really been the key to our trading success. It takes a little time to understand the subtle nuances, however, as each trade is never the same, but once you master the rhythm so to speak, you will be saved from countless unnecessary losing trades. The following is a list of what we look for:
- A break/retest of supply or demand dependent on which way you’re trading.
- A trendline break/retest.
- Buying/selling tails/wicks – essentially we look for a cluster of very obvious spikes off of lower timeframe support and resistance levels within the higher timeframe zone.
- Candlestick patterns. We tend to stick with pin bars and engulfing bars as these have proven to be the most effective.
We typically search for lower-timeframe confirmation between the M15 and H1 timeframes, since most of our higher-timeframe areas begin with the H4. Stops are usually placed 1-3 pips beyond confirming structures.
EUR/USD:
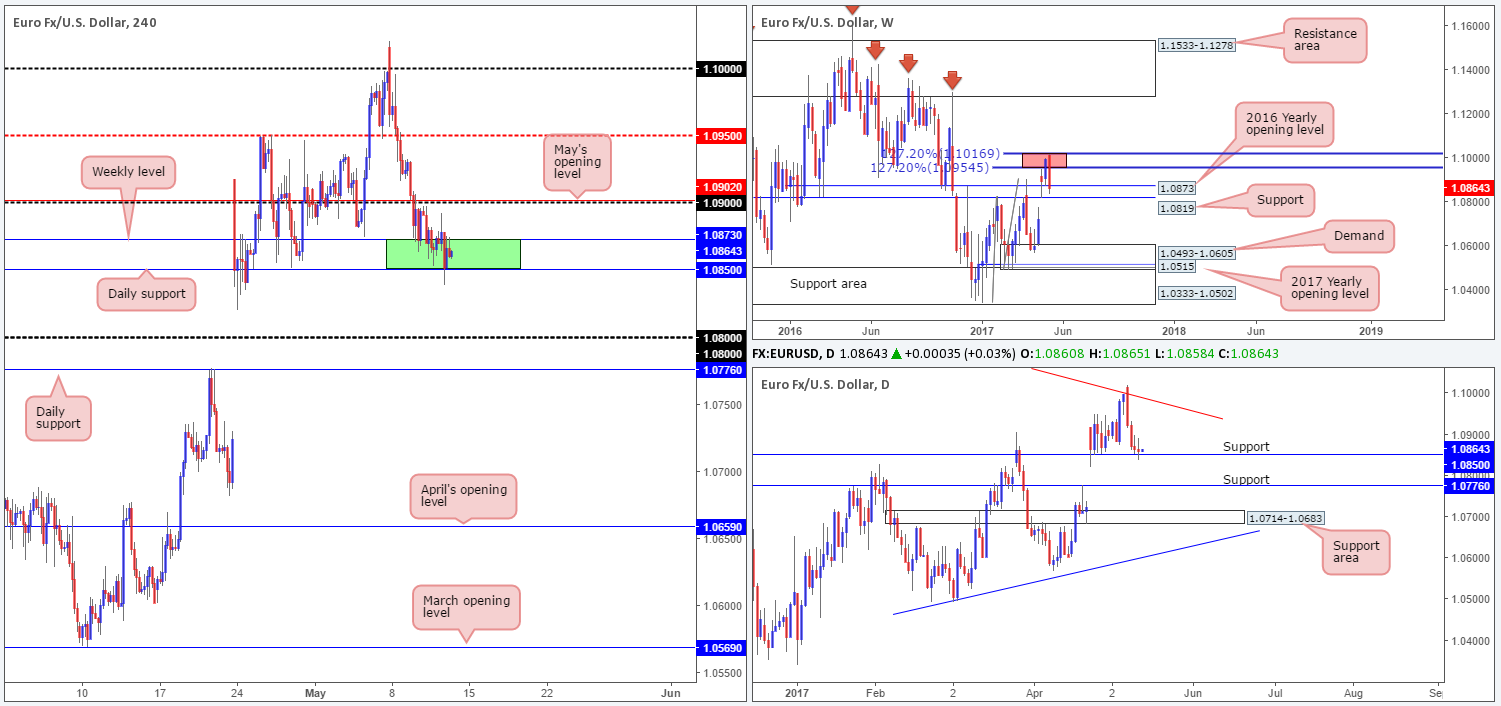
EUR/USD prices, as you can see, are effectively unchanged this morning. The H4 candles, despite a minor break seen to the downside going into the early hours of yesterday’s US segment, remain trading amid 1.0850/1.0873. Made up of a weekly support level (2016 yearly opening line) at 1.0873 and a daily support band at 1.0850, the buyers and sellers have been battling for position within/around this area since Tuesday.
With the US dollar seen forming a strong H4 selling wick (see US dollar index) around the 99.70ish mark during yesterday’s sessions, we may see H4 buyers register some noteworthy interest from 1.0850/1.0873 sometime today.
Our suggestions: Given the above notes, our team has decided that in order to become buyers from 1.0850/1.0873, we would need to witness a reasonably sized H4 bullish rotation candle form within the noted green zone (preferably a full-bodied candle). A strong H4 rotation – coupled with the aforementioned higher-timeframe support structures would, in our opinion, be enough evidence to suggest the bulls are back in the game and are likely going to push above the 1.09 neighborhood.
Data points to consider: German Prelim GDP at 7am. US Inflation data and Retail sales figures at 1.30pm, FOMC member Evans speaks at 2pm, US Prelim UoM consumer sentiment at 3pm , FOMC member Harker speaks at 5.30pm GMT+1.
Levels to watch/live orders:
- Buys: 1.0850/1.0873 ([waiting for a reasonably sized H4 bull candle, preferably a full-bodied candle, to form before pulling the trigger is advised] stop loss: ideally beyond the candle’s tail).
- Sells: Flat (stop loss: N/A).
GBP/USD:
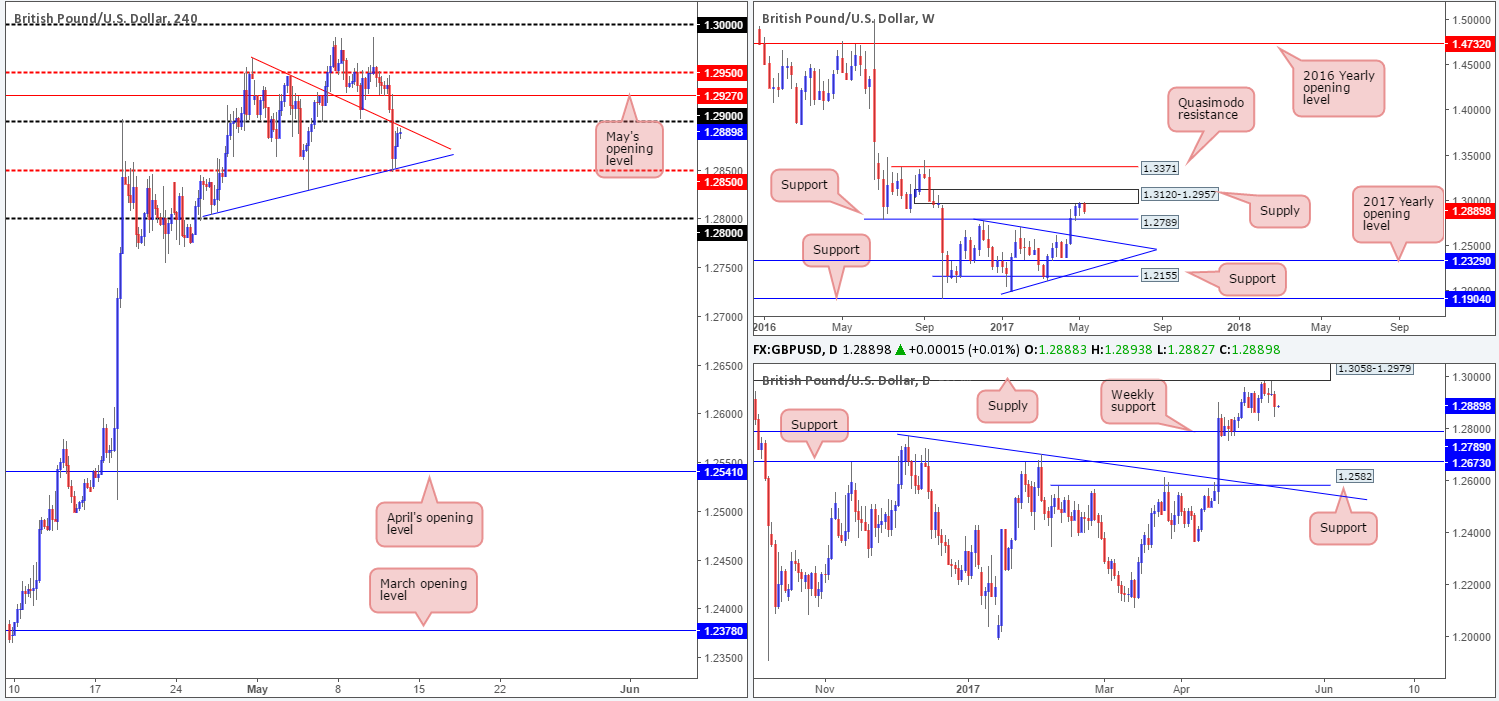
The GBP/USD sold off yesterday in response to the BoE’s decision to keep monetary policy unchanged. Easily clearing bids from the 1.29 handle this led to price testing the H4 mid-level support at 1.2850. As is evident on the H4 chart, this has placed the candles in a somewhat restricted state. Not only is the unit now confined between 1.2850/1.29, there’s also the two converging H4 trendlines to contend with (1.2804/1.2965).
In view of weekly supply at 1.3120-1.2957 and its partner supply on the daily timeframe at 1.3058-1.2979, further downside is still favored. That is, of course, until we reach the 1.28 region which is positioned nearby weekly support at 1.2789.
Our suggestions: At the time of writing, our team’s focus is on looking for a close beyond 1.2850/H4 trendline support. A close beyond this angle, followed with a retest as well as a lower-timeframe sell signal (see the top of this report for ideas on how to use the lower timeframes for entry) would, in our opinion, be enough confirmation to sell, targeting the 1.28 neighborhood.
Data points to consider: US Inflation data and Retail sales figures at 1.30pm, FOMC member Evans speaks at 2pm, US Prelim UoM consumer sentiment at 3pm , FOMC member Harker speaks at 5.30pm GMT+1.
Levels to watch/live orders:
- Buys: Flat (stop loss: N/A).
- Sells: Watch for H4 price to engulf 1.2850 and then look to trade any retest seen thereafter ([waiting for a lower-timeframe sell signal to form following the retest is advised] stop loss: dependent on where one confirms this level).
AUD/USD:
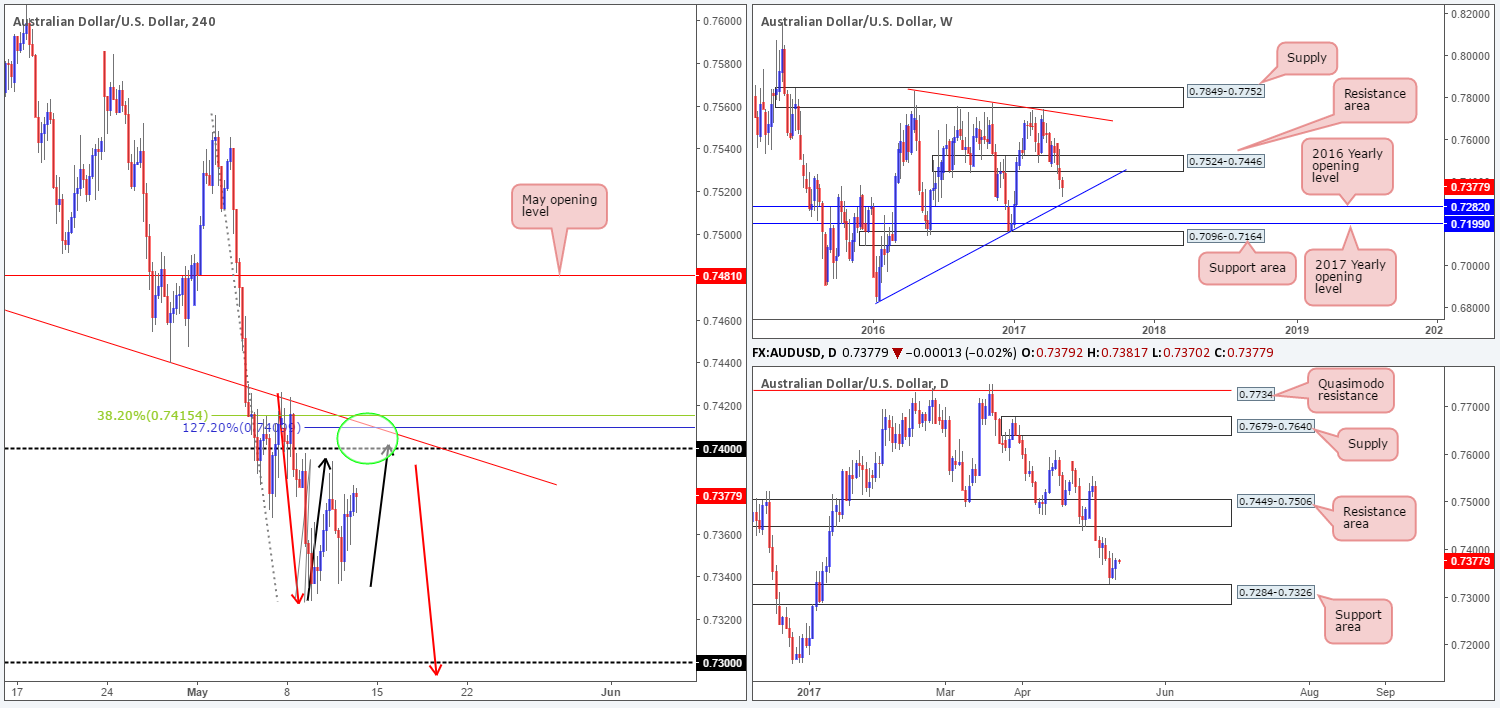
The technical picture on the AUD/USD is interesting. Up on the weekly chart, price shows room to continue selling off until we reach the trendline support extended from the low 0.6827/2016 yearly opening level at 0.7282. Down on the daily chart, the unit also displays room to trade lower to a support area drawn from 0.7284-0.7326.
Looking over to the H4 chart, we have two potential AB=CD formations in play:
1. A H4 AB=CD bullish pattern taken from the high 0.7426 that terminates a few inches below the 0.73 handle.
2. A H4 AB=CD bearish pattern drawn from the low 0.7328, which happens to complete around the 0.74 handle.
The first AB=CD pattern is incredibly attractive. Not only does it merge closely with the 0.73 handle, it also sits within the said daily support area, which itself intersects with the aforementioned weekly trendline support and is beautifully positioned a few pips above the 2016 yearly opening level! Not a bad place to look for longs!
The second AB=CD pattern is equally attractive. The termination point fuses with the following: a 0.74 handle, a H4 trendline resistance extended from the low 0.7475, a 127.2% H4 Fib ext. at 0.7409 taken from the low 0.7328 and a 38.2% H4 Fib resistance at 0.7415 pegged from the high 0.7556.
Our suggestions: Look for shorting opportunities between 0.7415/0.74, and l longs from around the 0.73 neighborhood.
Data points to consider: US Inflation data and Retail sales figures at 1.30pm, FOMC member Evans speaks at 2pm, US Prelim UoM consumer sentiment at 3pm , FOMC member Harker speaks at 5.30pm GMT+1.
Levels to watch/live orders:
- Buys: 0.73 region (stop loss: 0.7275 [beyond the daily support area/yearly opening level]).
- Sells: 0.7415/0.74 ([waiting for a reasonably sized H4 bear candle, preferably a full-bodied candle, to form before pulling the trigger is advised] stop loss: ideally beyond the candle’s wick).
USD/JPY:
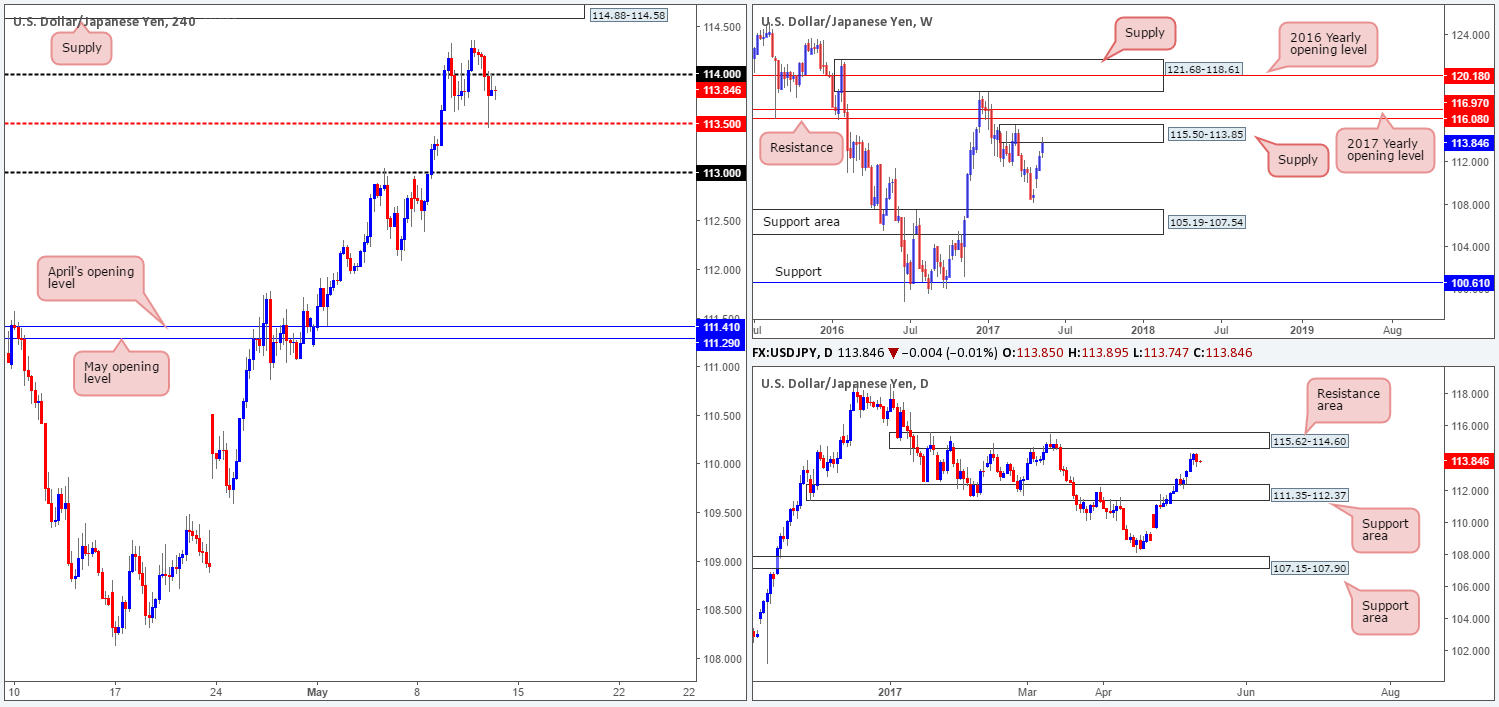
Despite having broken above 114 for a second consecutive time this week, the pair, yet again, failed to sustain gains beyond this number. This could very well have something to do with the weekly candles seen trading from supply marked at 115.50-113.85. However, according to daily structure, the pair may still pop north to a resistance zone coming in at 115.62-114.60. Also noteworthy in this market at the moment is the nearby H4 supply zone drawn from 114.88-114.58. Not only is this base lodged within both weekly supply and the daily resistance area, it also boasts strong downside momentum!
Our suggestions: With the above taken into consideration, our team still has a pending sell order placed at 114.57 with a stop set at 114.90. Nevertheless, we will not allow these orders to remain in the market during high-impacting events (see below). The first take-profit target, should this trade come to fruition, will highly likely be the 114 handle.
Data points to consider: US Inflation data and Retail sales figures at 1.30pm, FOMC member Evans speaks at 2pm, US Prelim UoM consumer sentiment at 3pm , FOMC member Harker speaks at 5.30pm GMT+1.
Levels to watch/live orders:
- Buys: Flat (stop loss: N/A).
- Sells: 114.57 ([pending order] stop loss: 114.90).
USD/CAD:
Since the beginning of the week, the USD/CAD has been seen consolidating between 1.3750/1.3650. Beneath this range is a round number seen at 1.36, which happens to sit two pips above a daily support area at 1.3598-1.3559. Above, however, sits the 1.38 handle. This level is interesting due to it being positioned just below the 2016 yearly opening level seen on the weekly chart at 1.3814.
With daily price seen lurking around the lower edge of supply at 1.3859-1.3700, a break below the current H4 range is likely. With that being said though, there’s an equal chance that this range could suffer a breach to the upside as 1.38, given its relationship with the 2016 yearly opening level, is attractive for shorts.
Our suggestions: Given our conservative nature, we would not be looking to sell this piece until price has connected with the above noted 2016 yearly opening level (essentially around the 1.38 region seen circled in green on the H4 chart). The reason being is that this line firmly located within the upper limits of the said daily supply and thus allows the trader to conservatively place stops above this area. However, should the unit close below our H4 range before testing 1.38, we might consider looking to sell from here. It really depends on how far price extends following the break, since 1.36 would be the take-profit target.
Data points to consider: US Inflation data and Retail sales figures at 1.30pm, FOMC member Evans speaks at 2pm, US Prelim UoM consumer sentiment at 3pm , FOMC member Harker speaks at 5.30pm GMT+1.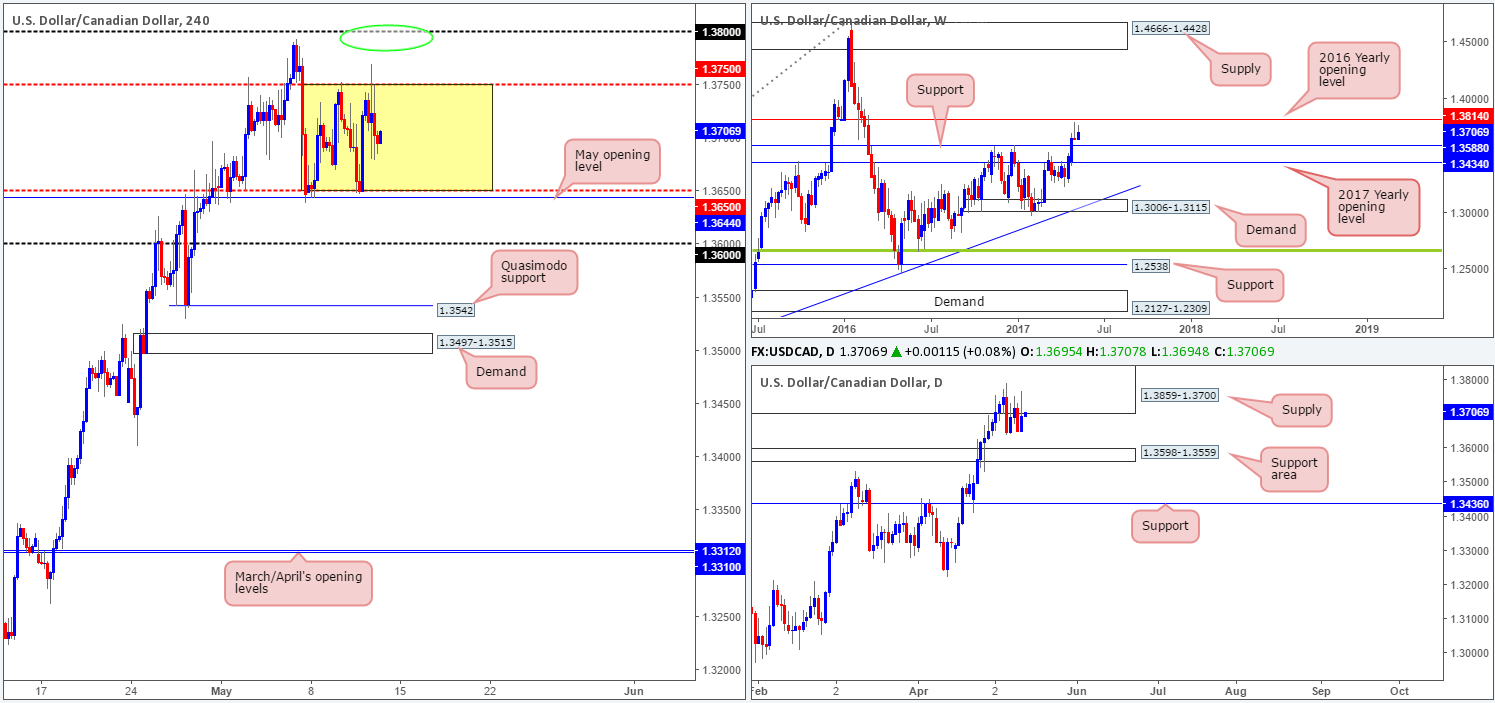
Levels to watch/live orders:
- Buys: Flat (stop loss: N/A).
- Sells: 1.3814/1.38 region is an ideal place for shorts since this area requires no additional confirmation (stop loss: conservative at 1.3861).
USD/CHF:
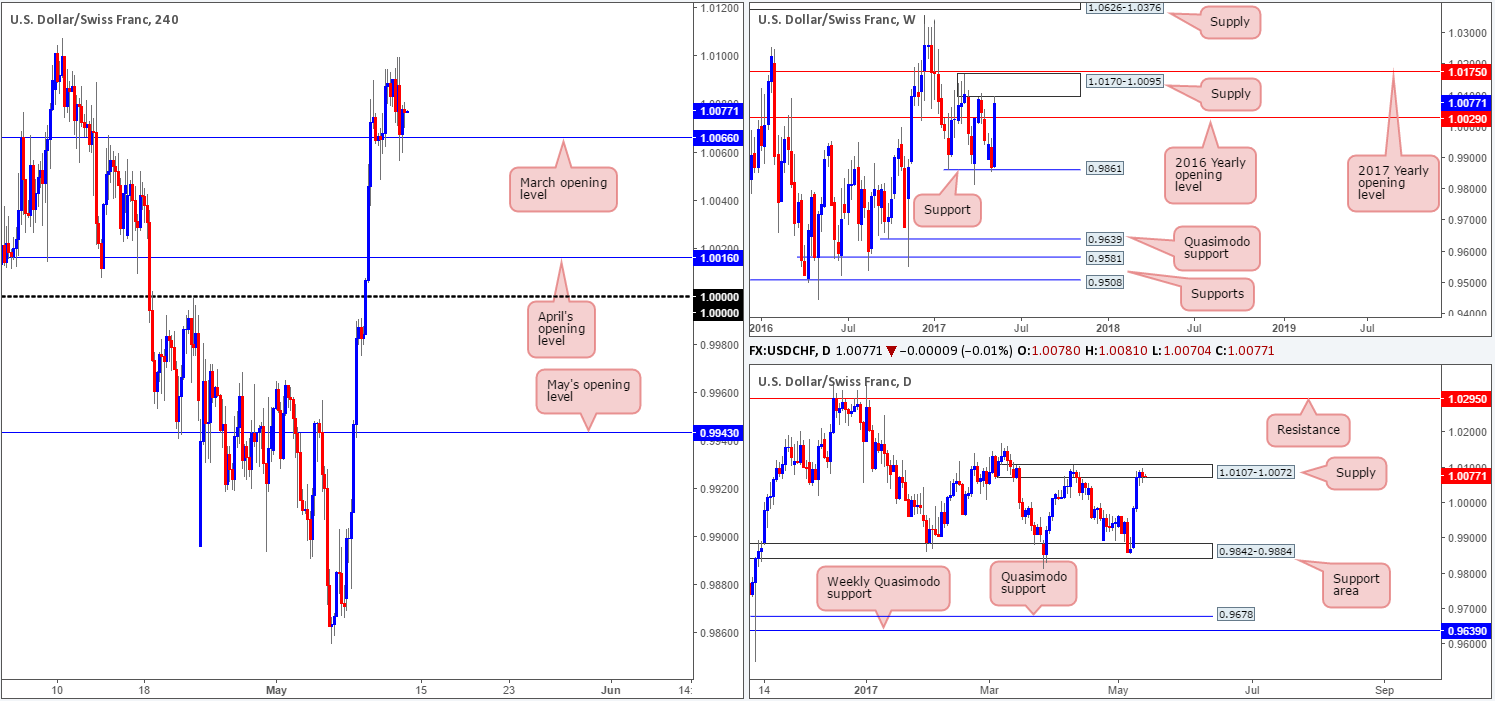
Once again, we’re seeing March’s opening level at 1.0066 holding firm. This is somewhat surprising knowing that weekly price recently came into contact with the underside of supply drawn from 1.0170-1.0095, and the daily candles are currently seen roaming within supply drawn from 1.0107-1.0072.
In view of the higher-timeframe structures, our team favors the downside at the moment. Despite this, we would not look to become sellers in this market until March’s opening line has been consumed as this could still be potentially problematic!
Our suggestions: A decisive H4 close beyond 1.0066, coupled with a retest and a reasonably sized H4 bearish candle (preferably a full-bodied candle) would, in our experience, be enough evidence to sell, targeting April’s opening level at 1.0016/1.0000 (parity).
Data points to consider: US Inflation data and Retail sales figures at 1.30pm, FOMC member Evans speaks at 2pm, US Prelim UoM consumer sentiment at 3pm , FOMC member Harker speaks at 5.30pm GMT+1.
Levels to watch/live orders:
- Buys: Flat (stop loss: N/A).
- Sells: Watch for H4 price to engulf 1.0066 and then look to trade any retest seen thereafter ([waiting for a reasonably sized H4 bearish candle to form following the retest is advised, preferably in the shape of a full-bodied candle] stop loss: ideally beyond the candle’s wick).
DOW 30:
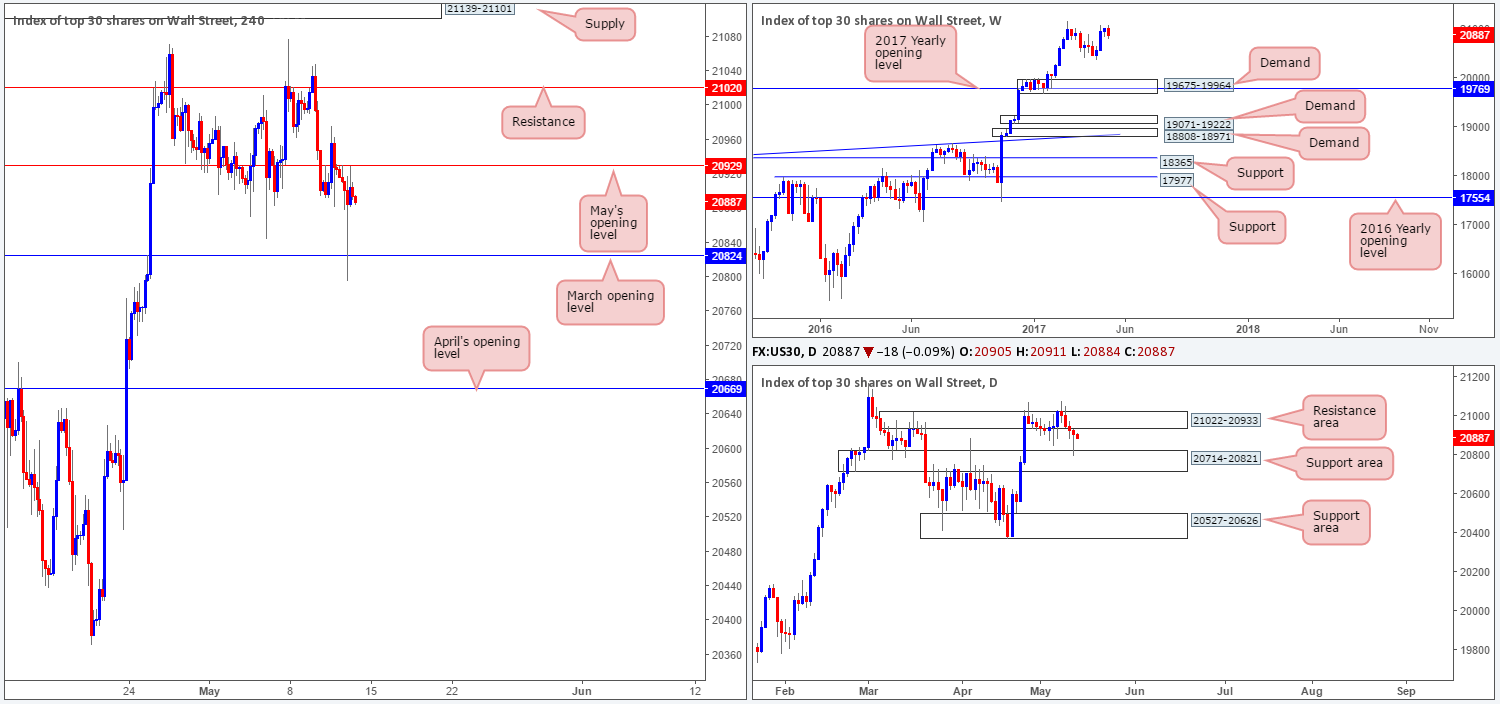
During the course of yesterday’s segment, daily price beautifully connected with a support area coming in at 20714-20821, and formed an even more beautiful-looking bullish buying tail! The weekly candles remain trading nearby record highs at 21170, but have begun to print bearish intentions, already wiping out all of the prior week’s gains.
Bouncing across to the H4 chart, we can see that movement is currently restricted by May’s opening level at 20929 and March’s opening base line drawn in at 20824.
Our suggestions: Personally, we are not seeing much to hang our hat on at this time. A long at current market prices would place you against not only May’s opening line, but also the daily resistance area at 21022-20933. Similarly, a short would position one against the nearby daily support area mentioned above and against the overall trend of the market (see the weekly trend)! Therefore, remaining flat for the time being may very well be the better path to take.
Data points to consider: US Inflation data and Retail sales figures at 1.30pm, FOMC member Evans speaks at 2pm, US Prelim UoM consumer sentiment at 3pm , FOMC member Harker speaks at 5.30pm GMT+1.
Levels to watch/live orders:
- Buys: Flat (stop loss: N/A).
- Sells: Flat (stop loss: N/A).
GOLD:
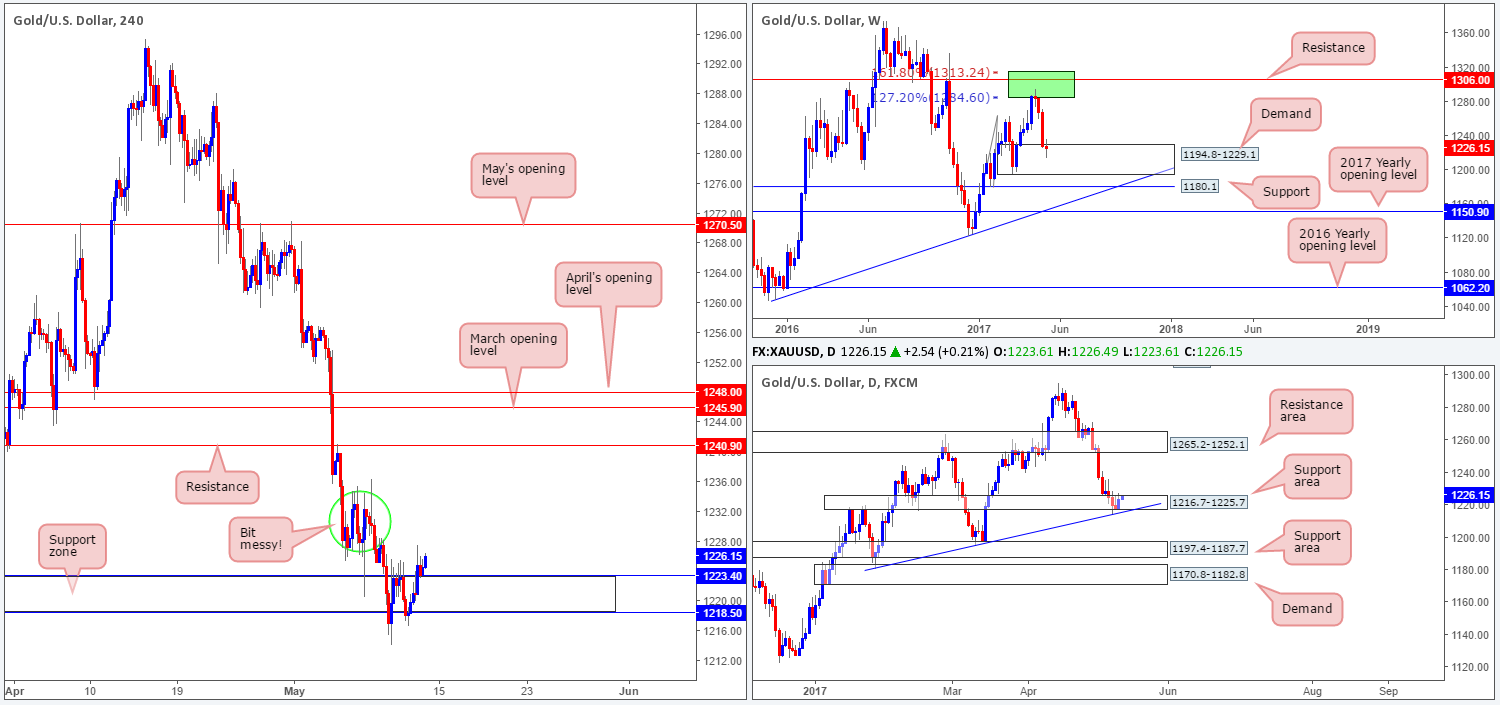
The bulls are finally beginning to express some interest from within the weekly demand base marked at 1194.8-1229.1. In the event that this area continues to be respected and price rallies, there’s a good chance that the market could retest the two weekly Fibonacci extensions 161.8/127.2% at 1313.7/1285.2 taken from the low 1188.1 (green zone). Popping down to the daily chart, the support area at 1216.7-1225.7 (bolstered by a trendline support at 1180.4) is also looking in better shape at the moment. The next upside hurdle from this angle can be seen around a resistance area pegged at 1265.2-1252.1.
Although the H4 candles are showing strength from the support zone at 1218.5-1223.4, there’s still an awful amount of wood to chop through seen marked with a green circle at 1236.0/1228.0. Therefore, despite what the higher-timeframe structures suggest, going long right now might not be such a good idea.
Our suggestions: While entering long may be attractive in respect to the bigger picture, buying into the mess seen on the H4 chart is just too risky for our liking! To that end, lying low and remaining on the sidelines may be the best position in this market for now.
Levels to watch/live orders:
- Buys: Flat (stop loss: N/A).
- Sells: Flat (stop loss: N/A).


