A note on lower timeframe confirming price action…
Waiting for lower timeframe confirmation is our main tool to confirm strength within higher timeframe zones, and has really been the key to our trading success. It takes a little time to understand the subtle nuances, however, as each trade is never the same, but once you master the rhythm so to speak, you will be saved from countless unnecessary losing trades. The following is a list of what we look for:
- A break/retest of supply or demand dependent on which way you’re trading.
- A trendline break/retest.
- Buying/selling tails/wicks – essentially we look for a cluster of very obvious spikes off of lower timeframe support and resistance levels within the higher timeframe zone.
- Candlestick patterns. We tend to only stick with pin bars and engulfing bars as these have proven to be the most effective.
We search for lower timeframe confirmation between the M15 and H1 timeframes, since most of our higher-timeframe areas begin with the H4. Stops are usually placed 5-10 pips beyond confirming structures.
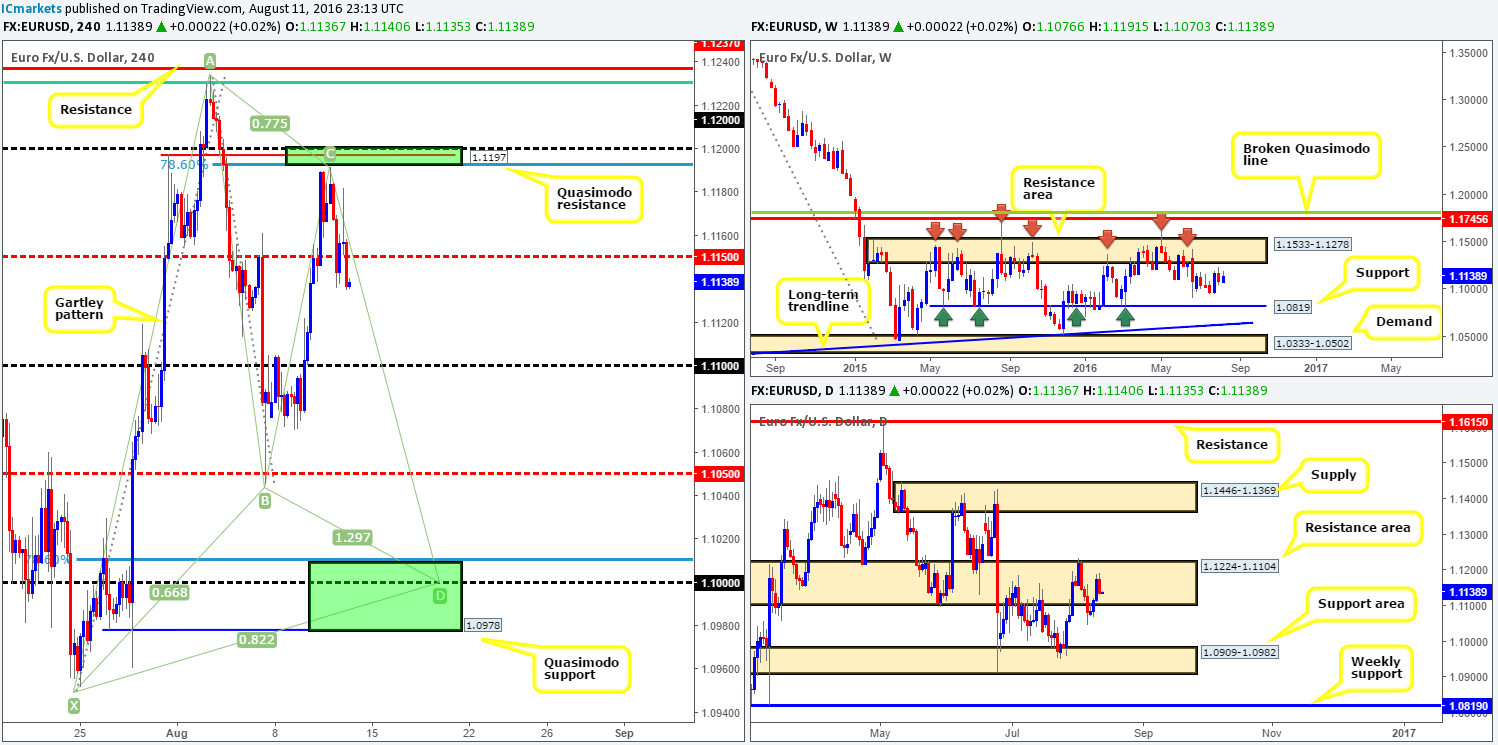
EUR/USD:
The EUR currency settled below the H4 mid-way support at 1.1150 yesterday, following a modest sell off from just ahead of the H4 sell zone (green area) seen at 1.12/1.1192. This move erased more than fifty percent of Wednesday’s gains, and was likely boosted by price bouncing from H4 support at 95.48 over on the USDX.
Given the strong close beyond 1.1150 and the fact that daily action has established itself within the confines of a daily resistance area coming in at 1.1224-1.1104, it’s possible we may see a continuation move down to the 1.11 handle today. Additionally, should price take out 1.11 either today or next week, the D-leg of a H4 harmonic Gartley pattern may take shape down to around the 1.10 region.
Since we’re adding the H4 Quasimodo support into the equation, our buy zone for the above said H4 Gartley pattern is fixed between 1.0978/1.1011 (lower green box). Aggressive traders may place stops just below this green zone, whilst more conservative traders might opt to set stops beyond the X point of the harmonic pattern around the 1.0947ish range.
On the data front, traders are likely eyeing the Preliminary German GDP release along with USD retail sales data a little later on. Therefore, do remain vigilant around those times guys!
Our suggestions: In view of the points noted above, here’s our two pips’ worth:
- Look to sell any retest seen to the underside of 1.1150, targeting 1.11 as your immediate take-profit zone. Should price reach here, we’d also ideally be looking to move our stops to breakeven at this point.
- In the event that the EUR does indeed continue to weaken, we’d be looking to buy the pair within the above said H4 harmonic Gartley reversal zone, since it also sits on top of the daily support area at 1.0909-1.0982 – the next downside target on the daily timeframe.
In regards to selling 1.1150, we’d also advise waiting for a lower timeframe sell trigger before placing capital on the line (see the top of this report) as fakeouts are common around psychological levels! Concerning longs, we would, dependent on the time of day and H4 approach, look to enter long at market from the aforementioned H4 harmonic buy zone, taking the more conservative approach to stops.
Levels to watch/live orders:
- Buys: 1.0978/1.1011 [Dependent on the H4 approach and time of day a buy at market is possible from here] (Stop loss: Aggressive: 1.0975 Conservative: 1.0947).
- Sells: 1.1150 region [Tentative – confirmation required] (Stop loss: dependent on where one confirms this area).
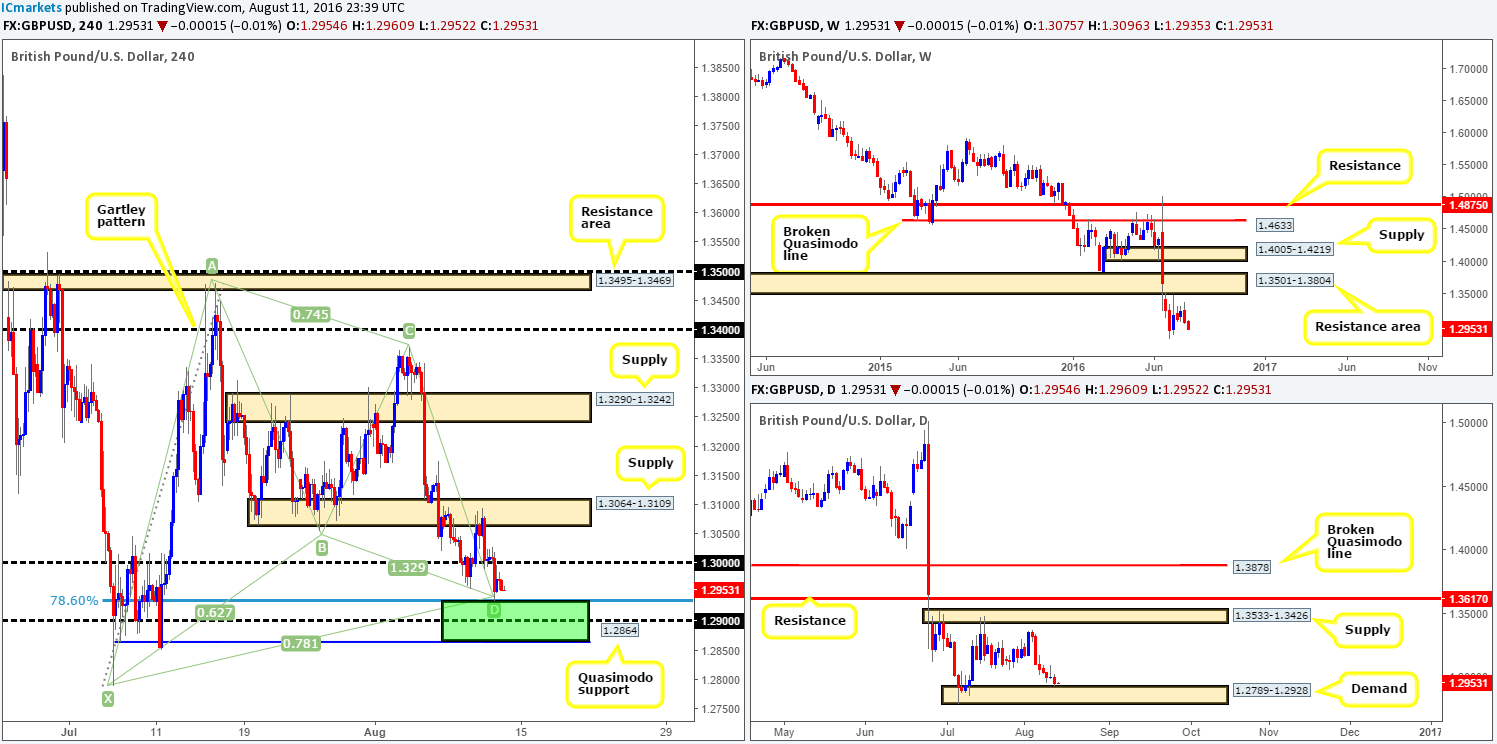
GBP/USD:
In recent trading, cable gobbled up the 1.30 figure amid yesterday’s European open, resulting in the pair dropping to lows of 1.2935 on the day – the top edge of a H4 harmonic Gartley reversal zone fixed between 1.2864/1.2935. This green buy zone comprises of a H4 Quasimodo support, the 1.29 handle and a H4 78.6% Fib support.
The story on this pair is interesting. While H4 price is now seen trading mid-range between 1.30 and the aforementioned H4 harmonic buy zone, daily price is also hovering just above a daily demand zone penciled in at 1.2789-1.2928. Together, the H4 and daily structures form an interesting buy zone! However, up on the weekly chart support is literally nonexistent as far as we can see until the 1.20 region. This – coupled with a strong bearish trend makes the downside more favorable, especially in the longer term.
Therefore, given that daily candles have yet to actually connect with the daily demand barrier, yesterday’s bounce from the top edge of the H4 harmonic zone will not likely hold and price may drive lower to the 1.29ish range, before we see any meaningful response from here. Aggressive traders may look to place stops around the 1.2844 region, while more conservative traders might look to set stops below the X point of the harmonic formation at 1.2778.
Our suggestions: Since this harmonic bullish pattern has formed within a bearish downtrend we’d highly recommend waiting for lower timeframe confirmation to form before placing capital on the line. This could be in the form of an engulf of supply followed by a retest, a trendline/break retest or simply a collection of well-defined buying tails seen around the harmonic reversal zone. This, in our opinion, will likely get you in at a better price and potentially avoid unnecessary drawdown.
Levels to watch/live orders:
- Buys: 1.29ish region [Tentative – confirmation required] (Stop loss: dependent on where one confirms this area).
- Sells: Flat (Stop loss: N/A).
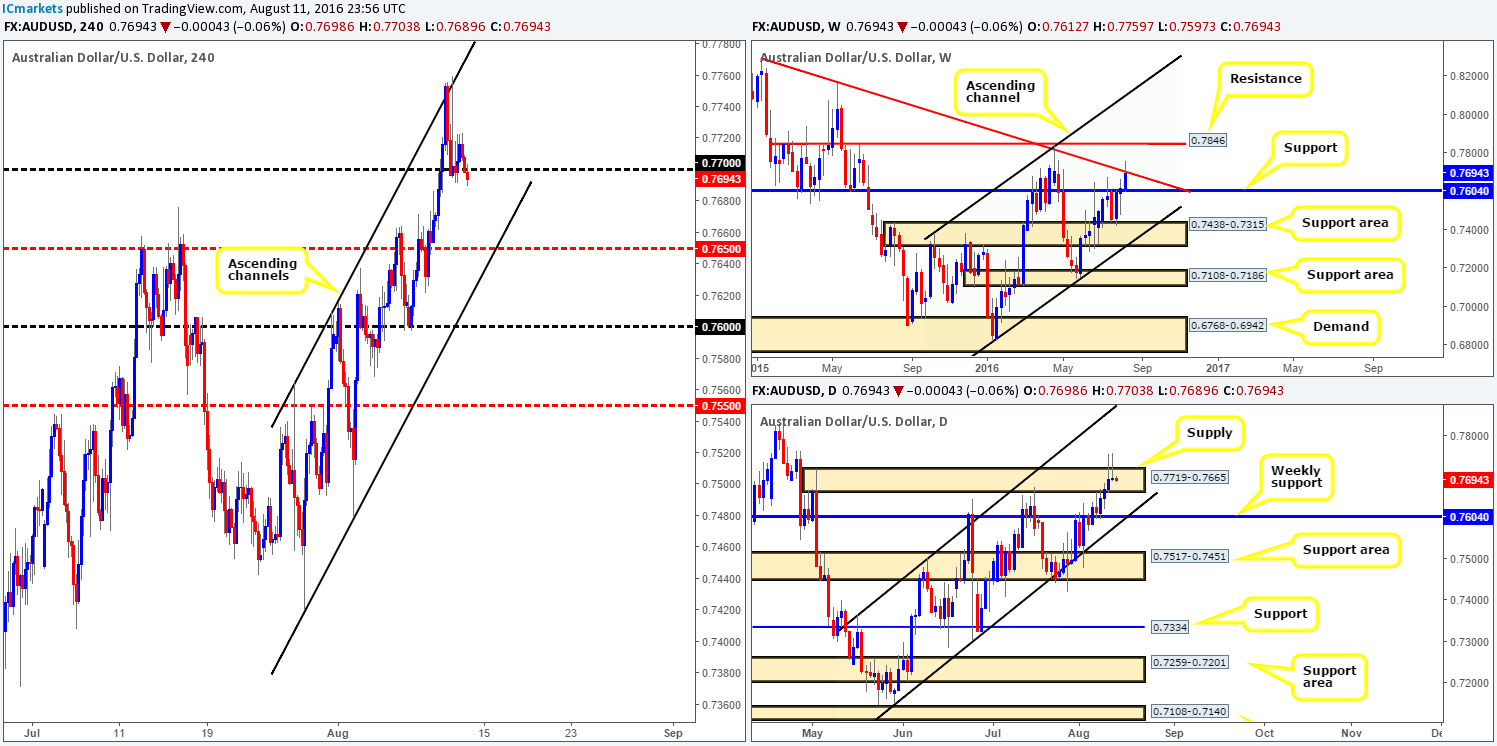
AUD/USD:
Once again working our way from the top, weekly price is currently seen respecting the weekly trendline resistance extended from the high 0.8895. As mentioned in the previous analysis, should offers hold ground here, a push back down to test the weekly support boundary at 0.7604 may be on the cards.
Climbing down into the daily chart, back-to-back daily selling wicks have recently took shape, both piercing through the top edge of a daily supply zone drawn from 0.7719-0.7665. By the same token, the next downside target on this scale comes in at the above said weekly support level, which fuses beautifully with a daily channel support line taken from the low 0.7148.
Over on the H4 chart, the buyers have been struggling to hold the 0.77 handle, despite an earnest attempt going into the early hours of yesterday’s sessions. Should the current H4 candle close beyond the 0.77 boundary, we may, as we highlighted in yesterday’s report, have a possible sell trade on our hands.
Our suggestions: Watch for price to close below 0.77 today. A retest to the underside of this number followed by a lower timeframe sell signal (see the top of this report), we could see the Aussie drop lower from here to at least test the H4 mid-way support at 0.7650, which makes for a beautiful first take-profit target.
Levels to watch/live orders:
- Buys: Flat (Stop loss: N/A).
- Sells: Watch for price to close below the H4 mid-way support 0.7650 and look to trade any retest seen thereafter (lower timeframe confirmation required).
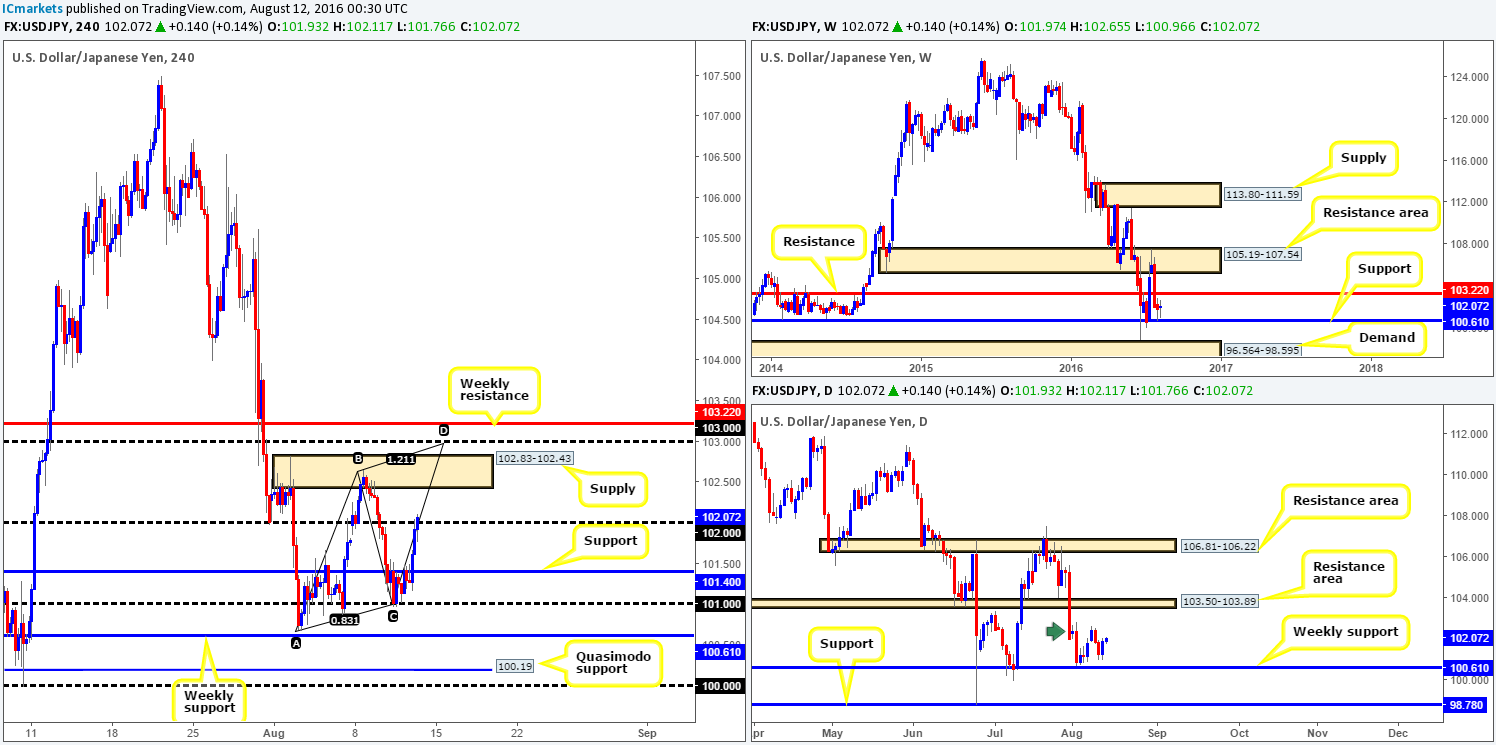
USD/JPY:
As we moved into yesterday’s US session the USD/JPY pair came alive! A strong wave of bids flooded the market, consequently consuming the H4 resistance at 101.40 (now acting support) and ended the day touching gloves with the psychological number 102. Beyond 102, we can see that there’s a nearby H4 supply found at 102.83-102.43, followed closely by the 103 handle/weekly resistance level at 103.22.
In that the pair seems to be in the process of chalking up a nice-looking H4 AB=CD bearish pattern (see chart) which terminates just ahead of 103, shorting this handle (given the predominant bearish trend price is in and the bolstering weekly resistance level) is certainly something that interests our team.
Our suggestions: Watch for the market to close above 102 today. From here, we’d then be looking for a fakeout above the overhead H4 supply at 102.83-102.43, into the 103.22/103 region, which as you already know, sports a H4 AB=CD completion point! Despite the confluence seen around this sell zone, waiting for lower timeframe confirmation (see the top of this report) is still required (for us), due to the possibility of a fakeout into the daily resistance area lurking just above at 103.50-103.89.
Levels to watch/live orders:
- Buys: Flat (Stop loss: N/A).
- Sells: 103.22/103 region [Tentative – confirmation required] (Stop loss: dependent on where one confirms this area).
USD/CAD:
For those who read our previous report you may recall that our team mentioned to watch for shorting opportunities around the underside of the recently broken H4 channel support extended from the low 1.2767. As is shown on the H4 chart, price responded just beautifully from this line, selling off heavily into the day’s close. Well done to any of our readers who took part in this trade setup!
Consequent to this move, the key figure 1.30 was taken out and price collided with a rather ugly-looking H4 demand seen marked with a black arrow at 1.2926-1.2973. To our way of seeing things, 1.30 is likely to hold as resistance due to the following reasons:
- Weekly price is aggressively selling off from weekly supply at 1.3295-1.3017, and has already erased last week’s gains.
- The recent selling saw price take out a daily trendline support extended from the low 1.2460, and as a result, potentially opened up the path south for further selling down to a minor daily trendline support taken from the low 1.2831.
Our suggestions: Quite simply, look for shorts around the underside of 1.30 today. Waiting for a lower timeframe sell signal (see the top of this report) prior to pulling the trigger is still recommended since a whipsaw through this number is expected. Given the higher-timeframe picture (see above), we’re looking down to around the 1.29ish region to take profit.
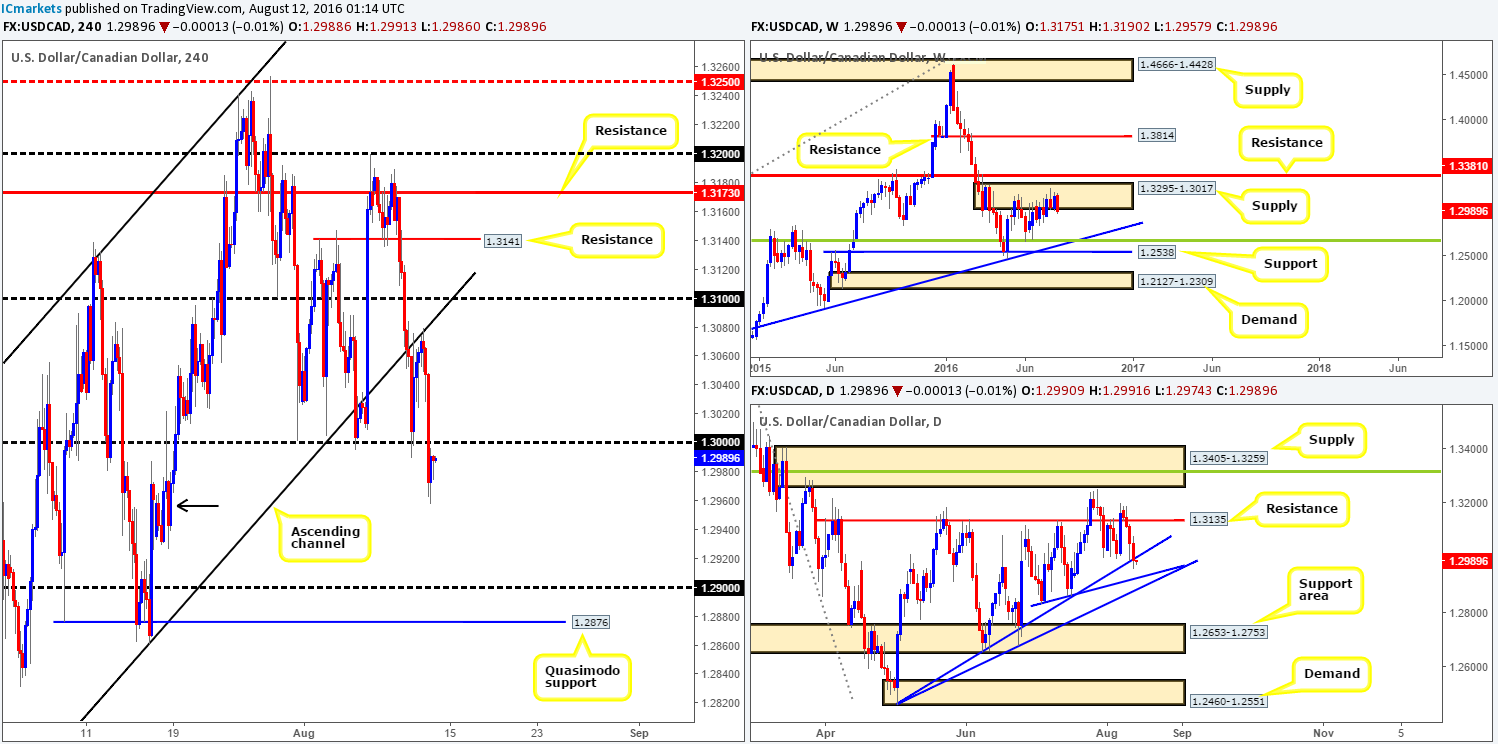
Levels to watch/live orders
- Buys: Flat (Stop loss: N/A).
- Sells: 1.30 region [Tentative – confirmation required] (Stop loss: dependent on where one confirms this area).
USD/CHF:
Throughout yesterday’s dealings, the Swissy pair whipsawed through H4 demand at 0.9721-0.9734 and came within a pip of connecting with the H4 support line at 0.9710. Now, for traders who read our previous report, the above said H4 demand and this H4 support level were both listed as points of interest for buys yesterday. The fakeout is, at least in our view, just poetry in motion since price also came within striking distance of connecting with the daily support area seen at 0.9648-0.9708! Well done to any of our readers who managed to catch this move!
In light of recent movement, our team is very interested in buying this pair, targeting the 0.98 region. As per the black arrows seen on the H4 chart, a retest of the recently broken H4 demand (coupled with H4 trendline confluence from the low 0.9633) is, in our opinion, a stable enough buy zone to hunt for lower timeframe long entries into this market today (see the top of this report for entry techniques that we use in our trading).
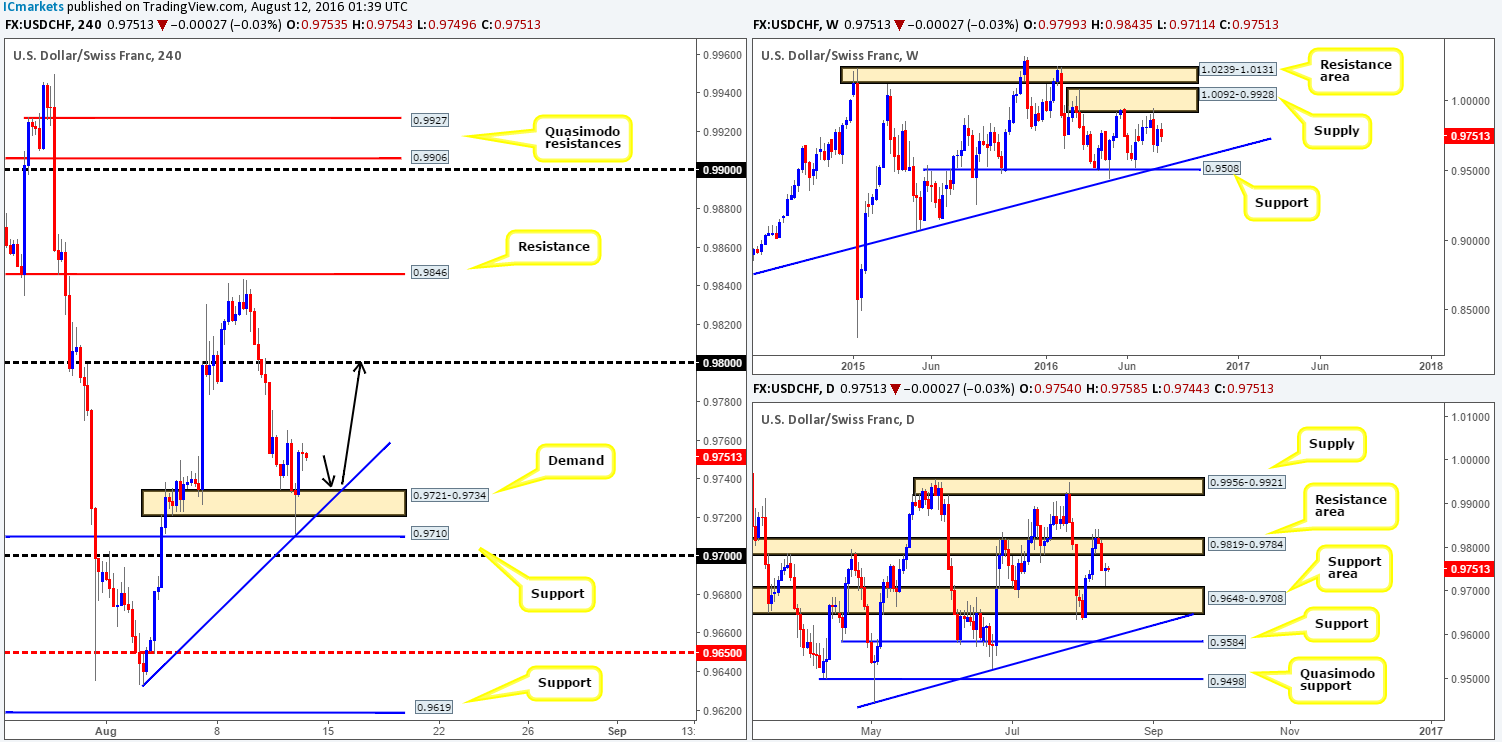
Levels to watch/live orders:
- Buys: 0.9721-0.9734 [Tentative – confirmation required] (Stop loss: dependent on where one confirms this area).
- Sells: Flat (Stop loss: N/A).
DOW 30:
US stocks ramped things up during yesterday’s sessions and rallied over 110 points, managing to etch out an all-time high of 18639 on the day. In our previous report, this was a noted move to watch for, so we do hope some of our readers caught this! For those who missed the analysis, a long trade from the H4 broken Quasimodo line at 18482 had the following support:
- A weekly bullish pin bar printed last week from within a weekly support area coming in at 18365-18158.
- Technically speaking, there was little to no active supply seen to the left on the daily chart, indicating a move higher was on the cards.
- A picture-perfect H4 AB=CD approach formed en-route to the aforementioned H4 broken Quasimodo line.
Unfortunately, our team was unable to pin down a position here as we failed to see any lower timeframe bullish price action to permit an entry.
Going forward, however, we feel that price may enter into corrective mode today. This, as far as we can see, could send the DOW lower to test the H4 broken Quasimodo line at 18570, which in our opinion, is a sturdy buy zone considering the recent break into all-time high territory.
Our suggestions: Watch for price to test the H4 broken Quasimodo line at 18570 today. Should this come into view and the index holds firm, wait for price to chalk up lower timeframe confirmation to enter long (see the top of this report). The reason we recommend this is simply because fixed levels such as this one here, has ‘fake me out’ written all over it!
In the event that the above scenario plays out, we’d look to hold the position with the expectation of price clocking a new all-time high.
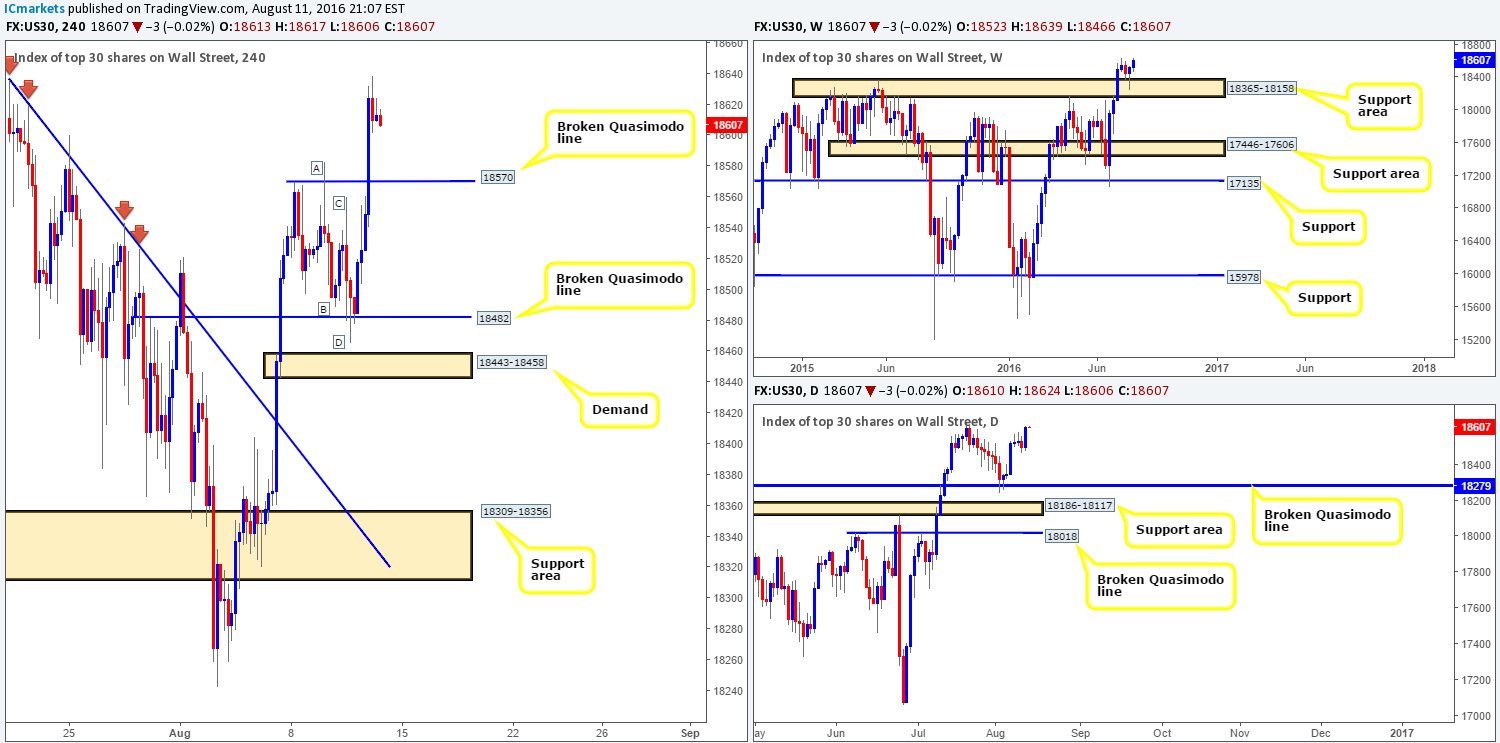
Levels to watch/live orders:
- Buys: 18570 region [Tentative – confirmation required] (Stop loss: dependent on where one confirms this area).
- Sells: Flat (Stop loss: N/A).
GOLD:
Since the yellow metal topped out around the daily resistance line at 1354.6, price drove to new lows of 1334.7 yesterday, following a break of the H4 support area at 1347.0-1342.4 (now acting resistance). In view of the rebound seen from the current daily resistance barrier, alongside room being seen for this market to move lower on the weekly chart, we feel the next H4 downside target support at 1332.3 (broken Quasimodo line) will eventually be taken out.
With that being the case, here is our two cents’ worth on where the metal may head today:
- Since the more likely direction is south, watch for price to retest the underside of the recently broken H4 support area at 1347.0-1342.4 for possible short trades (waiting for lower timeframe confirmation is recommended – see the top of this report), targeting 1332.3, followed by the H4 demand at 1315.6-1319.6.
- Also watch for a close below the above said H4 broken Quasimodo line, for a retest trade, targeting H4 demand at 1315.6-1319.6. Again, we would recommend waiting for lower timeframe confirmation to form prior to pulling the trigger simply to avoid any fakeout seen on the retest.
- And finally, should price reach this H4 demand base, all of our short positions are to be liquidated and we’ll look to possibly enter long at market (dependent on the approach and time of day) from this area. The reason as to why is because along with the H4 demand, we also have a merging H4 harmonic Gartley reversal zone plus a bolstering daily demand area at 1305.3-1322.8, which itself sits on top of a weekly support area at 1307.4-1280.0 (the next downside target on the weekly timeframe).
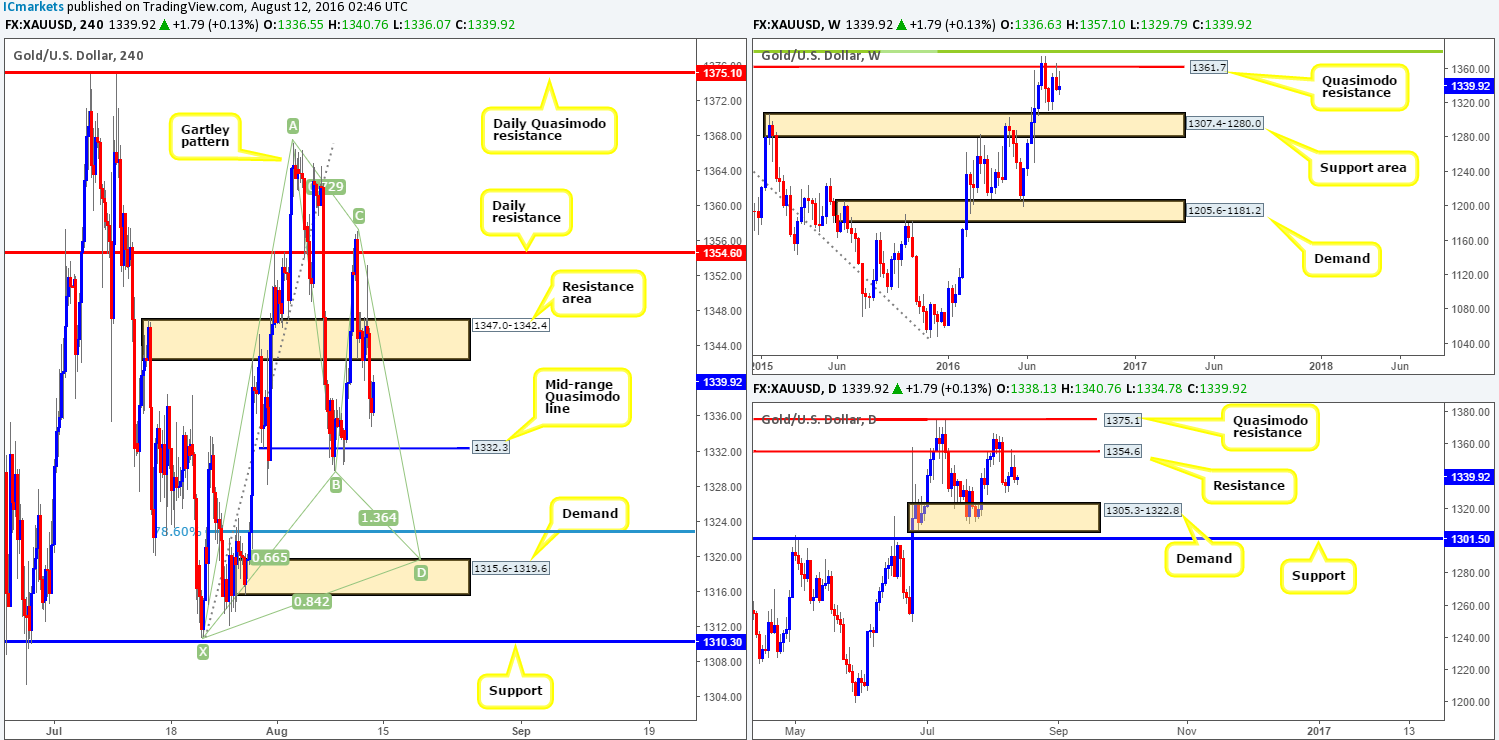
Levels to watch/live orders:
- Buys: 1315.6-1319.6 [Dependent on the approach and time of day a market long is possible] (Stop loss: below the X point of the H4 harmonic formation: 1309.1, which is, as you can see, set just beyond the H4 support at 1310.3).
- Sells: 1347.0-1342.4 [Tentative – confirmation required] (Stop loss: dependent on where one confirms this area). Watch for price to close below the H4 mid-range Quasimodo support at 1332.3 and look to trade any retest seen thereafter (lower timeframe confirmation required).


