A note on lower timeframe confirming price action…
Waiting for lower timeframe confirmation is our main tool to confirm strength within higher timeframe zones, andhas really been the key to our trading success. It takes a little time to understand the subtle nuances, however, as each trade is never the same, but once you master the rhythm so to speak, you will be saved from countless unnecessary losing trades. The following is a list of what we look for:
- A break/retest of supply or demand dependent on which way you’re trading.
- A trendline break/retest.
- Buying/selling tails – essentially we look for a cluster of very obvious spikes off of lower timeframe support and resistance levels within the higher timeframe zone.
- Candlestick patterns. We tend to only stick with pin bars and engulfing bars as these have proven to be the most effective.
For us, lower timeframe confirmation starts on the M15 and finishes up on the H1, since most of our higher timeframe areas begin with the H4.
EUR/USD:
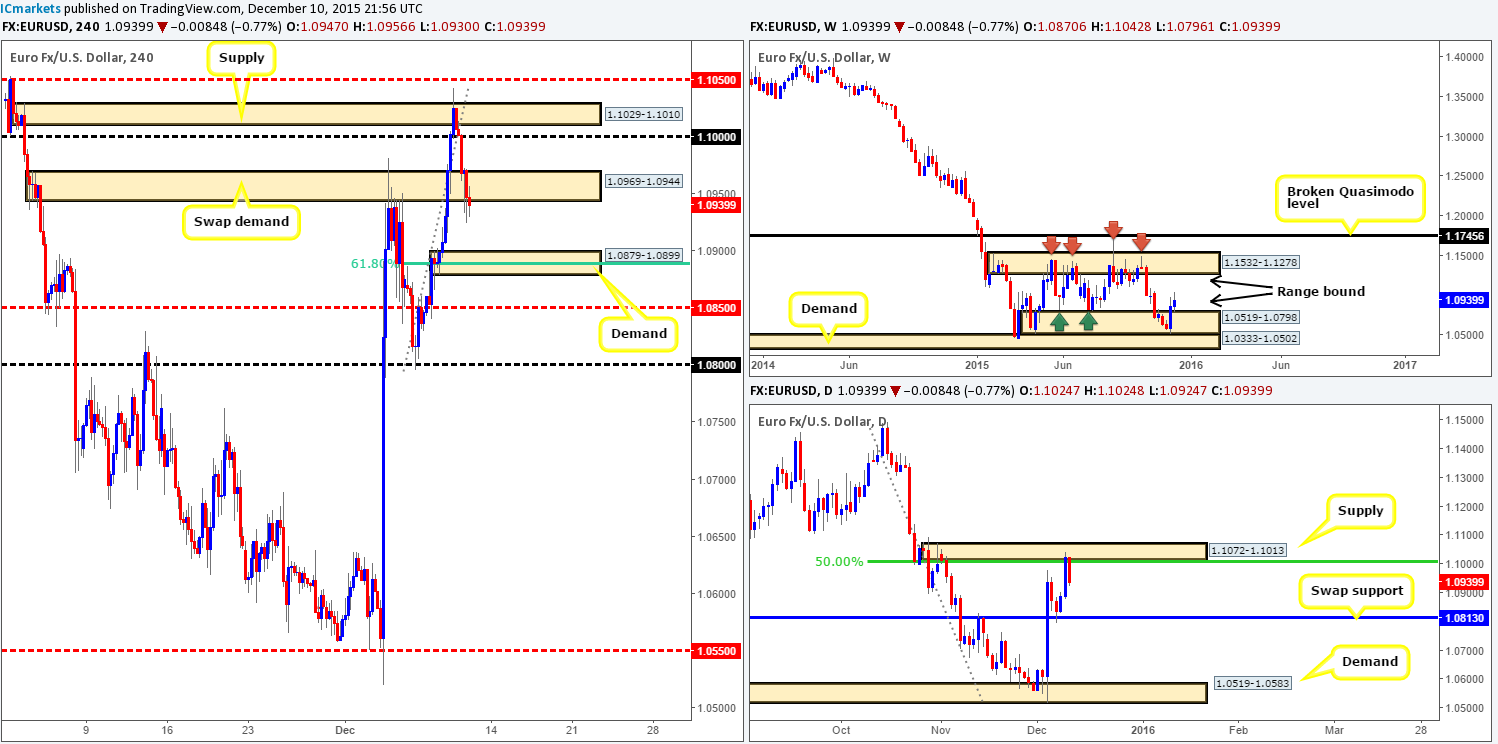
The EUR/USD pair came under pressure during the early hours of European trade yesterday forcing price below psychological support 1.1000 (seen on the H1). The bearish attack continued going into London, consequently pushing this market into bids around a H4 swap (demand) area sitting at 1.0969-1.0944.Technically, at least from the daily angle, the above should come as no surprise since price was, at that time, trading from supply drawn from 1.1072-1.1013 (converges with 50.0% Fibonacci level at 1.1011).
Going forward, nevertheless, the single currency still appears relatively well-bid from the weekly range demand at 1.0519-1.0798. Despite this, bids from the H4 swap demand at 1.0969-1.0944 have likely weakened and stop-loss orders triggered, thus potentially opening the gates for price to challenge bids aroundH4 demand at 1.0879-1.0899 (merges with both psychological support 1.0900 and the widely-respected 61.8% Fibonacci level)making this is a key zone to watch for a confirmed buy from today. Waiting for confirmation is highly recommended here simply because of the above said daily supply holding firm.
Levels to watch/live orders:
- Buys: 1.0879-1.0899 [Tentative – confirmation required] (Stop loss: dependent on where one confirms this area but would more than likely be around the 1.0874 region).
- Sells: Flat (Stop loss: N/A).
GBP/USD:
Recent action saw Cable sink against the U.S. dollar following the BoE’s decision to leave monetary policy unchanged. This resulted in price filling our sell limit order at 1.5198 and dropping to our first take-profit area at H4 swap demand (1.5155-1.5130), where we took 50% profit and moved our stop to breakeven. The remaining 50% of the position will be liquidated when or indeed if price reaches psychological support 1.5100.
Although price responded well to the lower limits of our green sell zone (1.5200/1.5238) yesterday, should price change tracks and rally today bringing the Pound higher into the above said sell zone, there may be a second opportunity to short this market (with confirmation this time however). As we mentioned yesterday, this zone not only boasts a symmetrical H4 AB=CD bear pattern completing around the 1.5218 region, it also has trendline resistance taken from the swing high 1.5401 and a deep 78.6% Fibonacci resistance seen at 1.5239.
However, before taking a trade within the above said zone guys, remain aware that there is little (obvious) weekly resistance supporting this market until around weekly supply coming in at 1.5506-1.5305. The only higher timeframe confluence this H4 area has, as far as we see now, is the stops above the swap supply area on the daily timeframe at 1.5198-1.5154. Remember, the stop losses above this zone automatically become buy orders once filled, thus giving well-funded traders liquidity to sell into!

Levels to watch/ live orders:
- Buys: Flat (Stop loss: N/A).
- Sells: 1.5198 [LIVE] (Stop loss: breakeven).
AUD/USD:
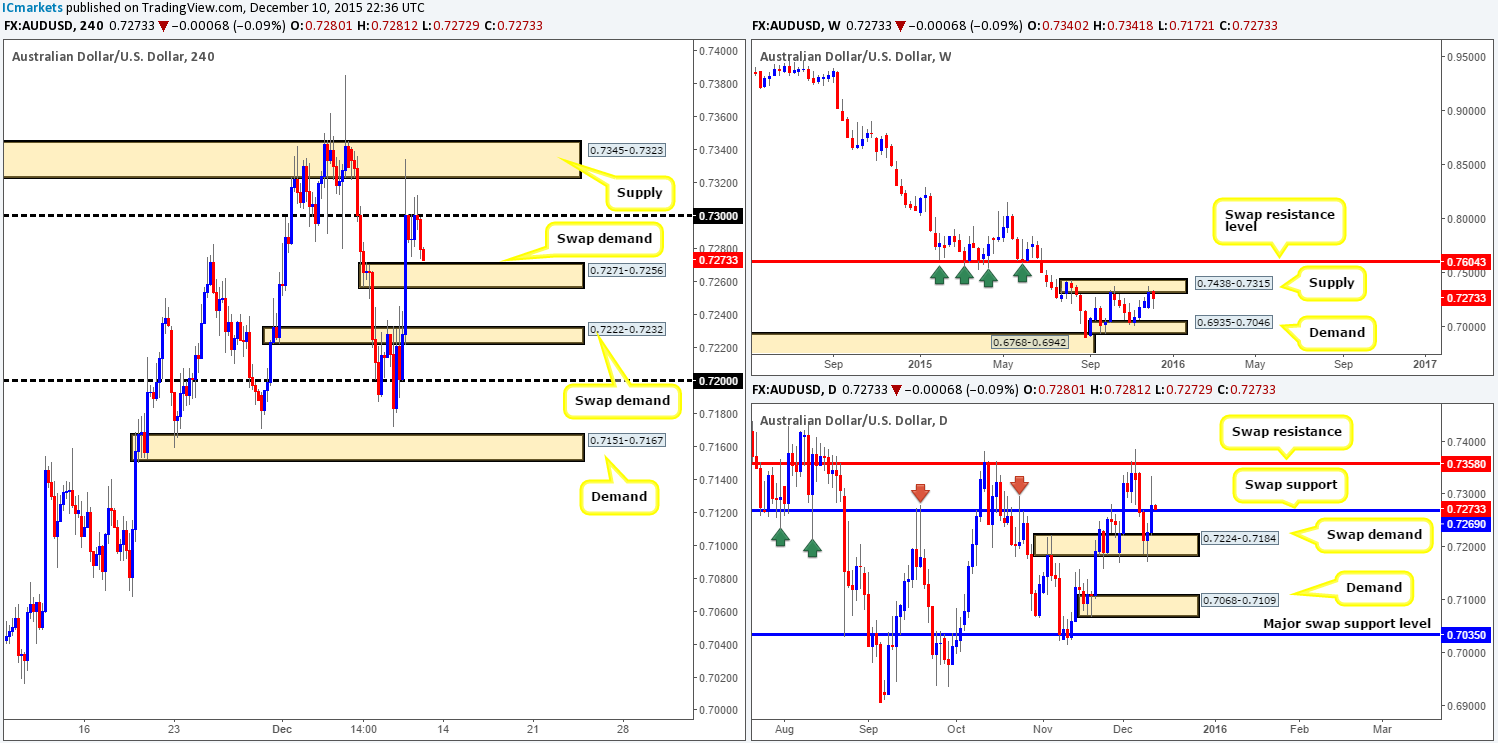
The value of the Aussie dollar increased in value in aggressive fashion during the early hours of Thursday’s sessions, following the Australian economy adding 71.4k jobs in the month of November versus a 10.0k expected decline. This near 100-pip advance took out H4 supply (now demand) at 0.7271-0.7256, and ended with price violently faking above psychological resistance 0.7300 into the jaws of H4 supply coming in at 0.7345-0.7323.
In view of 0.7300 holding firm right now and price looking to cross swords with the H4 swap demand at 0.7271-0.7256, what direction do we see this pair heading today? Well, this swap demand base has the backing of a swap support level at 0.7269 on the daily timeframe, so prices could very well bounce from here. In spite of this though, we must not lose sight of the fact that weekly action is still coming off of a supply area seen at 0.7438-0.7315. Therefore, if one plans to buy from the current H4 swap demand, we’d only do so with confirming support from the lower timeframes, and would make sure to take full profits at 0.7300 since it’s the last day of the trading week.
A cut through the current H4 swap demand, however, likely leaves the path open for prices to challenge the H4 swap demand below it at 0.7222-0.7232. Selling the break here is not something we’d stamp high probability no matter where the higher timeframe action is positioned due to the poor risk/reward on offer here.
Levels to watch/ live orders:
- Buys: 0.7271-0.7256[Tentative – confirmation required] (Stop loss: dependent on where one confirms this area).
- Sells:Flat (Stop loss: N/A).
USD/JPY: (Slightly revised)
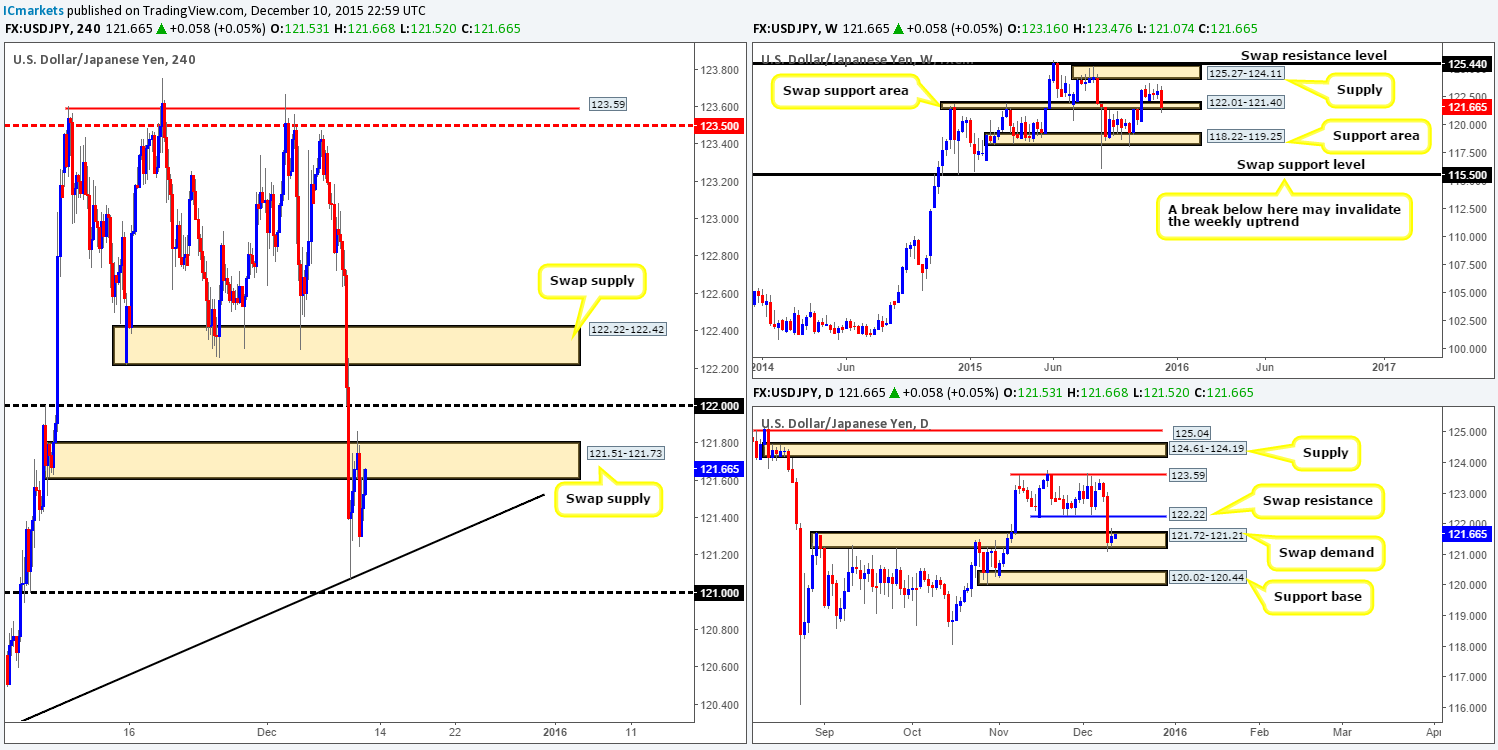
Following the rebound from the H4 trendline extended from the low 120.33 on Wednesday, price attacked offers around a H4 swap supply yesterday at 121.51-121.73, pushing prices to lows of 121.24 on the day. In spite of this, the bulls are once again chewing at the underside of this area. This, at least form a technical standpoint, should not really come as much of a surprise, since both the weekly and daily structures show price trading within supportive areas right now (122.01-121.40/121.72-121.21).
With this being the case, our team remains in favor of the buy-side of this market today at least until psychological resistance 122.00, which sits just below daily swap resistance at 122.22. Unfortunately, however, there is little opportunity to buy into this pair on the H4 at the moment. Even with a break above the current H4 swap supply, we’re left with a mere 25 pips room for profit until 122.00 is hit. Therefore, pretty much the same as yesterday’s report, we’ll remain on the sidelines for now and wait for further developments next week.
Levels to watch/ live orders:
- Buys: Flat (Stop loss: N/A).
- Sells: Flat (Stop loss: N/A).
USD/CAD:
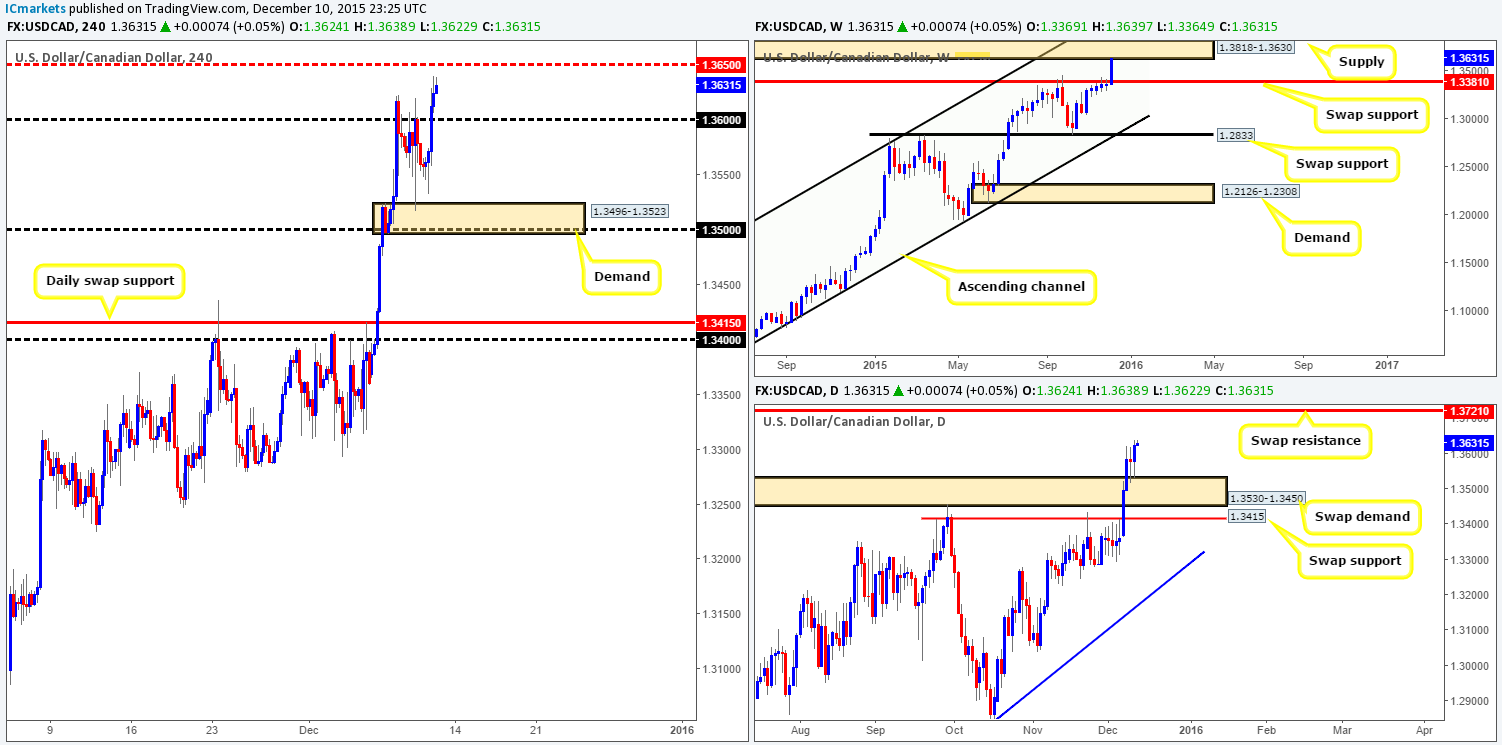
Starting from the top this morning, we can now see weekly action is crossing paths with supply at 1.3818-1.3630. Meanwhile, down on the daily chart, price recently closed above supply at 1.3530-1.3450 and retested this beauty as demand. In the event that this upside momentum continues, which we think it will considering the state oil is in right now, we’ll be eyeing the swap resistance level coming in at 1.3721.
Stepping down to the H4, however, price came very close to retesting demand at 1.3496-1.3523 (a noted area to look for confirmed buys in our previous report), before rallying and taking out psychological resistance 1.3600 by the day’s end.
Quite frankly, the only logical path we see right now is north. Look at it this way… Price recently bounced from a daily swap demand with room to appreciate (see above), coupled with the overall trend remaining strong. In any case, by entering long into this market, we’re not looking for price to break above the current weekly supply, just drive a little higher into it to connect with the above said daily swap (resistance) level.
Given the points made above, our team is looking to buy any retracement seen into support today on the H4. 1.3600 looks a nice base to begin with. Additionally, a break above and retest of the mid-level number 1.3650 could also be a nice platform in which to look for longs. Just to be clear here guys, buying this market will only be permitted should lower timeframe confirmation be seen at the above said supports.
Levels to watch/ live orders:
- Buys:1.3600[Tentative – confirmation required] (Stop loss: dependent on where one confirms this level). Watch for offers to be consumed around 1.3650 and then look to trade any retest seen at this level (confirmation required).
- Sells: Flat (Stop loss: N/A).
USD/CHF:
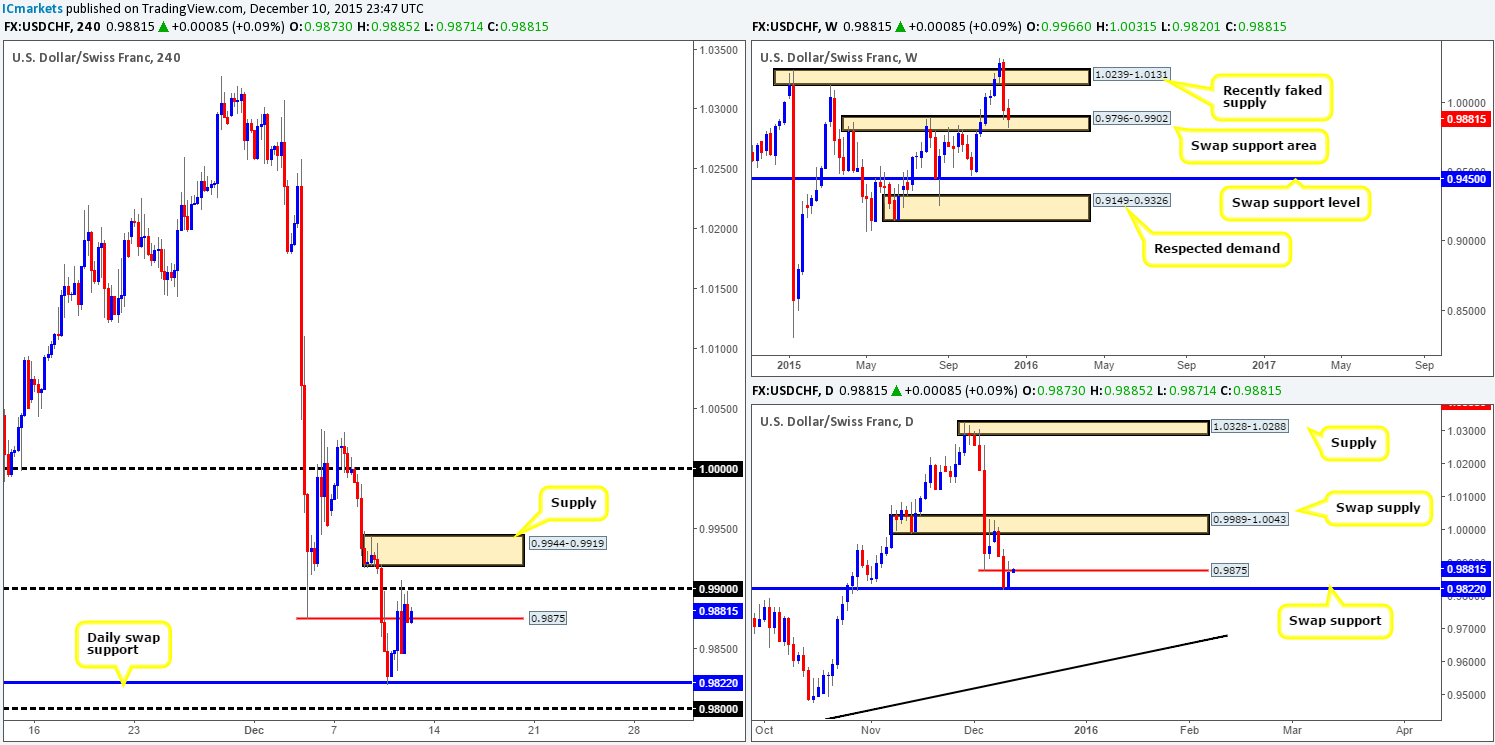
For those who read our previous report on the Swissy (http://www.icmarkets.com/blog/thursday-10th-december-keep-an-eye-on-cable-and-the-u-s-dollar-from-midday-onwards-today-volatility-expected), you may recall us mentioning to keep an eye out for lower timeframe buy entries around the daily swap (support) level at 0.9822. As can be seen from the H4 chart, a bullish reaction was seen from this barrier… We do hope some of our readers managed to lock in some green pips from this move, and have left some of their position in the market to run! Reason for why is we expect prices to continue appreciating from here due to the buyers and sellers currently battling for position within a weekly swap (support) area at 0.9796-0.9902.
However, before any further movement can be seen north, price will need to close above 0.9875 – a swap resistance level seen on the H4, but also visible on the daily picture. For anyone currently long from 0.9822, partial profits should have already been taken around 0.9875/0.9900 and your stop moved to breakeven. As for adding to your position, we would wait until the H4 supply at 0.9944-0.9919 is taken out since the path north would then likely be clear up to around parity (coincides nicely with a daily swap (supply) zone drawn from 0.9989-1.0043), which is where our final take-profit level would be.
Levels to watch/ live orders:
- Buys: Flat (Stop loss: N/A).
- Sells: Flat (Stop loss: N/A).
DOW 30
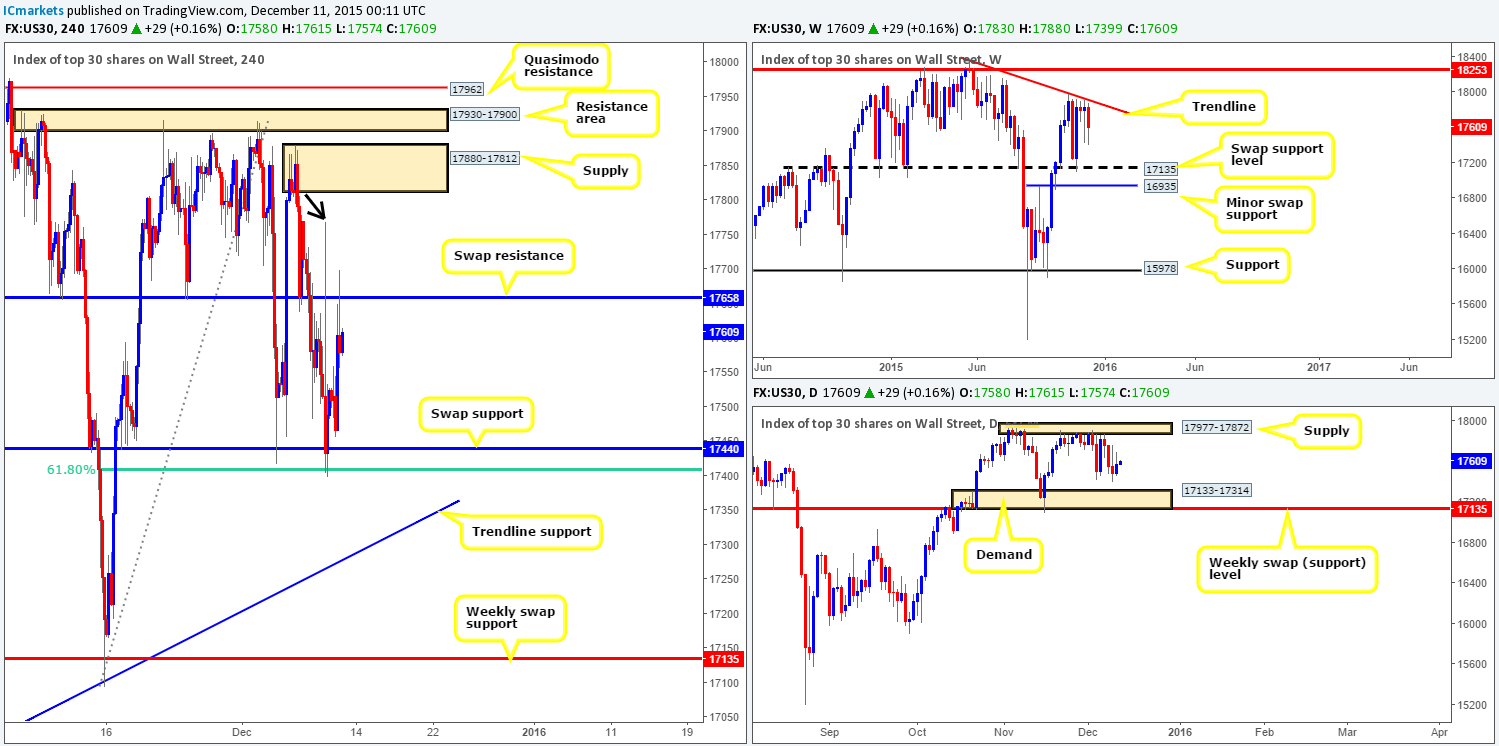
Following the rebound from the H4 swap (support) level at 17440 (merges nicely with the 61.8% Fibonacci level at 17407), the DOW rallied to touch base with a H4 swap (resistance) level at 17658. This recent movement, as you can probably see, has begun to carve out a consolidation band between the two barriers. Therefore, do keep an eye on these two opposing levels today for possible confirmed entries to trade into the range.
A break above this consolidation, however, could prompt an upside move towards H4 supply at 17880-17812 (nice sell zone to keep an eye on for potential shorts), due to a large H4 wick marked with a black arrow at 17768 likely consuming the majority of offers within this region already. Conversely, should a break lower be seen, then the H4 trendline drawn from the low 16889 would likely be the next objective to reach.
In our opinion, a break lower is more likely. Our reasoning for why lies within the higher timeframe structure… Weekly movement continues to sell-off from the underside of a trendline resistance extended from the high 18365, with the next downside target coming in at 17135 – a swap support barrier. By the same token, down on the daily timeframe, we can see room for price to continue lower until demand seen at 17133-17314 (sits on top of the above said weekly swap [support] level).
In the event that our analysis is correct, and we do eventually see this index push lower, we’ll then be eyeing the H4 trendline (mentioned above) for potential longs. We like this trendline simply because it converges beautifully with daily demand seen at 17133-17314. Waiting for the lower timeframes to confirm strength exists here, however, might be the best path to take since trendlines are, in our humble opinion, not the most stable of lines to trade from.
Levels to watch/ live orders:
- Buys: 17440[Tentative – confirmation required] (Stop loss: dependent on where one confirms this level). H4 trendline drawn from the low 16889 [Tentative – confirmation required] (Stop loss: dependent on where one confirms this line).
- Sells: 17658 [Tentative – confirmation required] (Stop loss: dependent on where one confirms this level). 17880-17812[Tentative – confirmation required] (Stop loss: dependent on where one confirms this area).
XAU/USD: (Gold)
The precious metal had a relatively quiet round of trading yesterday, with little movement being recorded. That being the case, much of the following analysis will remain the same as the previous report…
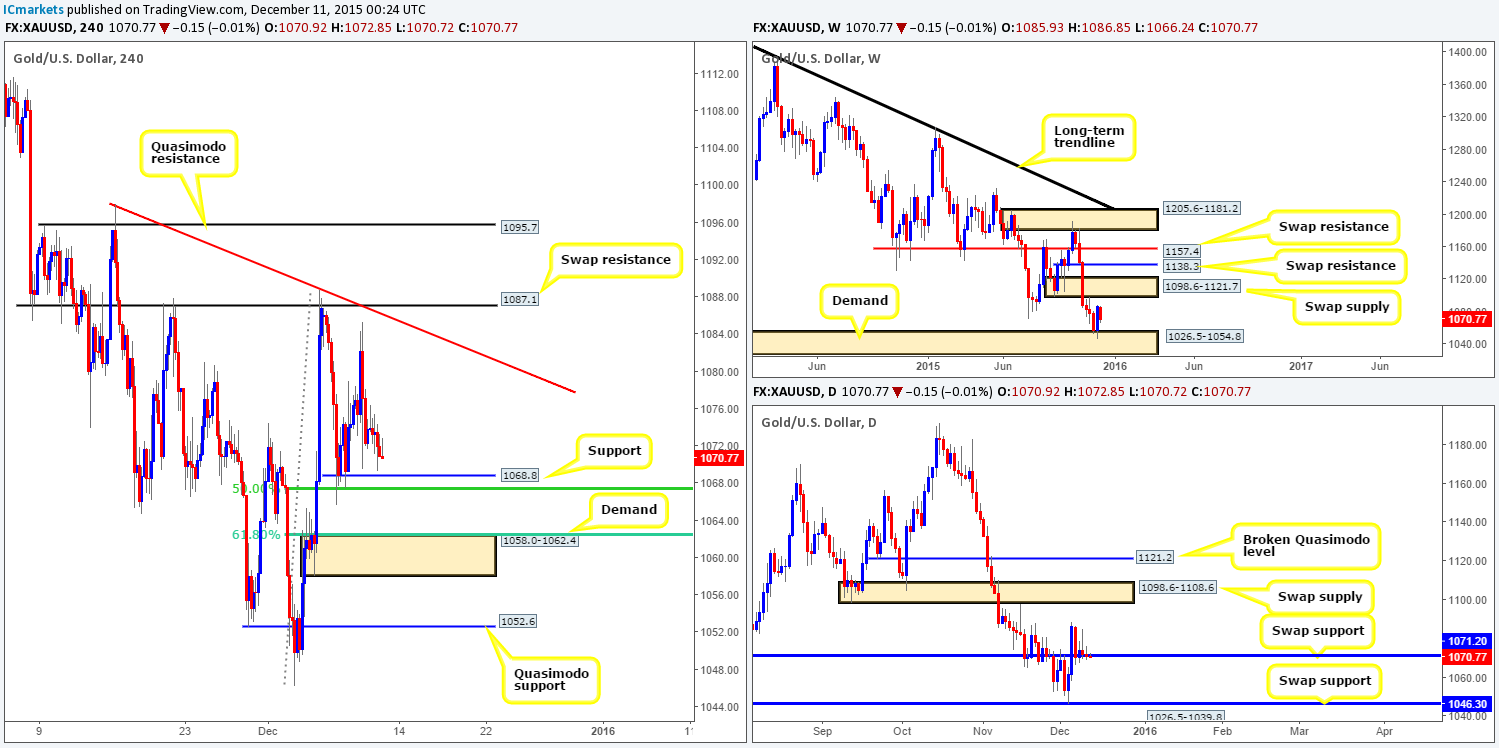
Consequent to price still hovering just above H4 support at 1068.3 (boasts a 50.0% Fibonacci level just below it at 1067.3), all eyes remain on this barrier, as well as the H4 demand below it at 1058.0-1062.4 (also boasts a 61.8% Fibonacci level at 1062.0). Supporting these areas, daily action is presently hovering around a swap (support) level coming in at 1071.2 that’s held firm since Monday. Granted, the H4 demand is positioned a little below this level, which may cause problems for some traders. For us, however, this is perfect as it could provide well-funded traders a base in which to fake below the current daily swap (support) level.
Nevertheless, we would highly recommend NOT placing pending buy orders at the above said H4 zones and only trading should lower timeframe confirmation be seen, since weekly action is currently loitering in no-man’s-land between demand at 1026.5-1054.8 and a swap supply zone at 1098.6-1121.7.
Levels to watch/ live orders:
- Buys: 1068.8 [Tentative – confirmation required] (Stop loss: dependent on where one confirms this level). 1058.0-1062.4 [Tentative – confirmation required] (Stop loss: dependent on where one confirms this area).
- Sells: Flat (Stop loss: N/A).


