Waiting for lower timeframe confirmation is our main tool to confirm strength within higher timeframe zones, and has really been the key to our trading success. It takes a little time to understand the subtle nuances, however, as each trade is never the same, but once you master the rhythm so to speak, you will be saved from countless unnecessary losing trades. The following is a list of what we look for:
- A break/retest of supply or demand dependent on which way you’re trading.
- A trendline break/retest.
- Buying/selling tails/wicks – essentially we look for a cluster of very obvious spikes off of lower timeframe support and resistance levels within the higher timeframe zone.
We typically search for lower-timeframe confirmation between the M15 and H1 timeframes, since most of our higher-timeframe areas begin with the H4. Stops are usually placed 1-3 pips beyond confirming structures.
EUR/USD:
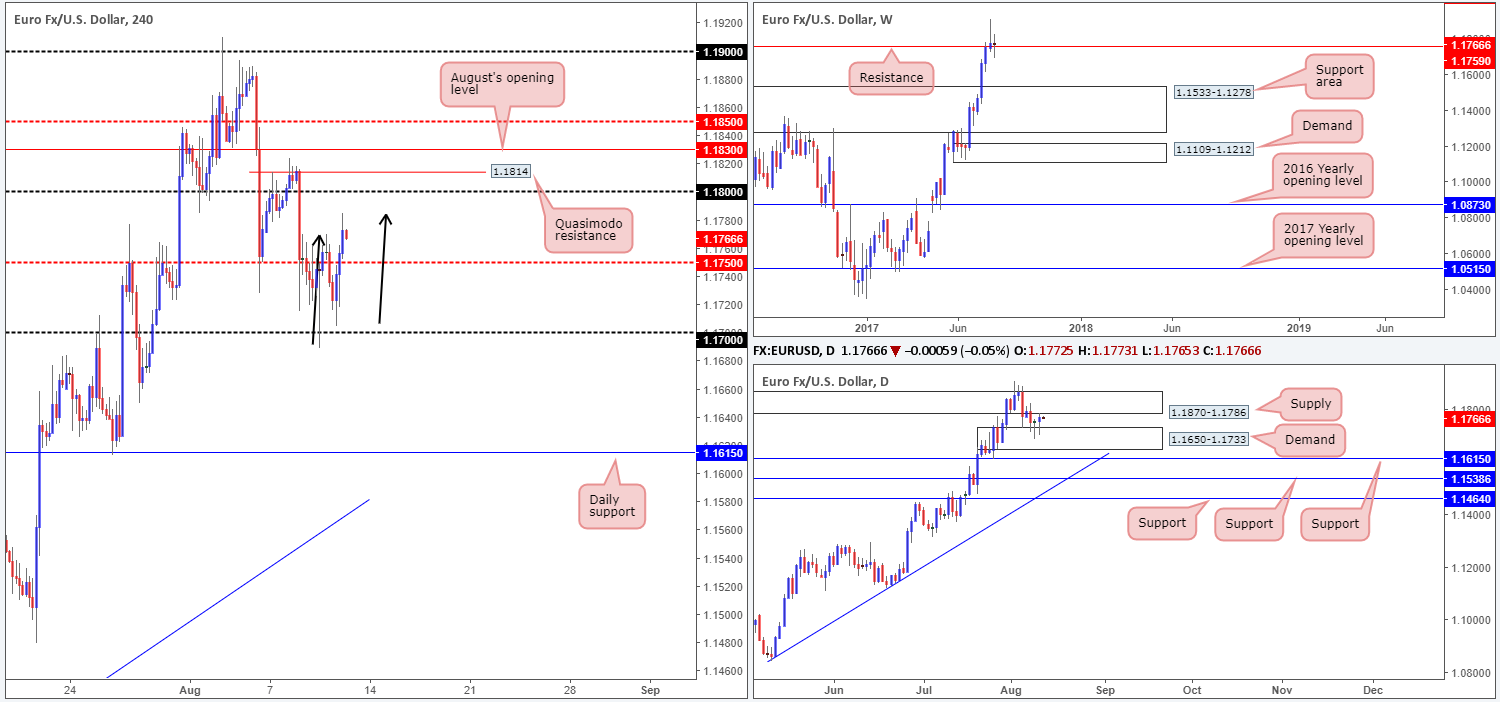
Thanks to a healthy bout of buying from just ahead of the 1.17 neighborhood on Thursday, the EUR ended the day closing back above the H4 mid-level resistance pegged at 1.1750. Traders may have also noticed that the recent bid helped form a nice-looking H4 AB=CD bearish formation that completes around the 1.1785ish range (see black arrows).
Selling this Harmonic pattern may be appealing to some, given that daily price is also seen trading within striking distance of a supply noted at 1.1870-1.1786. Be that as it may, there are a few cautionary points you may want to consider:
- The EUR has (and still is) entrenched within a strong uptrend.
- The aforementioned daily supply suffered multiple breaks to the upside last week, thus potentially weakening the zone.
- A sell on the H4 places you in direct conflict with the 1.1750 line.
- Weekly price is currently trading above resistance at 1.1759.
Our suggestions: On account of the above points, selling this market is a risk that we’re just not willing to take at the moment.
Although we’re against selling, we’re also not too fond of buying this market either. Buying into an AB=CD completion and a daily supply (despite its condition) is not something our team would label high probability.
Data points to consider: US Inflation figures scheduled for release at 1.30pm, followed closely by FOMC members Kaplan and Kashkari taking the stage at 2.40/4.30pm GMT+1.
Levels to watch/live orders:
- Buys: Flat (stop loss: N/A).
- Sells: Flat (stop loss: N/A).
GBP/USD:
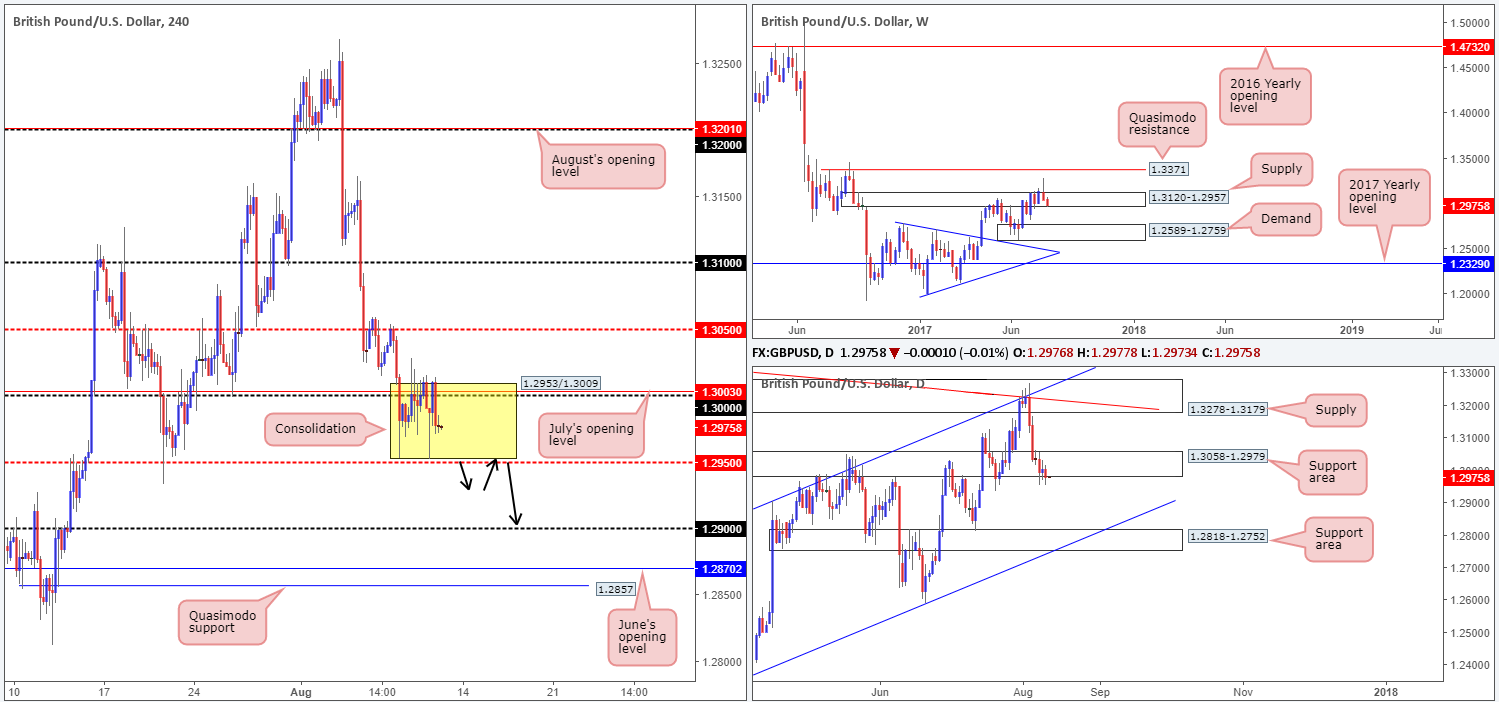
As can be seen from the H4 chart this morning, the GBP/USD appears to be in the process of chiseling out a small consolidation between 1.2953/1.3009. Supporting the top edge of this area is a large psychological band at 1.30 as well as July’s opening level seen at 1.3003. Bolstering the lower edge, however, we have a H4 mid-level support coming in at 1.2950.
Over on the bigger picture, weekly sellers remain defensive from within the walls of supply drawn in at 1.3120-1.2957. Down on the daily timeframe, the support area seen at 1.3058-1.2979 is, in our opinion, now vulnerable to the downside. Not only do we have weekly sellers coercing price lower here, there has also been little to no bullish intent registered here since the area came into play. The next downside target on this timeframe does not come into view until we reach a support area at 1.2818-1.2752, which happens to be glued to the top edge of weekly demand at 1.2589-1.2759 (the next area of interest on the weekly chart) and converges beautifully with a channel support etched from the low 1.2365.
Our suggestions: The H4 range is likely going to suffer a break to the downside either today or early next week, given the bearish tone being painted on the higher timeframes right now. To that end, we’re watching for a H4 close to print below the current range. This – coupled with a successful retest would, in our humble view, be enough evidence to suggest a move down to the 1.29 handle, followed closely by June’s opening line at 1.2870/H4 Quasimodo support at 1.2857.
Data points to consider: US Inflation figures scheduled for release at 1.30pm, followed closely by FOMC members Kaplan and Kashkari taking the stage at 2.40/4.30pm GMT+1.
Levels to watch/live orders:
- Buys: Flat (stop loss: N/A).
- Sells: Watch for H4 price to close below the 1.2950 region and then look to trade any retest seen thereafter ([waiting for a reasonably sized bearish candle to form following the retest – in the shape of either a full, or near-full-bodied candle – is advised] stop loss: ideally beyond the candle’s wick).
AUD/USD:
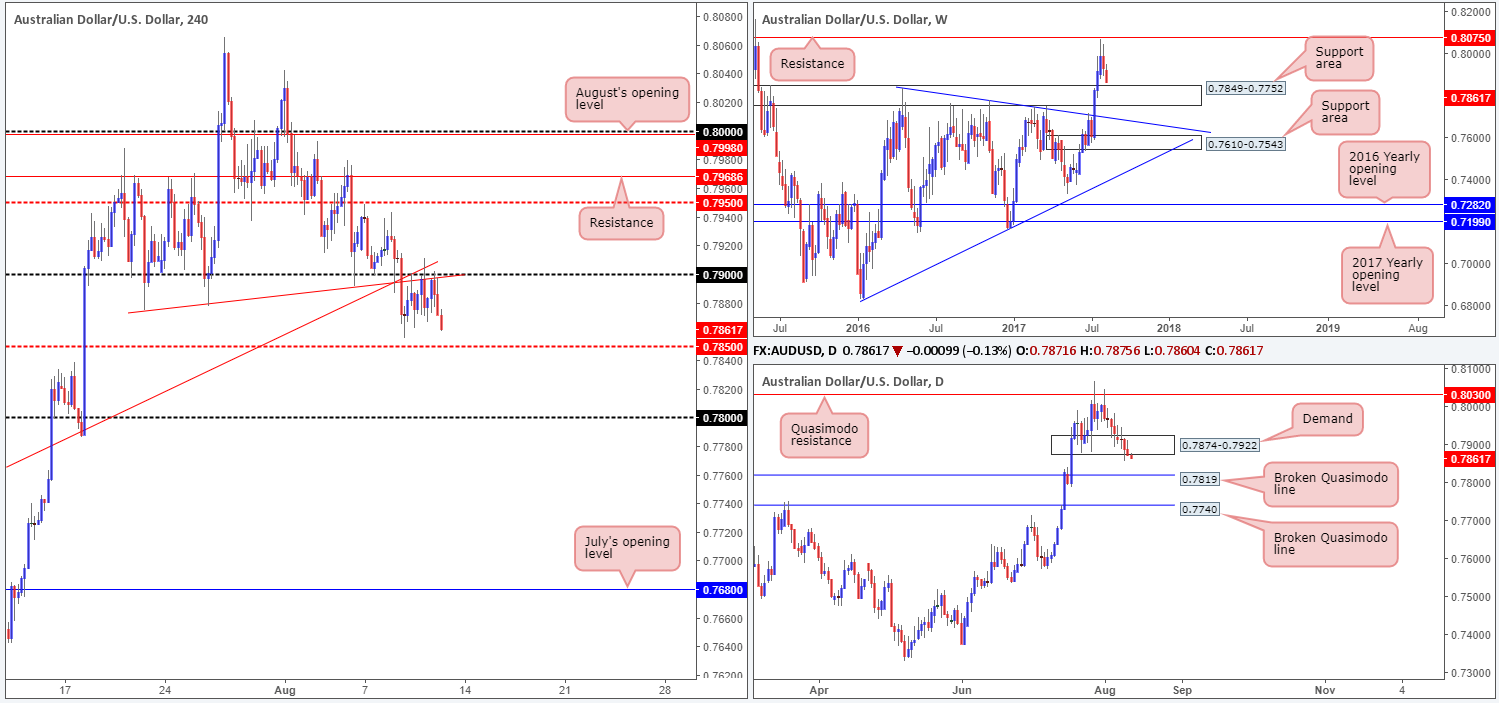
Kicking this morning’s analysis off with a quick look at the weekly timeframe, we can see that price is currently trading within striking distance of a major support area at 0.7849-0.7752. With this area having been a strong zone of resistance in the past, a bullish response will likely be seen from this region. In conjunction with weekly flow, daily demand at 0.7874-0.7922 appears incredibly vulnerable at the moment. Further selling from here will likely bring the unit down to a broken daily Quasimodo line drawn from 0.7819, which is planted around the top edge of the noted weekly support area.
Across on the H4 timeframe, Aussie bears remain defensive around the 0.79 handle. What gives this number extra credibility is the two H4 trendline resistances (0.7874/0.7635). A close below the nearby H4 mid-level support at 0.7850 today will likely open up the trapdoor down to the aforesaid broken daily Quasimodo line, and maybe even the 0.78 handle.
Our suggestions: Should the unit continue to decline in value, we’ll then be eyeing the 0.7819/0.78 region for potential long opportunities. Given that psychological boundaries such as 0.78 attract stop hunts, we’re going to wait and see if additional H4 candle confirmation is seen before committing to a position here. In the event that a trade comes to fruition, we’ll look to reduce risk to breakeven around the 0.7850 range and take partial profits at 0.7874 (the underside of the current daily demand).
Data points to consider: US Inflation figures scheduled for release at 1.30pm, followed closely by FOMC members Kaplan and Kashkari taking the stage at 2.40/4.30pm GMT+1.
Levels to watch/live orders:
- Buys: 0.78/0.7819 region ([waiting for a H4 bullish candle, preferably a full, or near-full-bodied candle, to form is advised] stop loss: ideally beyond the candle’s tail).
- Sells: Flat (stop loss: N/A).
USD/JPY:
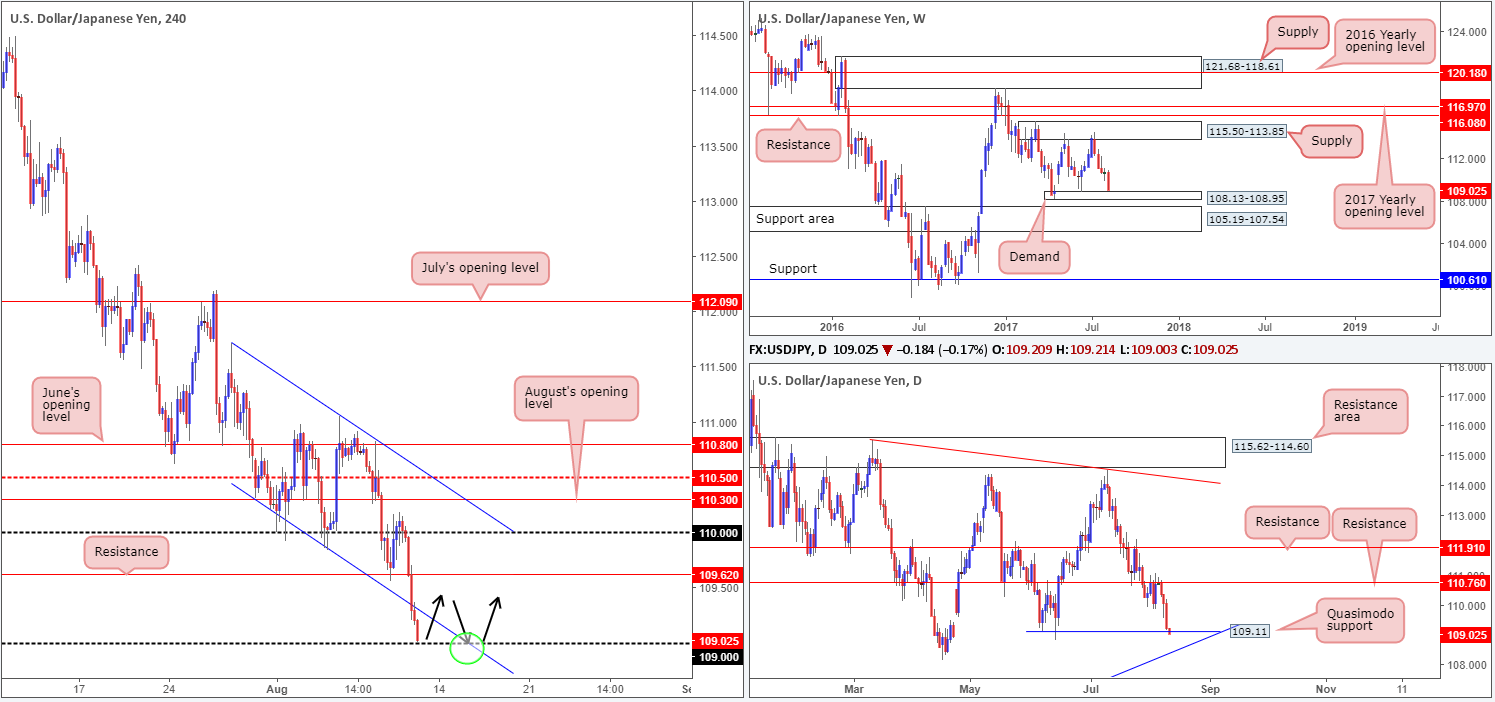
Risk-off conditions, as you can see, continue to support the Japanese yen. The currency also gained momentum following the release of July’s US PPI figures on Thursday, which came in lower than expected. This bearish run, however, could be tested today.
On the weekly timeframe, demand at 108.13-108.95 is now seen within shouting distance. In addition to this, a daily Quasimodo support was recently brought into the picture at 109.11, alongside the 109 handle printed on the H4 timeframe.
Our suggestions: Collectively, all three timeframes show structure suggesting a buy in this market today. The question is how does one go about finding an entry? Simply clicking the buy button, in our opinion, just won’t do given the strength of the approach seen into the above said supports.
Personally, for us to commit to a long from 109, we would want to see H4 price break back into the nearby channel edge taken from the low 110.30, and then retest 109 again as support (as per the black arrows). Ultimately, we’d be looking to target 109.62 initially, followed by the 110 handle which converges with a H4 channel resistance taken from the high 111.71.
Data points to consider: US Inflation figures scheduled for release at 1.30pm, followed closely by FOMC members Kaplan and Kashkari taking the stage at 2.40/4.30pm GMT+1.
Levels to watch/live orders:
- Buys: 109 region ([waiting for a H4 bullish candle, preferably a full, or near-full-bodied candle, to form is advised] stop loss: ideally beyond the candle’s tail).
- Sells: Flat (stop loss: N/A).
USD/CAD:
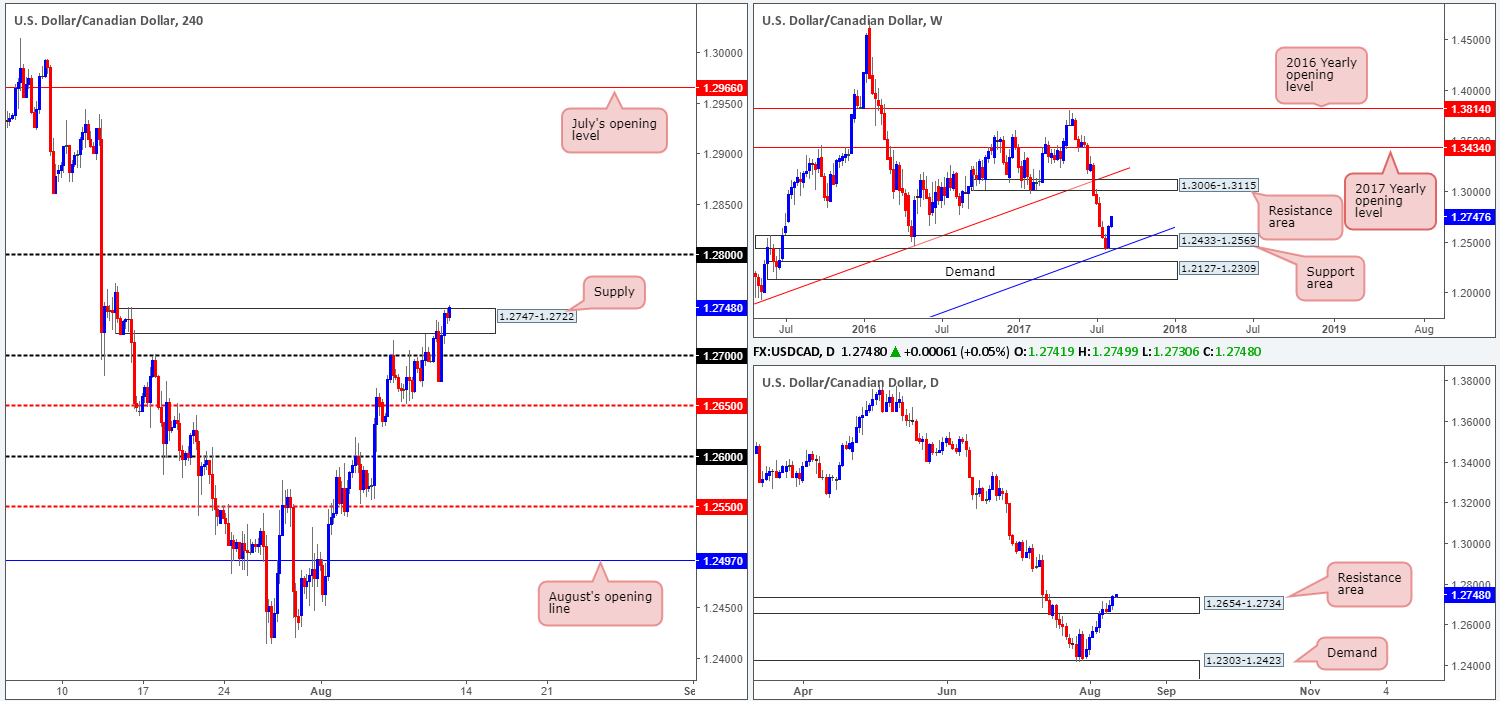
Trade update: small loss taken at 1.2723 – see Thursday’s report for details.
The USD/CAD came under strong selling pressure from H4 supply at 1.2747-1.2722 in early US trading on Thursday. Although the move forced the pair below the 1.27 handle, there was little follow through generated. In fact, immediately after the bearish close registered, price was heavily bid back above 1.27 and driven into the upper extremes of the said H4 supply.
In view of the marginal close seen above the daily resistance area at 1.2654-1.2734, and the strong bullish sentiment seen on the weekly timeframe from the support area at 1.2433-1.2569, we feel further buying may be on the cards today, next week.
Our suggestions: Ultimately, what we’re looking for is a decisive H4 close above the current H4 supply. This, alongside a retest would, in our view, be a valid buy signal especially considering that both weekly and daily action show room to extend much, much higher. The first area of concern, should a trade come to fruition, would be the 1.28 handle.
Data points to consider: US Inflation figures scheduled for release at 1.30pm, followed closely by FOMC members Kaplan and Kashkari taking the stage at 2.40/4.30pm GMT+1.
Levels to watch/live orders:
- Buys: Watch for H4 price to close above the current H4 supply and then look to trade any retest seen thereafter ([waiting for a reasonably sized bullish candle to form following the retest – in the shape of either a full, or near-full-bodied candle – is advised] stop loss: ideally beyond the candle’s tail).
- Sells: Flat (stop loss: N/A).
USD/CHF:
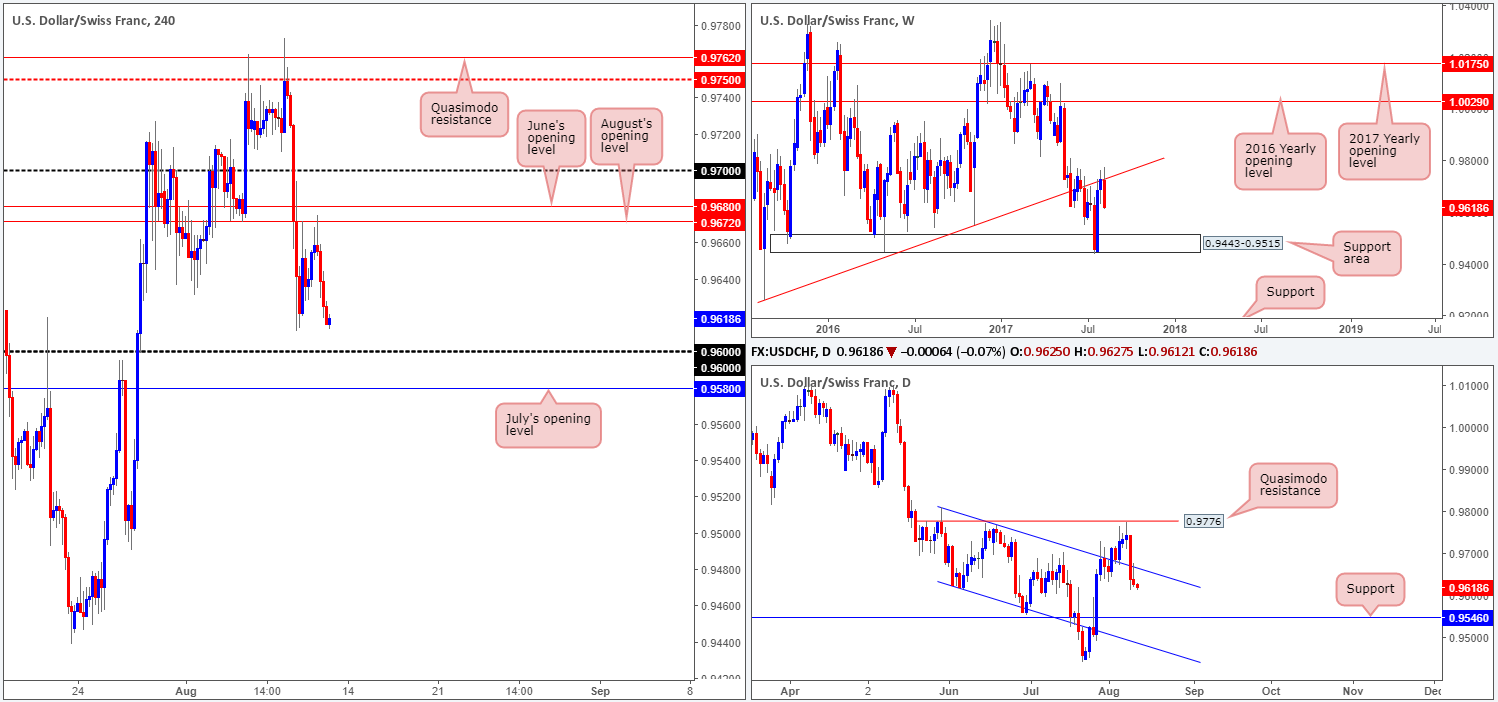
For those who read Thursday’s report on the USD/CHF, you may recall our desk placing emphasis on June and August’s opening levels at 0.9680/0.9672 as a potential area to sell. As you can see, price reacted beautifully to this zone, and even chalked up a nice-looking H4 bearish pin bar. Well done to any of our readers who jumped aboard this move.
Technically speaking, the next hurdle on the hit list will likely be the 0.96 handle, followed closely by July’s opening level at 0.9580. However, according to the weekly and daily timeframes, we could be looking at trading lower than these two structures, as the next area of support on the weekly chart comes in at 0.9443-0.9515, with a daily support seen pegged a little higher at 0.9546.
Our suggestions: Despite the higher timeframes suggesting lower prices, we would advise against selling into the 0.96 handle and nearby July opening level. The bounce from these structures could place you in unnecessary drawdown. Waiting for a break below these levels, therefore, could be an option, but by doing so you’re left with little room to maneuver as the daily support mentioned above sits at 0.9546!
Data points to consider: US Inflation figures scheduled for release at 1.30pm, followed closely by FOMC members Kaplan and Kashkari taking the stage at 2.40/4.30pm GMT+1.
Levels to watch/live orders:
- Buys: Flat (stop loss: N/A).
- Sells: Flat (stop loss: N/A).
DOW 30:
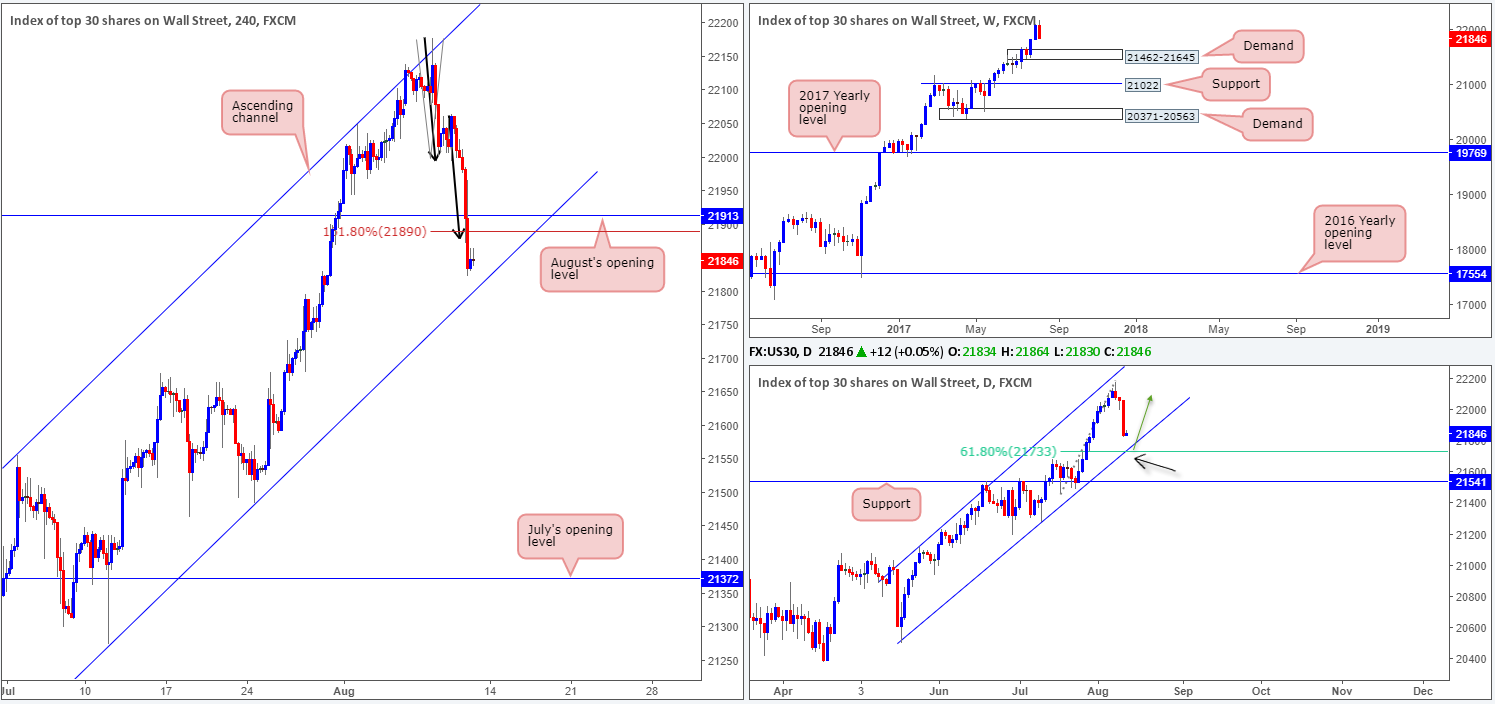
The US equity market ended the day recording a rather substantial loss amid geopolitical issues between the US and North Korea. The index ran through August’s opening level at 21913 and also took out the H4 AB=CD 161.8% Fib ext. point at 21890.
On the H4 timeframe, we can also see that to the downside we have a nearby channel support extended from the low 21273. More importantly, however, there’s a nearby DAILY channel support seen just below this which has been drawn from the low 20494. Given how close together both channel supports are, and the fusing of a daily 61.8% Fib support at 21733 (taken from the low 21462), a bounce higher from this area is likely.
Our suggestions: In view of the technical landscape at the moment, we believe that the H4 channel support will likely suffer a minor fakeout, as traders may press for the daily channel support and its converging 61.8% Fib support for long opportunities.
Therefore, our plan of attack is simple: wait for H4 price to connect with the said daily channel line, and enter long on the basis of a reasonably sized H4 bull candle, preferably in the shape of a full, or near-full-bodied candle.
Data points to consider: US Inflation figures scheduled for release at 1.30pm, followed closely by FOMC members Kaplan and Kashkari taking the stage at 2.40/4.30pm GMT+1.
Levels to watch/live orders:
- Buys: 21733 region ([waiting for a H4 bullish candle to form, preferably either a full, or near-full-bodied candle, is advised] stop loss: ideally beyond the candle’s tail).
- Sells: Flat (stop loss: N/A).
GOLD:
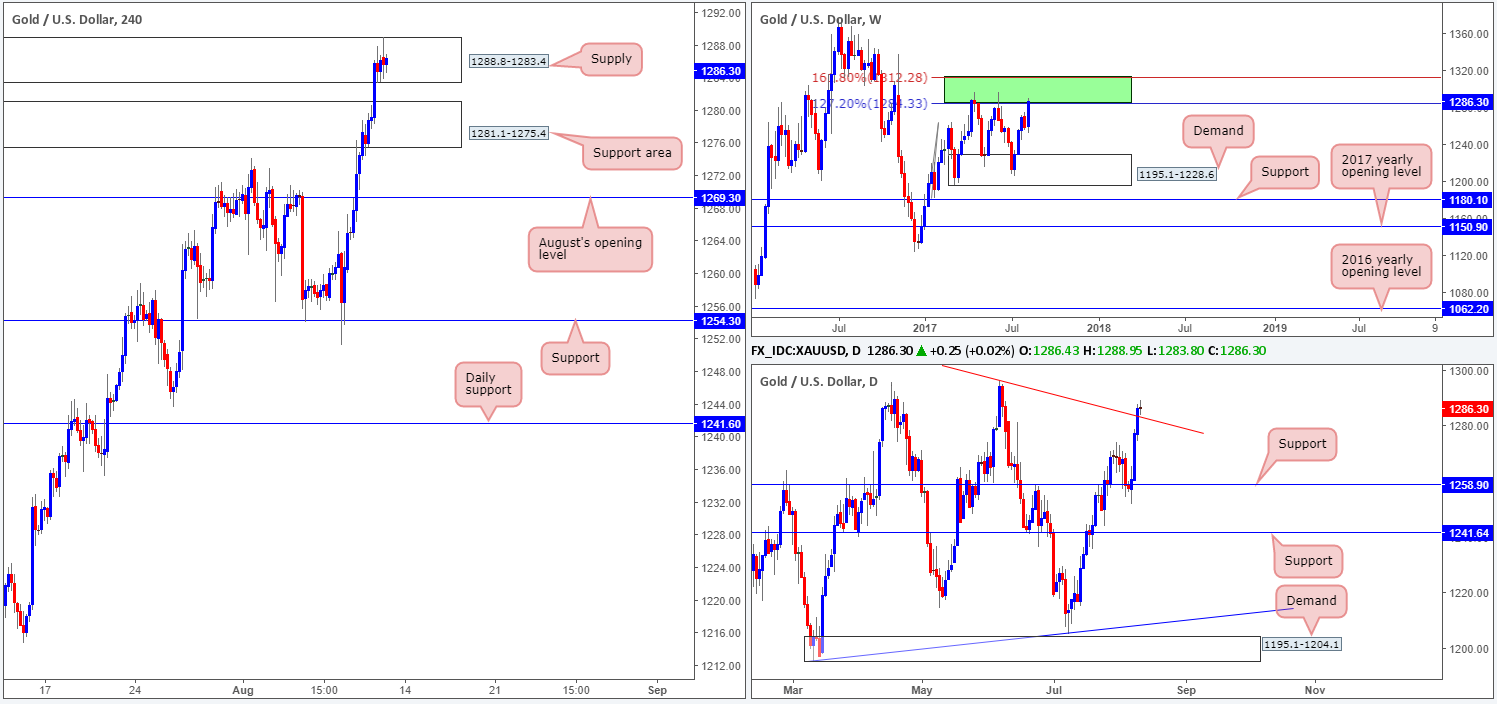
With the US dollar taking another hit to the mid-section, the yellow metal rose higher for a third consecutive day. This has brought the unit into an interesting area of weekly resistance (green zone) comprised of two Fibonacci extensions 161.8/127.2% at 1312.2/1284.3 taken from the low 1188.1. Weekly price has, as you can see, responded each time this area has been challenged, therefore there’s a chance that we may see history repeat itself here.
Down on the daily timeframe, nevertheless, yesterday’s move lifted price above a trendline resistance extended from the high 1337.3. This, at least on this scale, signals further upside could be on the horizon.
Bouncing over to the H4 candles, we can see that supply at 1281.1-1275.4 was recently taken out (now an acting support area) and saw the metal attack a nearby supply seen at 1288.8-1283.4.
Our suggestions: Judging the recent H4 candle action, sellers are active within the current supply. Whether they’re strong enough to halt buying is difficult to judge. On the one hand, weekly sellers may come into the picture today/early next week, but on the other hand a great deal of daily buyers saw the recent close above the trendline resistance and will be looking to buy.
Although we’re very tempted to begin hunting for sell opportunities in this market, we would prefer to see daily price close back below the said trendline resistance before taking that risk. Therefore, opting to wait on the sidelines may be the better path to take today.
Levels to watch/live orders:
- Buys: Flat (stop loss: N/A).
- Sells: Flat (stop loss: N/A).


