Waiting for lower timeframe confirmation is our main tool to confirm strength within higher timeframe zones, and has really been the key to our trading success. It takes a little time to understand the subtle nuances, however, as each trade is never the same, but once you master the rhythm so to speak, you will be saved from countless unnecessary losing trades. The following is a list of what we look for:
- A break/retest of supply or demand dependent on which way you’re trading.
- A trendline break/retest.
- Buying/selling tails/wicks – essentially we look for a cluster of very obvious spikes off of lower timeframe support and resistance levels within the higher timeframe zone.
We typically search for lower-timeframe confirmation between the M15 and H1 timeframes, since most of our higher-timeframe areas begin with the H4. Stops are usually placed 1-3 pips beyond confirming structures.
EUR/USD:
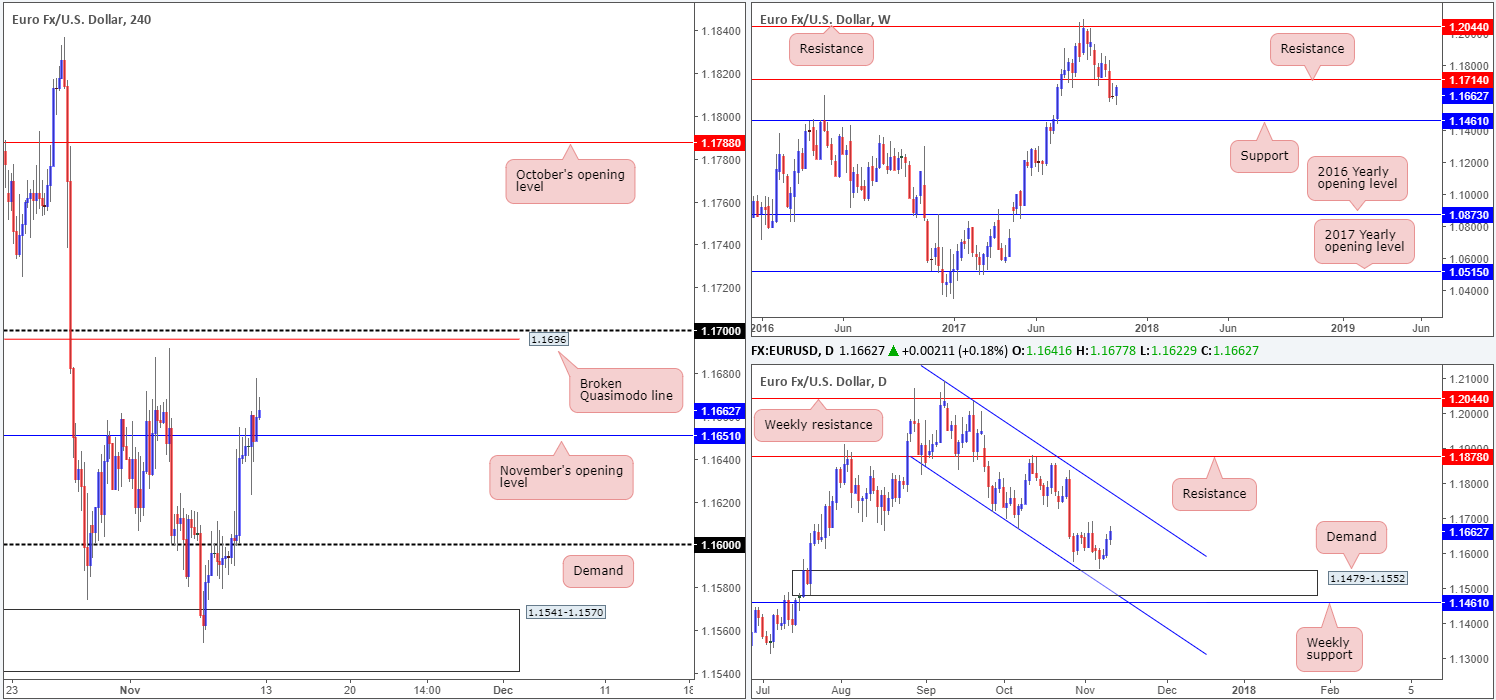
The euro is marginally stronger today after H4 price finally conquered the 1.16 handle. Bolstered by confirmation that Senate Republicans plan to propose delaying tax cuts to corporations until 2019, November’s opening level at 1.1615 elbowed its way into the spotlight, which, as you can see, was able to hold ground going into the closing bell.
For those who have been following our reports this week you may recall that we are currently long this market from the H4 demand area at 1.1541-1.1570. The idea behind selecting this base as a potential buy zone was simply due to the area being positioned over the top of a daily demand area seen at 1.1479-1.1552.
Our buy order was filled at 1.1567, and the stop was positioned a few pips below the aforesaid H4 demand area at 1.1540. As 1.16 was touched on Wednesday, our first take-profit target, the team decided to reduce risk to breakeven and bank some profits. Thursday’s advance, however, brought the unit up to our second take-profit zone: November’s opening level at 1.1651, where further profits have been banked and the stop-loss order moved up to 1.1595.
Suggestions: Continue to hold the current buy position. The 1.17 handle is the final take-profit line, which happens to be positioned a few pips beneath weekly resistance at 1.1714.
Should you have missed the initial long call, and also the second opportunity to buy on the retest of 1.16 yesterday, you may be given a third opportunity to catch some of the move if H4 price closes above 1.1651 and retests it as a support. From here you could drill down to the lower timeframes (see the top of this report) and search for an entry, targeting 1.17.
Data points to consider: US prelim UoM consumer sentiment at 3pm GMT; US banks closed in observance of Veteran’s Day.
Levels to watch/live orders:
- Buys: 1.1567 ([live] stop loss: breakeven).
- Sells: Flat (stop loss: N/A).
GBP/USD:
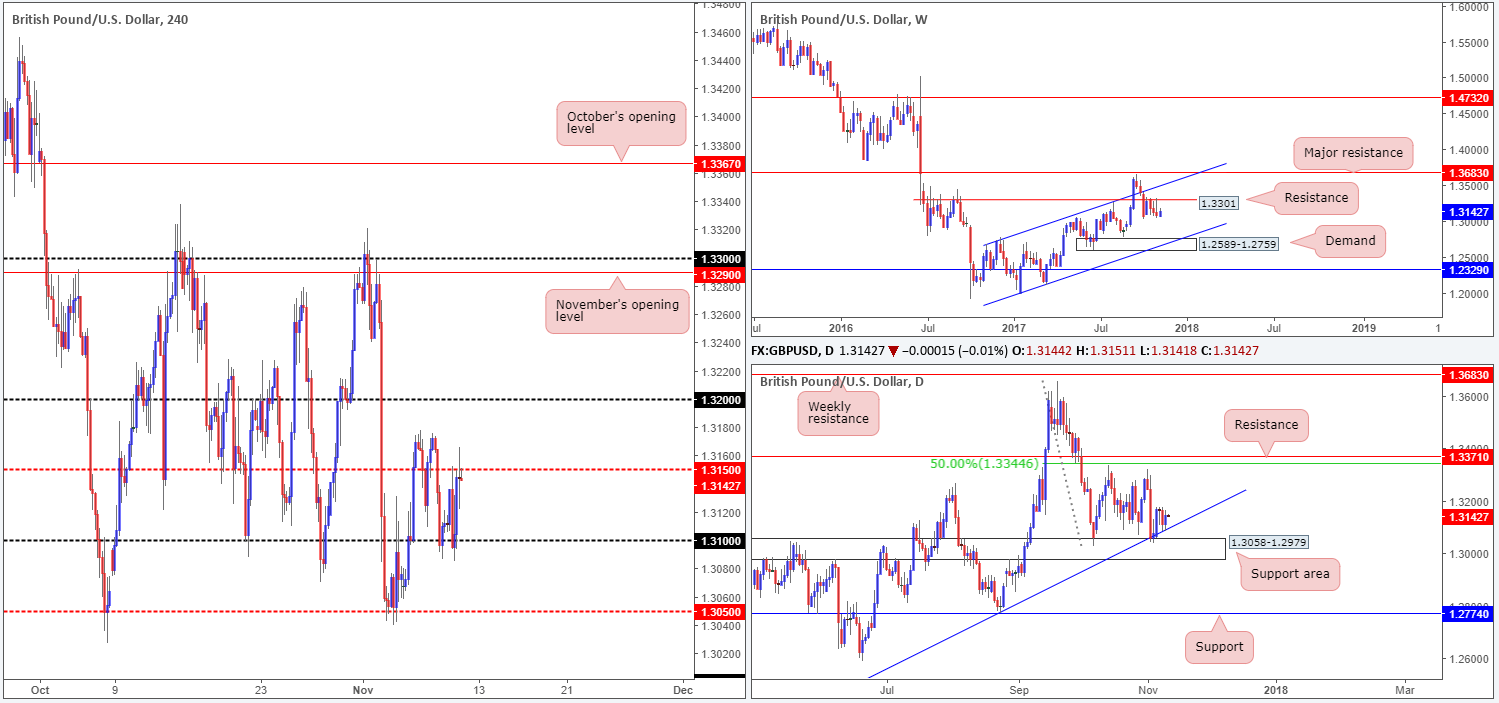
The GBP/USD spent Thursday’s session bouncing back and forth between the 1.31 handle and the H4 mid-level resistance 1.3150. As highlighted in Thursday’s report, 1.31 is reinforced by a daily trendline support etched from the low 1.2108, which is located a few pips above a daily support area at 1.3058-1.2979. Therefore, looking to fade current price from 1.3150 may not be the best path to take, unless you fancy going up against potential daily buyers!
The flip side to this, however, is that the weekly timeframe promotes more of a bearish tone. Since price cracked through support at 1.3301 at the beginning of October, the weekly candles have been establishing a resistance using this line. And with the next downside target on this scale not coming into sight until we reach demand pegged at 1.2589-1.2759, the bears certainly have room to stretch their legs.
Suggestions: Upside is somewhat blemished by the fact that we have a weekly resistance level in motion, and downside is capped by the aforesaid daily structures. This – coupled with there being little technical confluence seen on the H4 timeframe right now, well none that tickles our fancy, makes this a difficult market to get involved with right now.
Data points to consider: UK manufacturing production m/m as well as UK goods trade balance at 9.30am; US prelim UoM consumer sentiment at 3pm GMT; US banks closed in observance of Veteran’s Day.
Levels to watch/live orders:
- Buys: Flat (stop loss: N/A).
- Sells: Flat (stop loss: N/A).
AUD/USD:
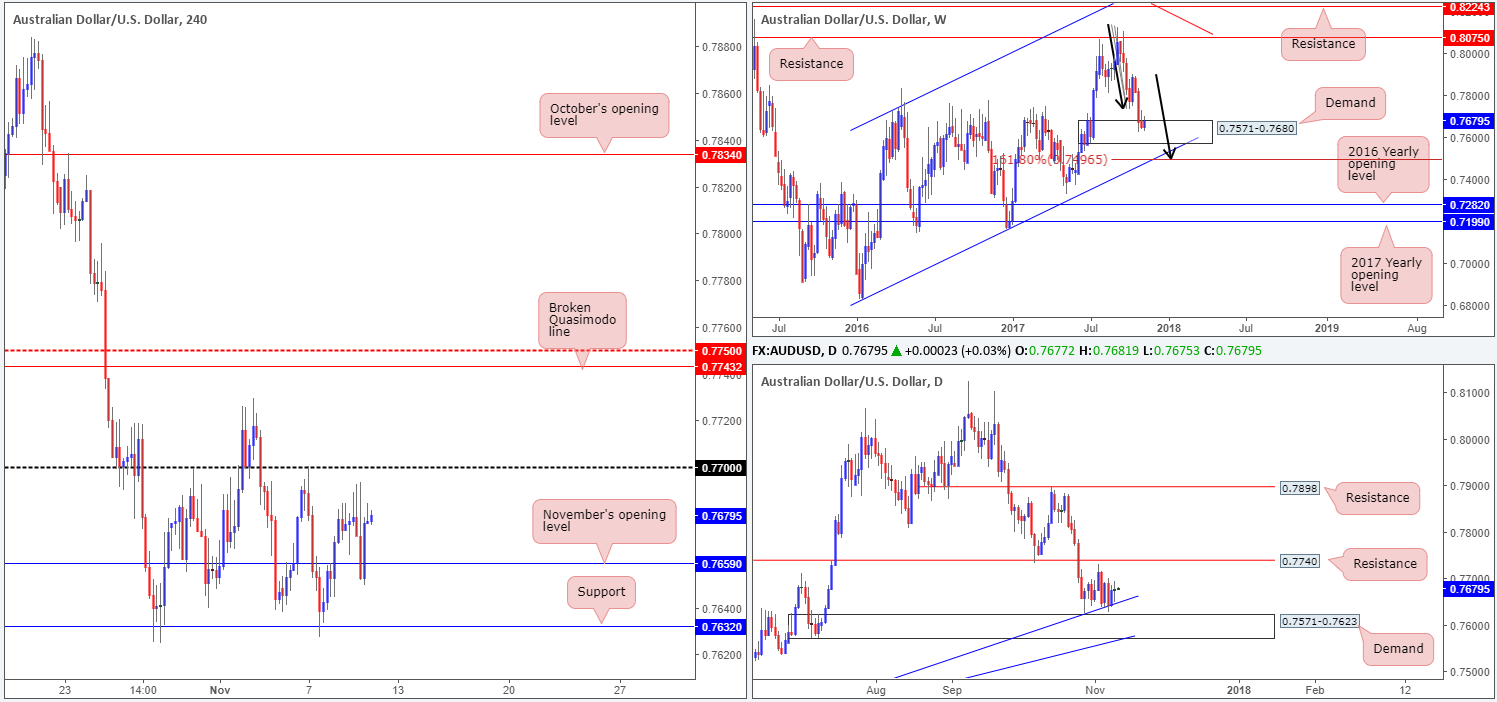
Despite clocking a high of 0.7693 amid yesterday’s London segment, and reversing from November’s opening level at 0.7659 going into the US session, the commodity currency is effectively unchanged this morning.
Assuming that the bulls remain in the driving seat today, the next upside objective can be seen around the 0.77 handle. Beyond here, we’re eyeing the broken Quasimodo line plotted at 0.7743, followed closely by the mid-level resistance 0.7750.
On the weekly timeframe, the buyers and sellers remain battling for position within the walls of a demand area coming in at 0.7571-0.7680. In conjunction with the weekly timeframe, there’s a daily demand area also plotted at 0.7571-0.7623 (seen housed within the lower limits of the current weekly demand) that converges with a daily trendline support drawn from the low 0.7328.
Suggestions: With higher-timeframe bulls expected to eventually make an appearance, we still have our eye on intraday longs above 0.77. A decisive H4 close beyond this number, followed up with a retest and a lower-timeframe buy signal (see the top of this report) is, in our book, enough to warrant an intraday play up to at least the 0.7740ish region (the next upside target on the daily timeframe: resistance).
Be that as it may, with the RBA’s monetary policy statement set to take the limelight in an hour, technical setups may have to take a back seat, at least until the dust settles.
Data points to consider: RBA monetary policy statement at 12.30am; US prelim UoM consumer sentiment at 3pm GMT; US banks closed in observance of Veteran’s Day.
Levels to watch/live orders:
- Buys: Watch for H4 price to engulf 0.77 and then look to trade any retest of this level seen thereafter ([waiting for a lower-timeframe buy signal to form following the retest is advised] stop loss: dependent on where one confirms this level).
- Sells: Flat (stop loss: N/A).
USD/JPY:
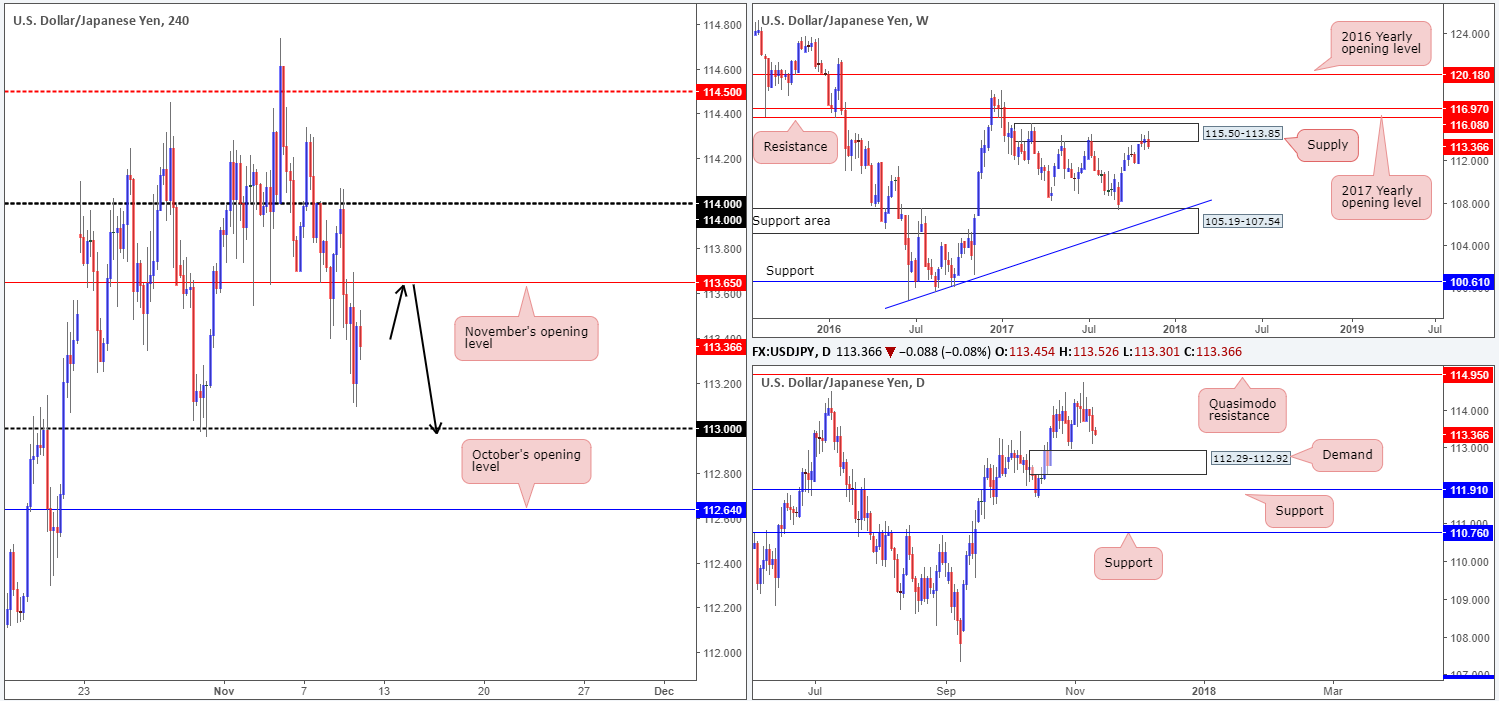
Failing to sustain gains beyond the 114 handle on Thursday, the pair, as you can see, spent the day tumbling lower. Cracking its way through November’s opening level at 113.65, and shortly after retesting the line as resistance, the USD/JPY struck a low of 113.09.
The bearish tone was likely triggered by the confirmation that Senate Republicans plan to propose delaying tax cuts to corporations until 2019, against Trump’s intentions to make immediate changes. From a technical standpoint, however, we can see that the weekly candles remain trading around the underside of a supply zone penciled in at 115.50-113.85.
Suggestions: The only opportunity jumping out at us this morning is a short from November’s opening level mentioned above at 113.65. Downside is free on both the weekly and daily charts; at least until the daily demand base comes into the picture at 112.29-112.92. In addition to this, there’s little H4 structure stopping the unit from connecting with the 113 handle today.
To secure a sell from 113.65, nonetheless, we would require a full or near-full-bodied H4 bearish candle to form. This will help confirm that there are still active sellers residing here, since the majority may have already been filled during yesterday’s retest.
Data points to consider: US prelim UoM consumer sentiment at 3pm GMT; US banks closed in observance of Veteran’s Day.
Levels to watch/live orders:
- Buys: Flat (stop loss: N/A).
- Sells: 113.65 region ([waiting for a reasonably sized H4 bearish candle to form – preferably a full or near-full-bodied candle – is advised] stop loss: ideally beyond the candle’s wick).
USD/CAD:
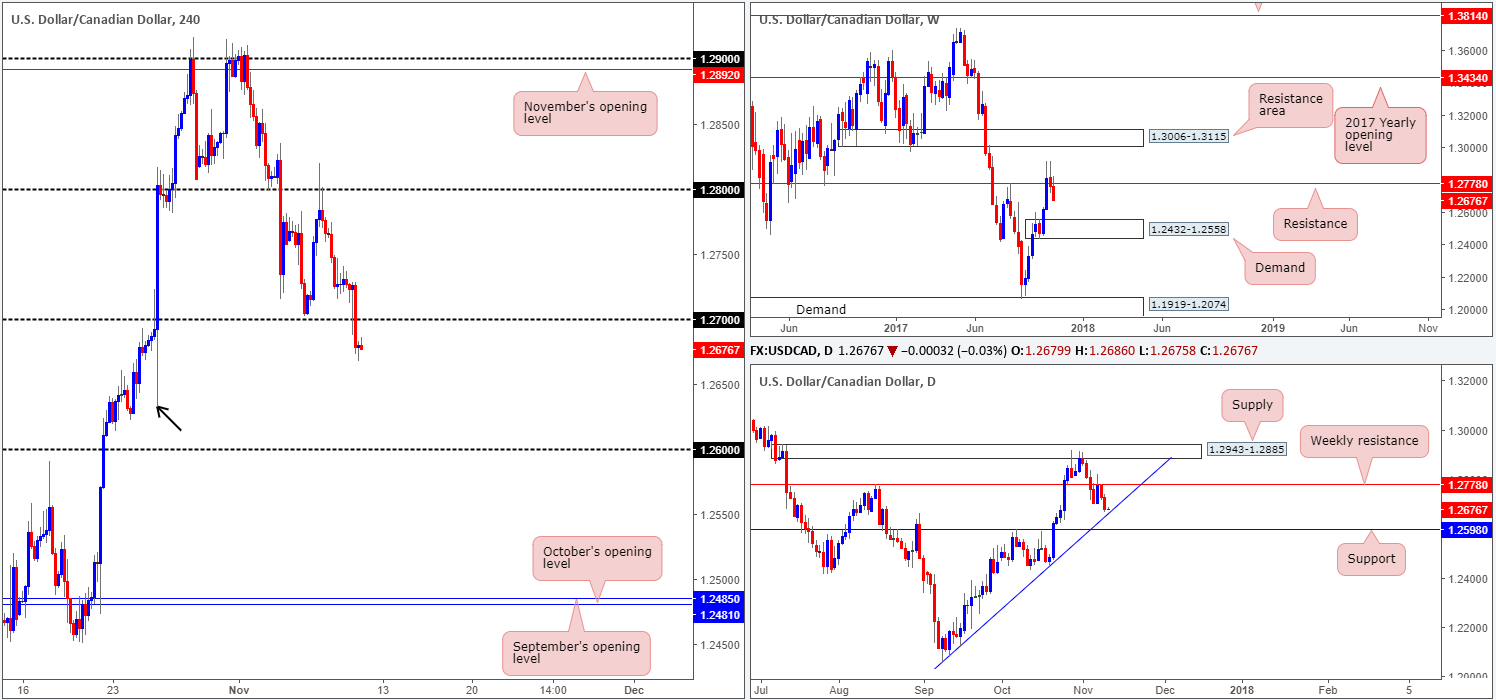
The USD/CAD came under pressure going into yesterday’s US session on US Senate tax plan disappointment. Outmuscling bids around the 1.27 handle, the pair managed to clock a low of 1.2667 going into the day’s end.
According to the H4 structure, the recent move has quite possibly opened up the path south down to the 1.26 handle. The large H4 tail marked with a black arrow at 1.2631 has likely cleared a truckload of bids with this move. Downside is further influenced by the fact that weekly price is seen trading beneath resistance at 1.2778. While further selling does seem favored at the moment, knowing that a sell below 1.27 would almost immediately land one within striking distance of a daily trendline support etched from the low 1.2061 unfortunately makes this a somewhat risky sell, in our book.
Suggestions: On account of the above structure, the team has come to the conclusion that it’d be best to remain flat for the time being.
Data points to consider: US prelim UoM consumer sentiment at 3pm GMT; US banks closed in observance of Veteran’s Day.
Levels to watch/live orders:
- Buys: Flat (stop loss: N/A).
- Sells: Flat (stop loss: N/A).
USD/CHF:
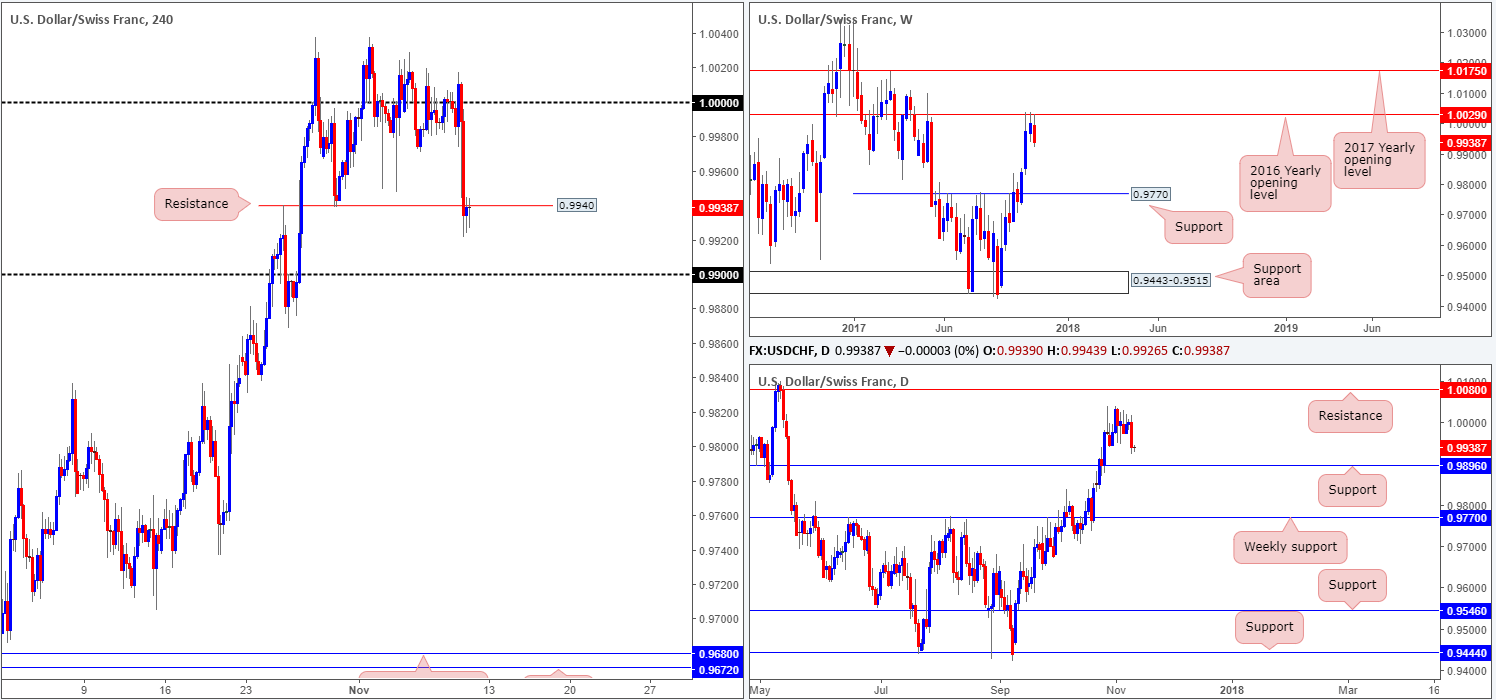
News from the US Senate proposing to delay tax cuts to corporations until 2019 disappointed market participants on Thursday. After a couple of monotonous weeks seesawing around parity (1.0000), the Swissie plunged lower on recent news and closed beneath H4 support at 0.9940 (now acting resistance), potentially opening up downside to 0.99.
Technically speaking, this move was expected since over on the weekly chart the 2016 yearly opening level at 1.0029 is currently in play. Also of interest is the daily timeframe, which shows room for the bears to punch as far south as the support level coming in at 0.9896.
Suggestions: Selling this market on an intraday basis from the underside of the noted H4 resistance could be an option today, targeting 0.99, which fuses beautifully with daily support mentioned above at 0.9896.
One would need a reasonably tight stop-loss order to make this trade feasible, as you will still want to collect at least two times your risk here. Therefore, a stop of no more than 20 pips should be the objective. Drilling down to the lower timeframes here may help secure this trade.
Data points to consider: US prelim UoM consumer sentiment at 3pm GMT; US banks closed in observance of Veteran’s Day.
Levels to watch/live orders:
- Buys: Flat (stop loss: N/A).
- Sells: 0.9940 region ([waiting for a lower-timeframe sell signal to form – see the top of this report for ideas on how to do this – is advised] stop loss: dependent on where one confirms this level – ideally the stop should be no more than 20 pips).
DOW 30:
US equities extended losses on Thursday after the US Senate offered to delay tax cuts to corporations until 2019. The index violently whipsawed through November’s opening level at 23392 and the H4 channel support etched from the low 23250, just missing the top edge of a H4 demand base logged at 23261-23297. Over 60% of the losses, however, were reclaimed as the H4 candles climbed back above the H4 channel support line into the close. Likely helping price here was the daily demand base penciled in at 23321-23403.
Suggestions: Put simply, we’re going to be watching for price to stabilize around the noted H4 channel support today. A long from this region could prove fruitful, as the next upside target is pegged at the neighboring H4 channel resistance taken from the high 23452. However, today’s action is likely to sport a lackluster tone, given that US banks are closed in observance of Veteran’s Day.
Data points to consider: US prelim UoM consumer sentiment at 3pm GMT; US banks closed in observance of Veteran’s Day.

Levels to watch/live orders:
- Buys: Eyeing the current H4 channel support line for a possible long trade ([waiting for a reasonably sized H4 bullish candle to form from here – preferably a full or near-full-bodied candle – is advised] stop loss: ideally beyond the candle’s tail, or below November’s opening level at 23392).
- Sells: Flat (stop loss: N/A).
GOLD:
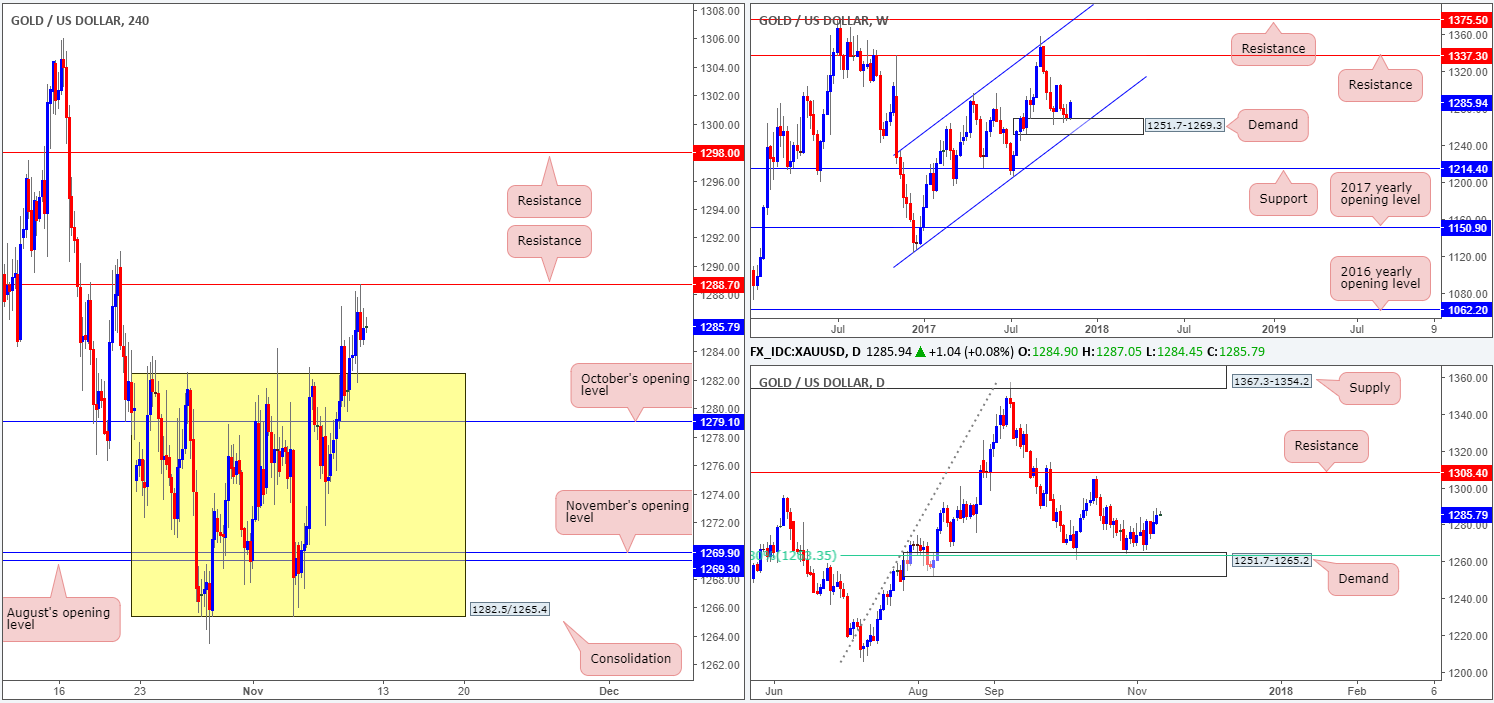
Thanks largely to a depreciation in the dollar market on Thursday, the yellow metal breached the top edge of the H4 consolidation at 1282.5 and shook hands with a H4 resistance level coming in at 1288.7.
As far as we can see, it would be risky to short the noted H4 resistance for two reasons. Firstly, we do not have much space to profit since the top edge of the recently broken H4 range will now likely become a support. Secondly, weekly buyers are looking incredibly strong from the top edge of demand based at 1251.7-1269.3.
Suggestions: Watch for H4 price to close above the current H4 resistance at 1288.7. A decisive close above here followed up with a retest and a reasonably sized H4 bull candle (preferably a full, or near-full-bodied candle) would, in our book, be enough to warrant a buy trade, targeting H4 resistance at 1298.0.
Levels to watch/live orders:
- Buys: Watch for H4 price to engulf 1288.7 and then look to trade any retest seen thereafter ([waiting for a reasonably sized H4 bullish candle to form following the retest – preferably a full or near-full-bodied candle – is advised] stop loss: ideally beyond the candle’s tail).
- Sells: Flat (stop loss: N/A).


