Successful traders always follow the line of least resistance – Jesse Livermore.
While intricate trading strategies may impress, it’s unnecessary to succeed in the financial markets – keeping things simple is essential.
Most trading systems have one thing in common: the trend. In retrospect, a trending market is easily recognised on a price chart. The difficulty, however, comes in identifying a trend change in real-time.
Several technical indicators are in place to help determine a change in trend direction, with regression studies, moving averages, directional movement indicators and price action trend lines representing some of the more popular modes.
Unlike horizontal support and resistance levels, trend lines form at an angle. Tasked with the mission of defining a trend’s position, the market can either be advancing (bullish – an uptrend) or declining in price (bearish – a downtrend).
Ascending trend lines
An ascending trend line has a rising angle. A trend is intact as long as price action remains above the trend line.
Applying an ascending trend line on a price chart requires at least two/three subsequent higher lows, initiating the process at an established low point, or more commonly referred to as an anchor point.
As demonstrated in figure 1.1, a H1 chart of the EUR/USD, the ascending trend line forms its initial point at the October 1st low 1.0879. The second support point forms at the 1.0940 October 8 low and holds again at the 1.0991 October 15 low. October 25 witnessed a break of the said trend line (red arrow), suggesting sellers may have the upper hand. Although price action reclaimed the line and even retested the base once again as a support at the 1.1128 November 1 low, the trend eventually gave way and headed southbound.
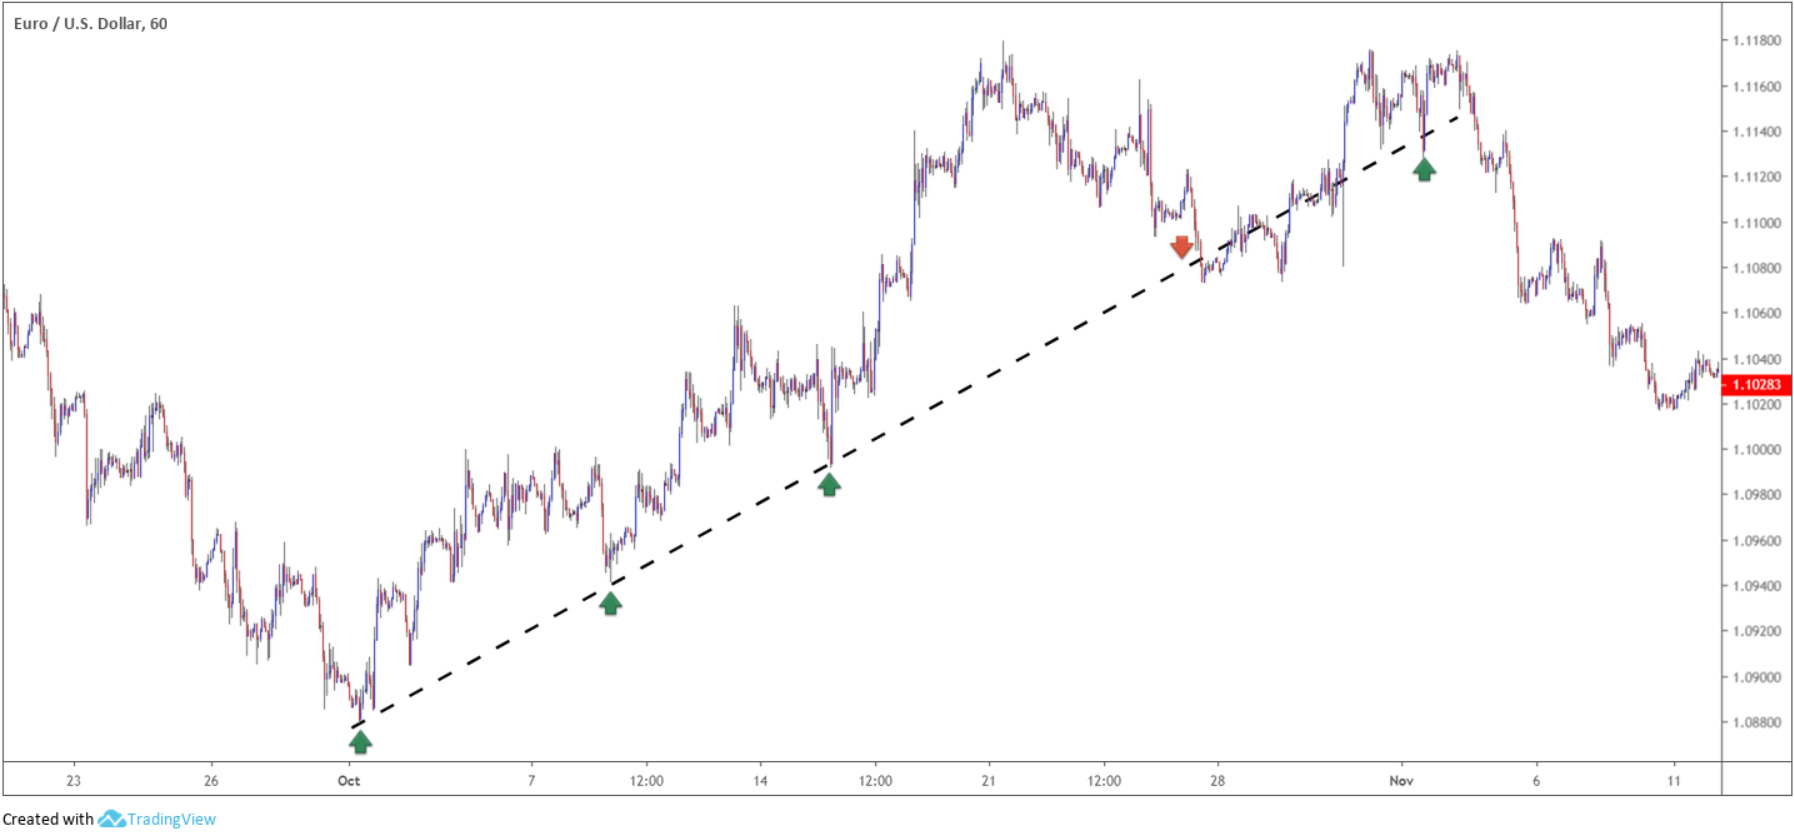
(FIGURE 1.1)
In addition to an ascending trend line, some traders use accelerating trend lines. Particularly in a speculative bubble or market panic, price often deviates from the normal trend line, forcing an adjustment to account for the deviation. Figure 1.2, using the same EUR/USD H1 chart, displays two accelerating ascending trend lines (blue), which, when broken, signalled a trend change much sooner than the initial ascending trend line, breaking lower on October 22.
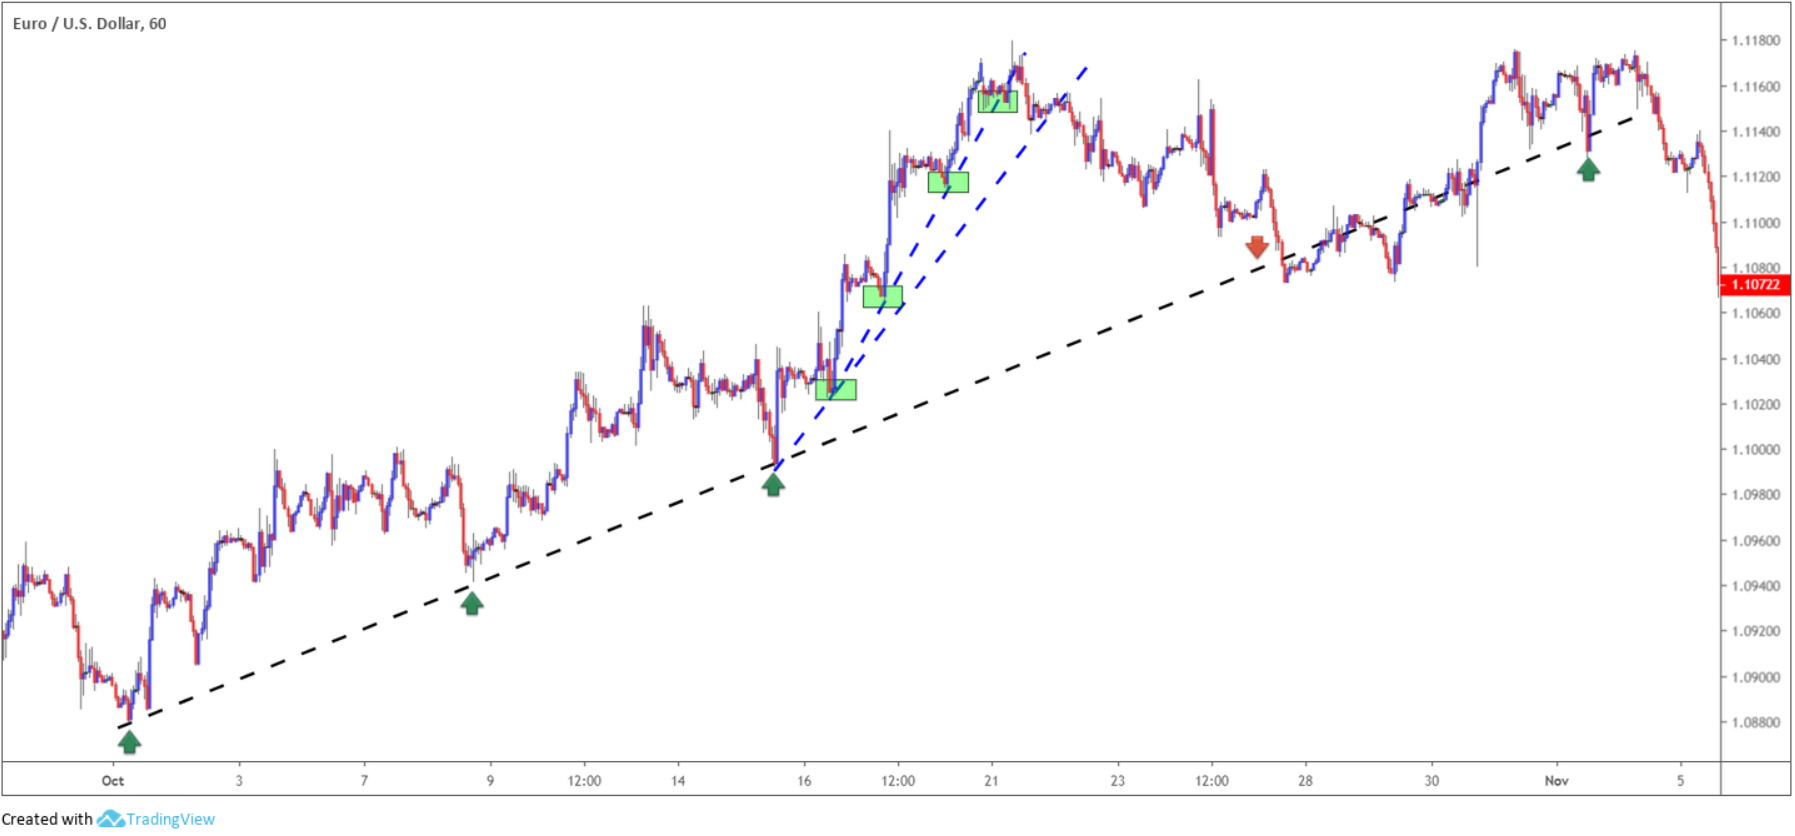
(FIGURE 1.2)
Descending trend lines
A descending trend line forms by way of a declining angle, connected by two/three subsequent lower highs as well as an established high as an anchor point.
Figure 1.3 illustrates a well-respected descending trend line, established from the 1.2518 February 2 high. Using the initial high point would have forced the trend line too far to the right; the second point, in this case, offered more of a logical choice. The trend signal change came about on February 12, which after a modest pullback, saw the pair rally north to fresh highs.
Similar to accelerating ascending trend lines, decelerating descending trend lines can also be applied.
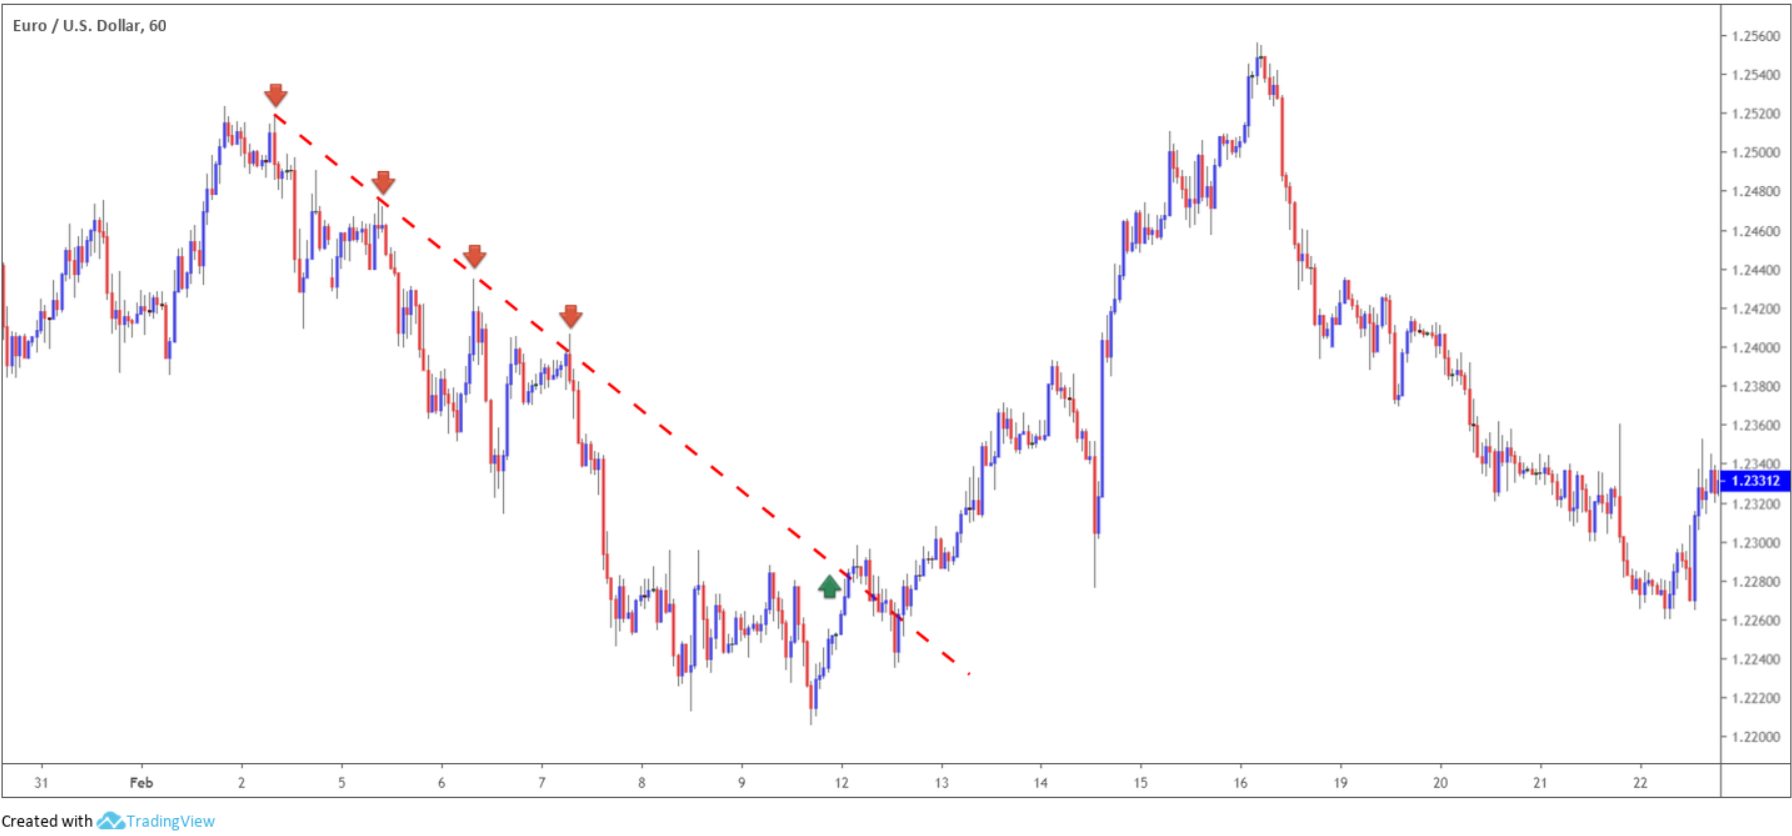
(FIGURE 1.3)
Trend line construction
As stated, at least two/three subsequent higher lows or lower highs are required before a trend line is worthy of consideration.
Many traders adopt both the candle shadows and bodies to apply trend lines. Adopting both forms allows the trader to pencil in a buffer zone. Like horizontal support and resistance levels, trend lines should never be considered a definitive line in the market. There are just too many factors affecting price. A trend line should always be viewed as an area.
Figure 1.4, an M15 GBP/USD chart, demonstrates a descending trend line with a buffer applied using the candle bodies/upper shadows. While not anything new, it does help provide an area, rather than a line to focus on.
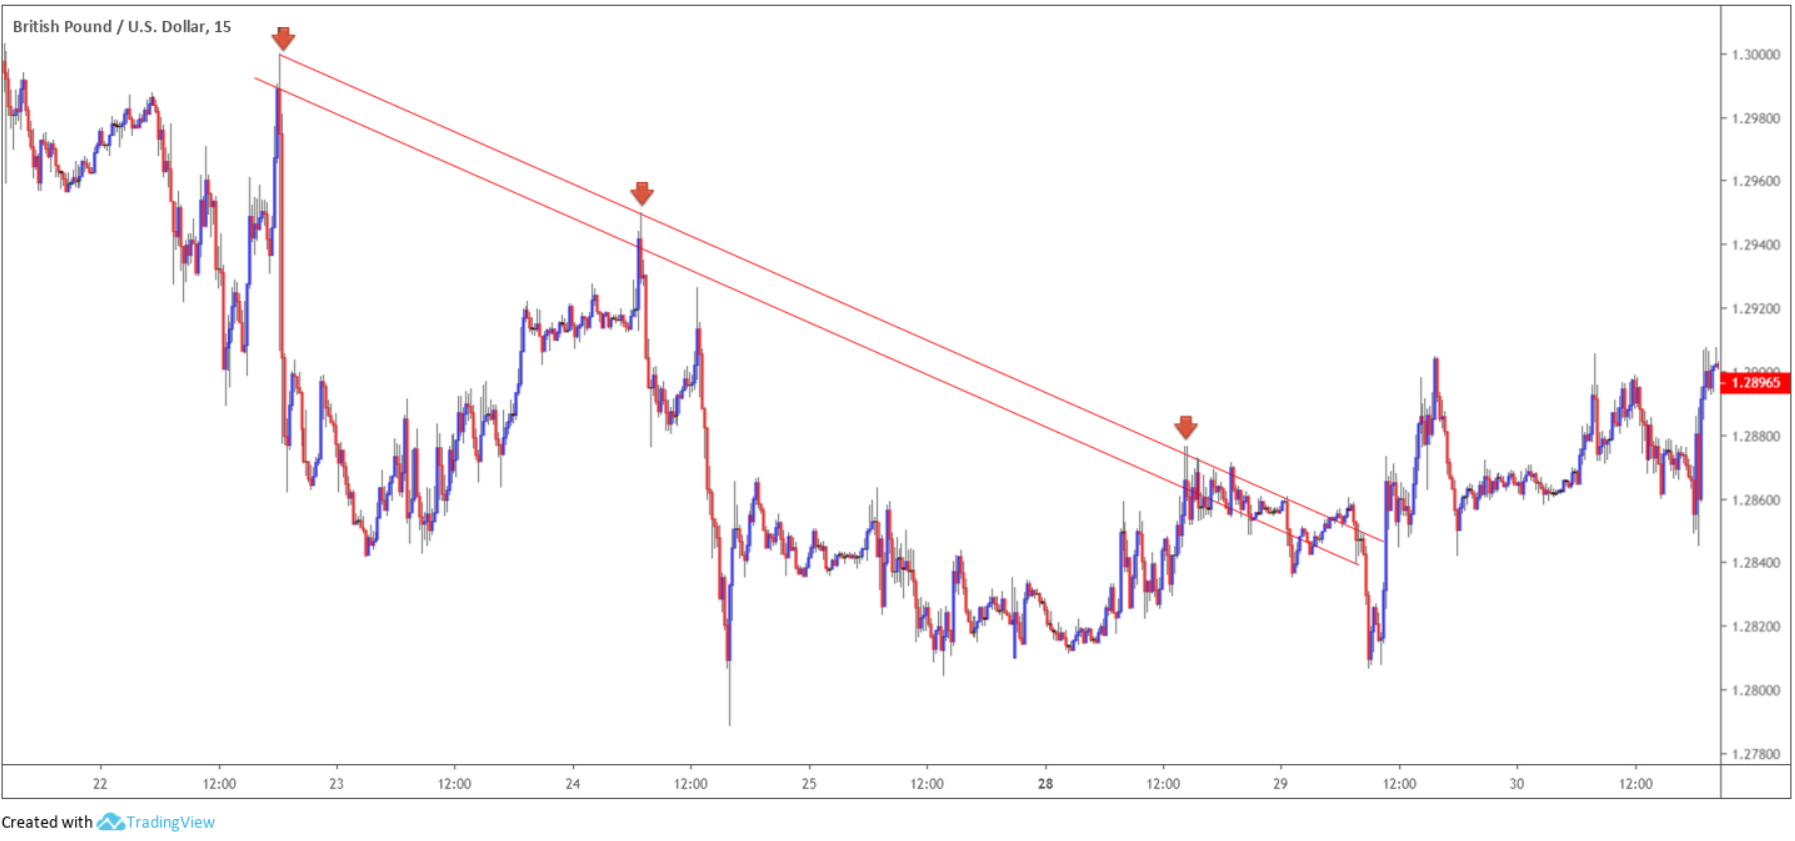
(FIGURE 1.4)
Support and resistance
The central purpose of a trend line is to signal a change in trend. However, trend lines can, and often do, offer support and resistance.
Each time price approaches a trend line, a rejection of the area is possible. Despite a slight deviation at point 3, the ascending trend line shown in figure 1.5 held more than 15 days of action on an M15 chart.
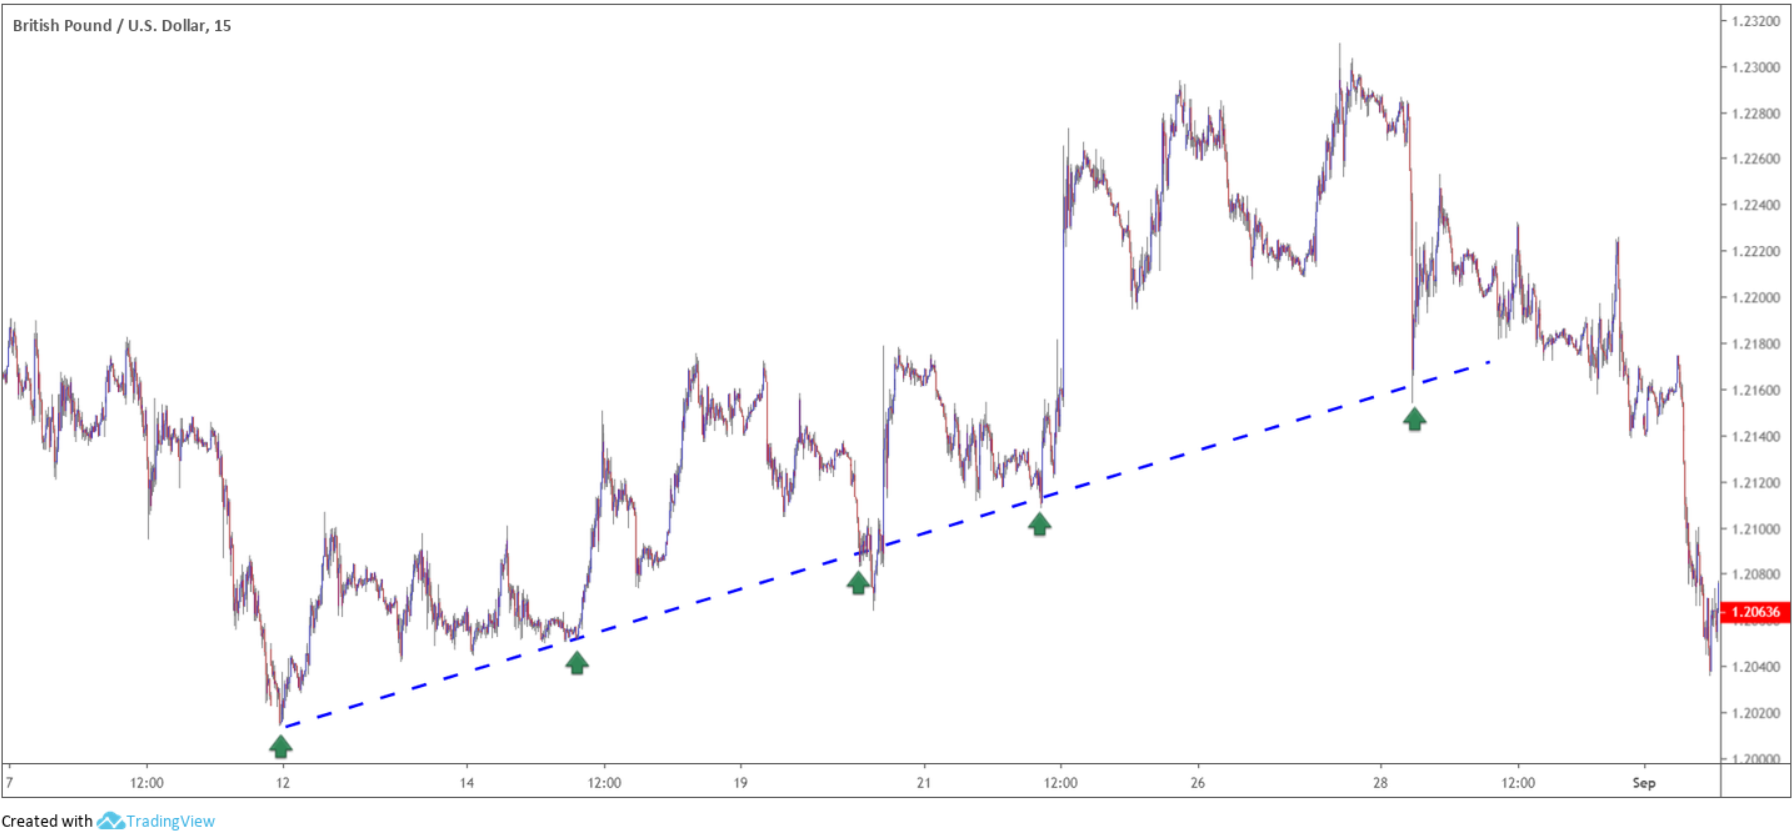
(FIGURE 1.5)
Channels
In the context of technical analysis, a channel forms when a currency pair remains compressed within two parallel trend lines.
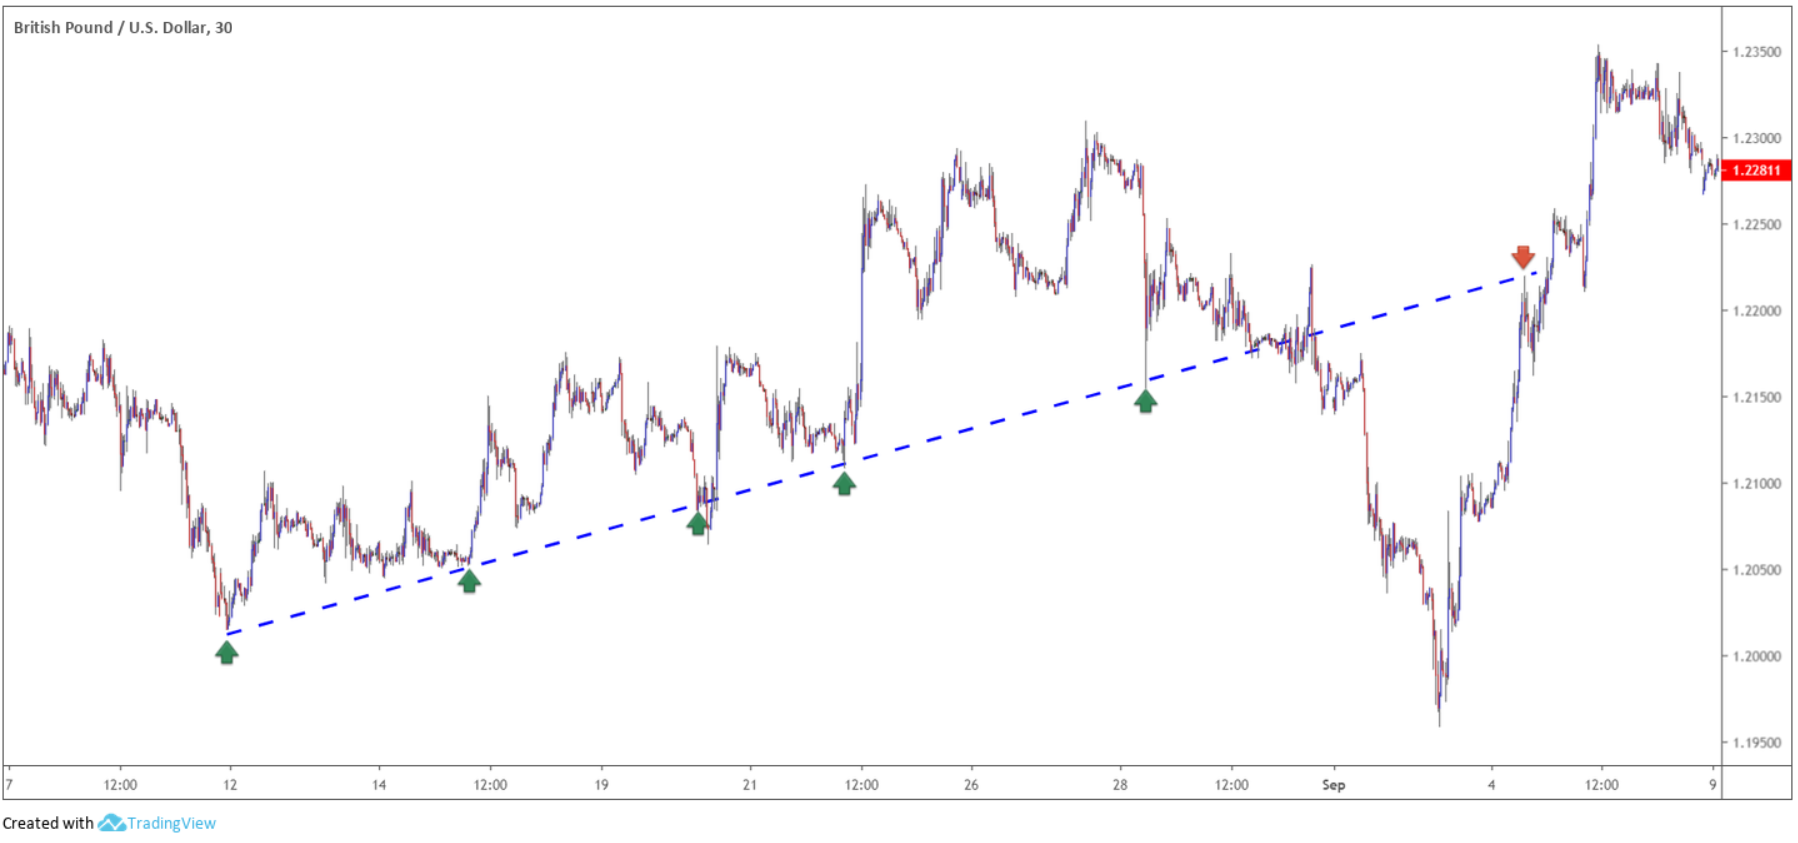
A channel line is applied immediately following two higher lows, in the case of an ascending channel. The channel line forms a target zone for any subsequent rallies. Traders, particularly those new to the industry, should trade channels only in the direction of the trend. Considering figure 1.6, an ascending channel, longs are an option at the lower edge of the channel (the green arrows), with a take-profit target set at the channel line (red arrows).
Like most concepts in technical analysis, patterns can/do fail. August 22 witnessed strong momentum to the upside, dethroning the channel line and retesting the broken level as support. Price later re-entered the channel and tested the trend line support once again, and rallied back to the channel line, almost to-the-point.
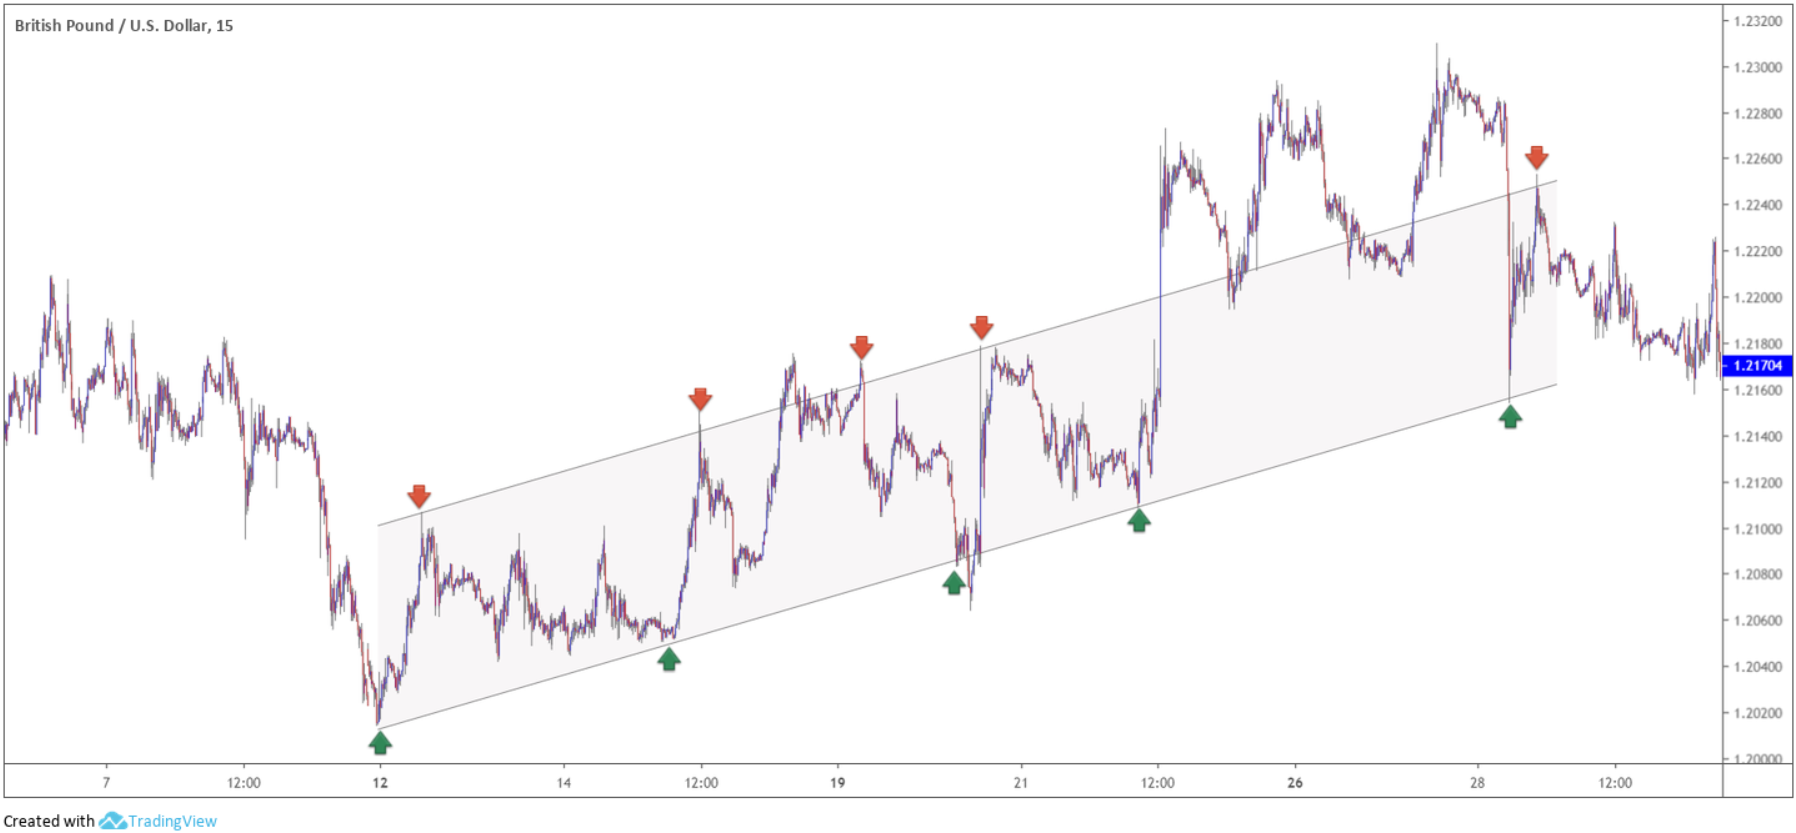
(FIGURE 1.6)
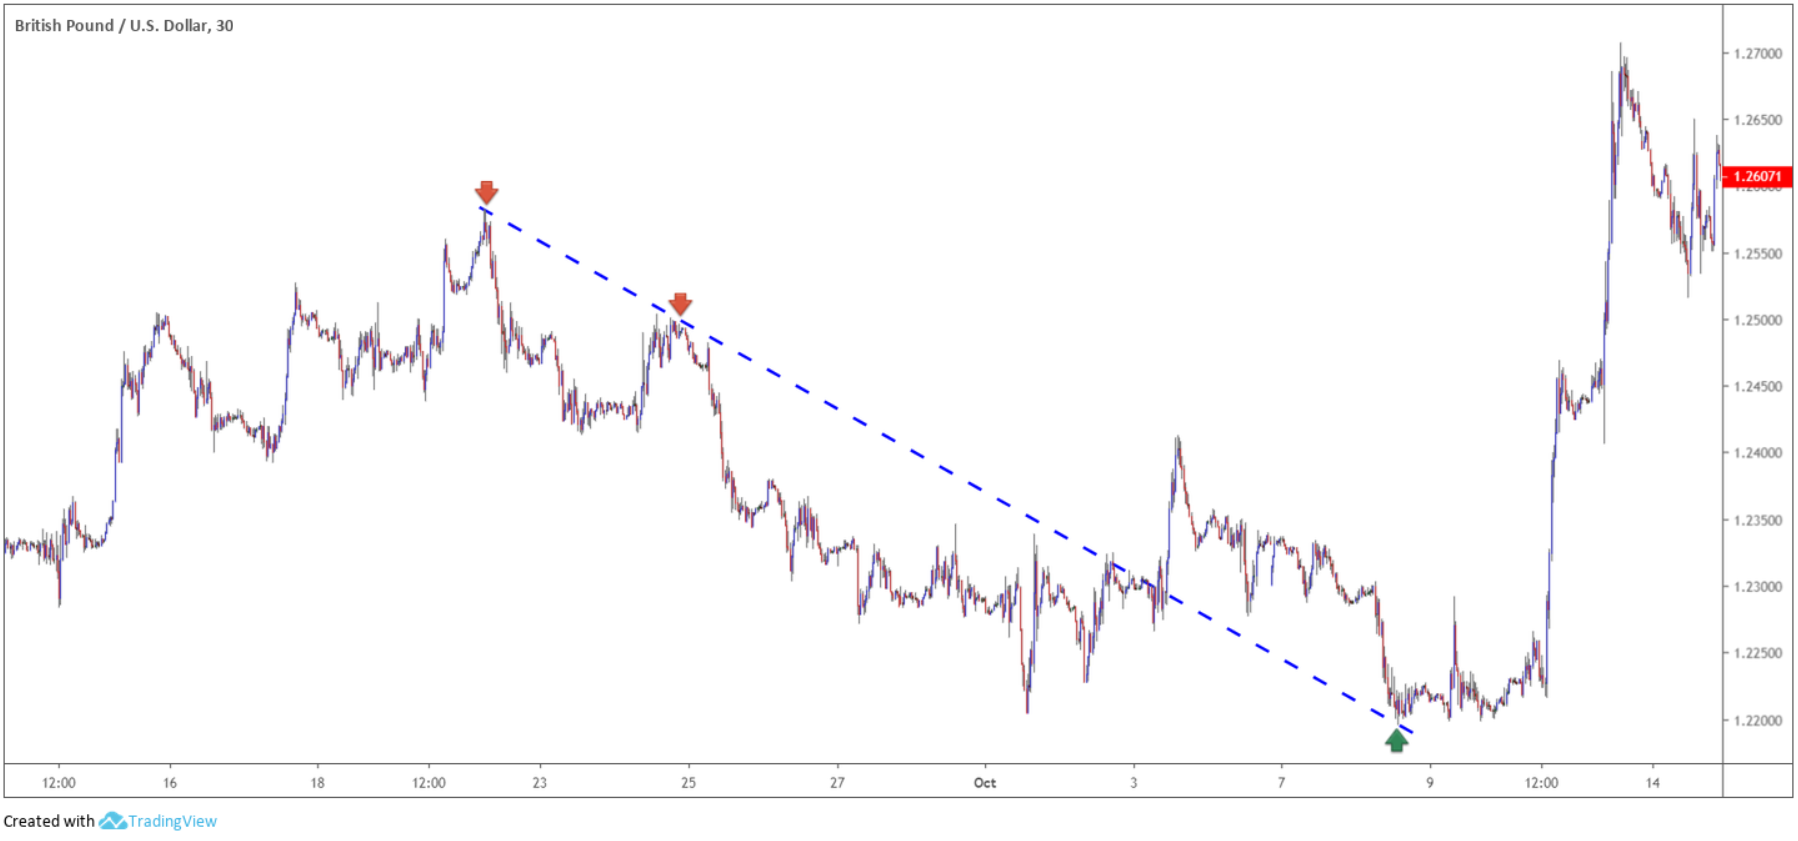
Figure 1.7 demonstrates a descending channel formation, with the sell zone represented by red arrows and the take-profit area recognised by green arrows.
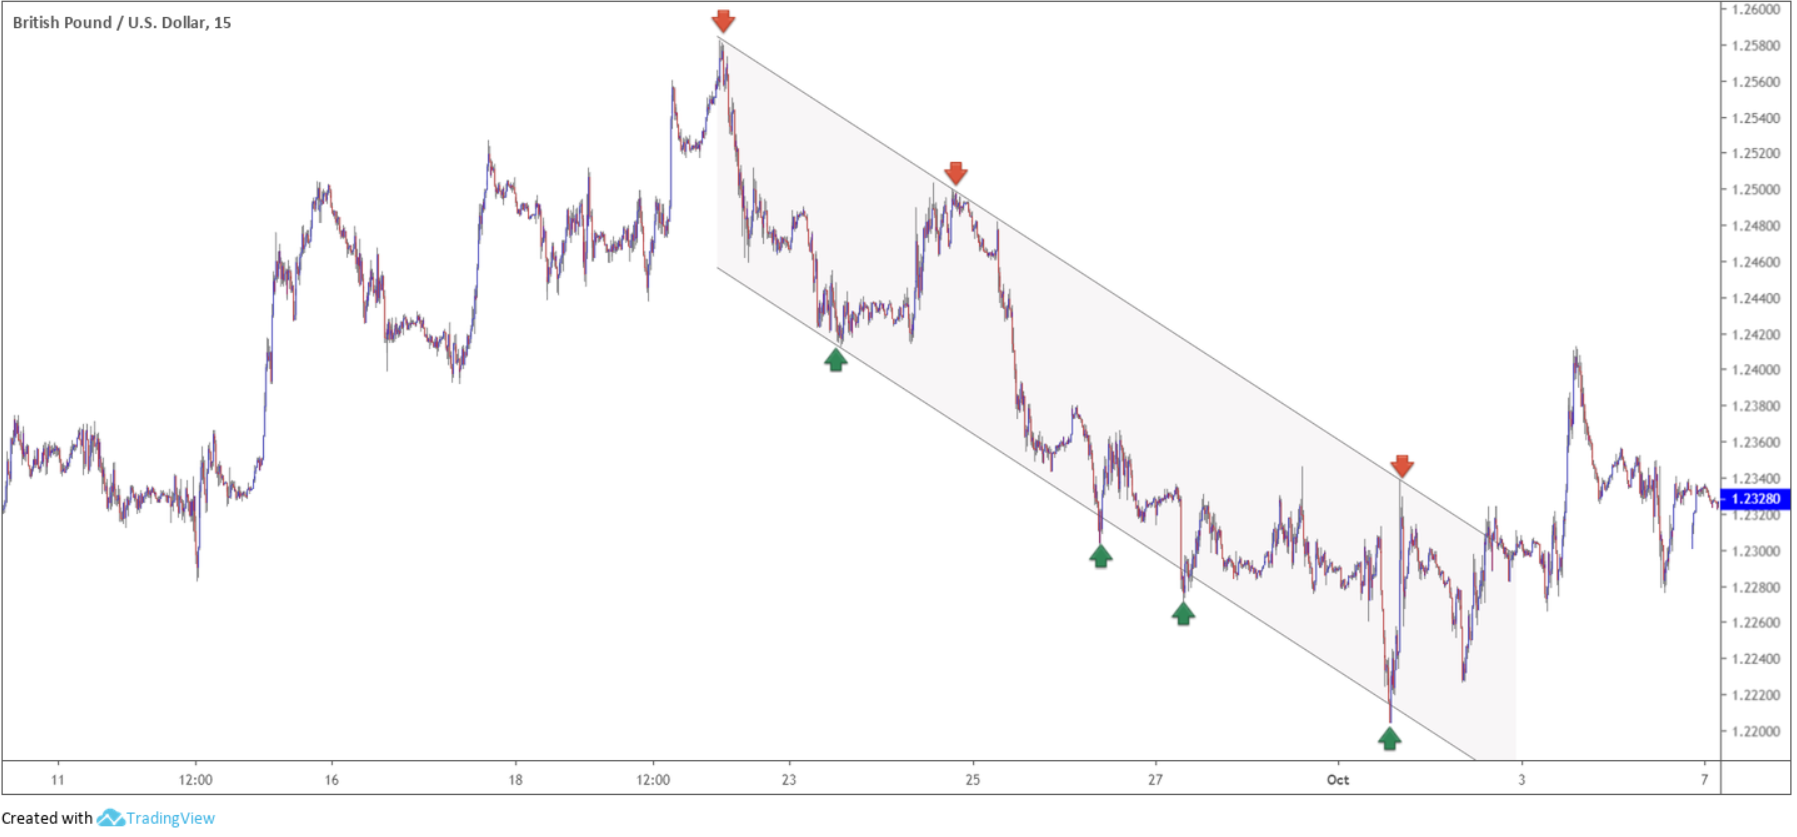
(FIGURE 1.7)
Andrew’s pitchfork
Developed by Dr Alan Andrews, the pitchfork marks a halfway point of a chart and two external boundaries. In a downtrend, traders select an established high, the next low and the first major retracement. Labelled points 1, 2 and 3, figure 1.8 shows the down trend found support at the halfway point twice and modestly responded from the upper limit, before turning higher. This is not the best of examples, though technical analysis is rarely a perfect art.
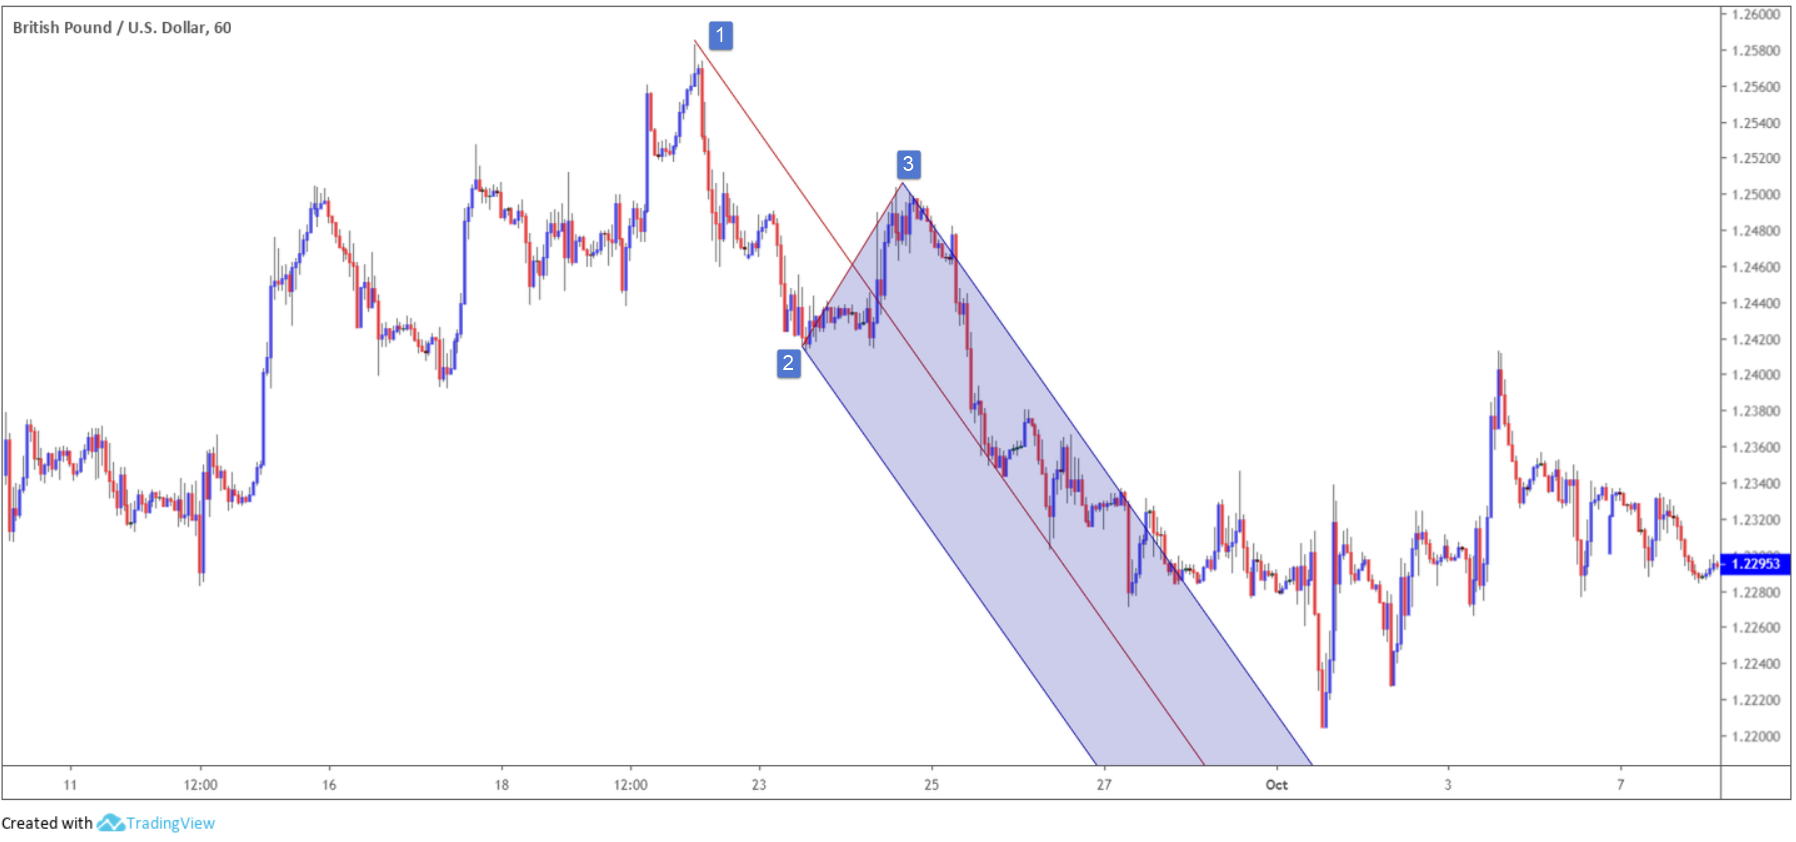
(FIGURE 1.8)
Trend line break
When a trend line gives way, a question often asked is if it still has use? Fortunately, it does. A broken trend line is sometimes drawn back into active duty if price reclaims its boundary. However, in many cases, a trend line finds support/resistance at the retest of the broken level, offering traders a chance to trade in the direction of the new trend. It’s surprising how effective this technique is.
Although cherry-picked to perfection, figure 1.9 displays a trend line resistance-turned support.
(FIGURE 1.9)
Figure 1.10, despite strong momentum formed on approach, demonstrates a period of resistance at the red arrow, a trend line support-turned resistance.
(FIGURE 1.10)
Applying trend lines to technical indicators
An often overlooked, yet highly effective, method of using trend line studies is the application of ascending and descending lines to trading oscillators. Indicators such as the moving average convergence divergence (MACD), stochastics and the relative strength index (RSI) appear to form patterns similar to price charts.
The RSI indicator typically finds its use when the oscillator reads an overbought or oversold signal. It is also great at finding divergences. However, drawing trend lines directly over the oscillator is also highly effective. Connecting rising swing lows in an uptrend or lower swing highs in a downtrend, traders can find excellent trading opportunities.
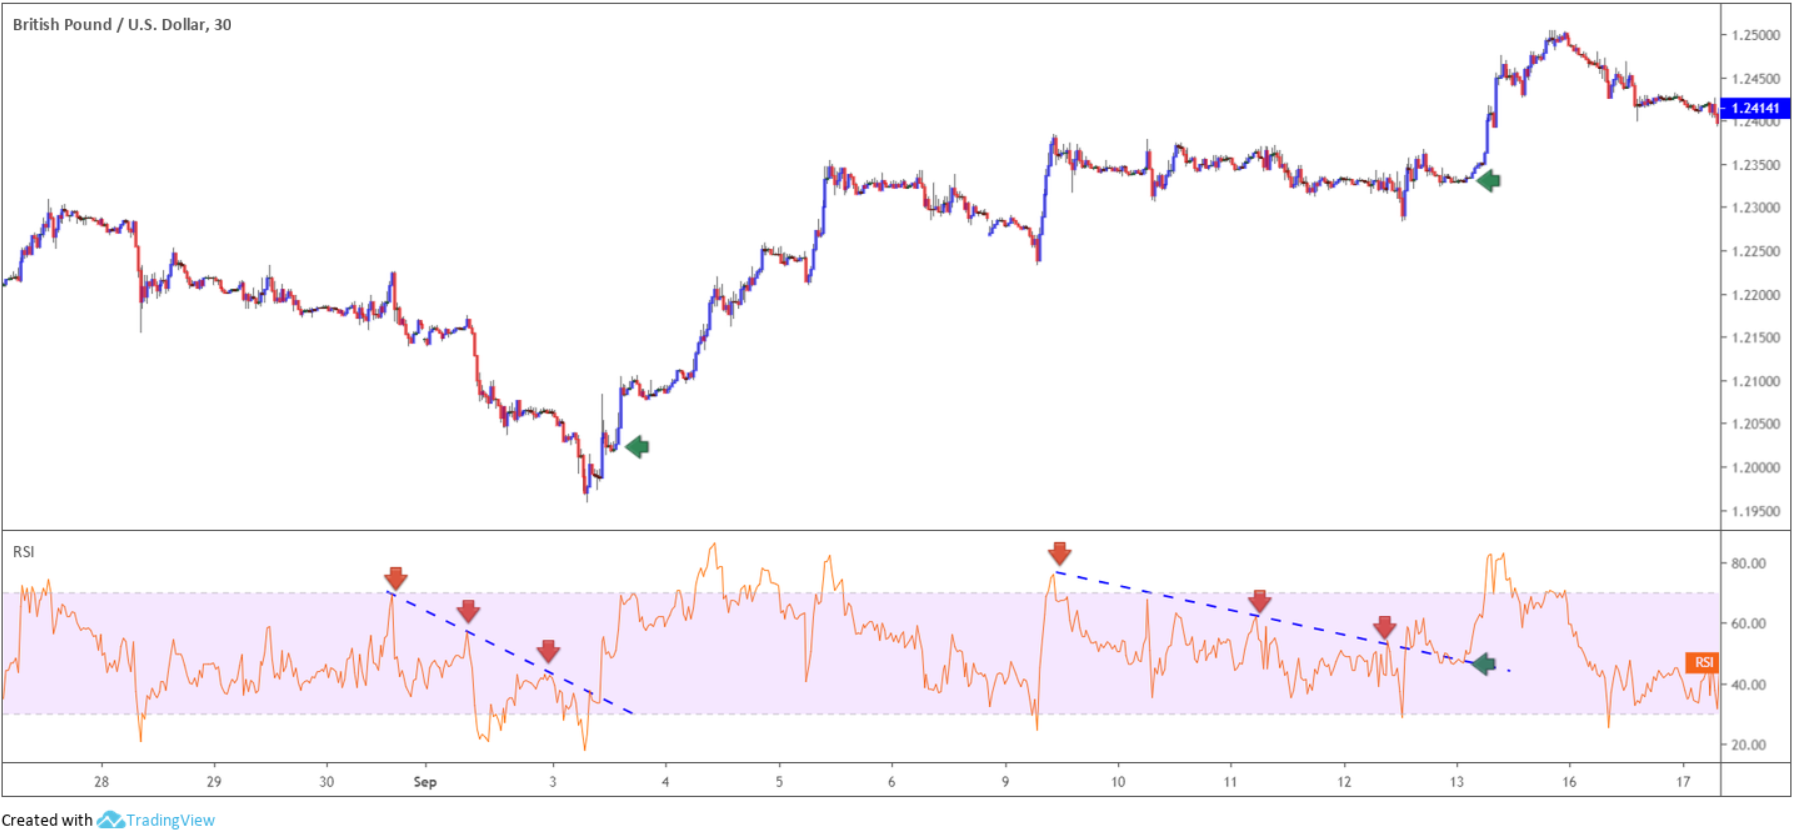
Figure 1.11 demonstrates two examples where the RSI trend line function anticipated a move higher in price due to a trend line break.
The first example shows the RSI value broke the descending trend line in force. What’s interesting is that following the break, price movement chalked up a pullback and allowed traders a cheaper entry (green arrow).
The second example was even better. Not only did an RSI trend line signal take shape to the upside, an RSI retest of this line followed shortly after, putting forward a strong case for a long entry at the green arrow on the price chart.
The RSI also has a fondness for horizontal support and resistance levels and head and shoulders patterns.
(FIGURE 1.11)
Additional points:
- The slope of a trend line determines the strength of the trend.
- Check correlating markets to confirm the break of a trend line. For example, a breach of a H1 trend line resistance on the EUR/USD along with a downside breach of a trend line support on USD/CHF – a negatively correlated market – adds weight to a favourable move.
- Is there a best timeframe to trade trend lines? No. However, some technicians favour higher-timeframe structure over the lower timeframes as they feel it’s more reliable.
- When trend lines merge with other technical tools such as, support and resistance, psychological numbers and supply and demand, the probability of a reaction being seen increases. Remember, the more reasons to buy or sell, the more likely it’ll occur.
- Trend lines are also great tools for trade management, leading to huge gains if handled correctly.
- Other trend line types worth researching are speed lines, trend lines on point and figure charts, internal trend lines and Gaan fan lines.


