Common among newer traders, the temptation to incorporate as many trading indicators as possible is appealing. The rationale behind this approach is simple: if most of the technical studies reach a similar conclusion, buy or sell in the direction of consensus. While this may appear a reasonable technique, it encourages a phase known as analysis paralysis.
Paralysis by analysis is best summarised as having too many indicators or rules for a trade setup, in which the trader is sometimes left powerless to move forward with an informed decision. This can lead to mistrust and concern.
Recognising analysis paralysis in trading
Nearly all the successful traders I know are one-trick ponies. They do one thing, and they do it very well – Steve Clarke
Analysis paralysis can occur when confronted with too many choices or tasks – information overload. The symptoms may include fear of making a wrong decision, delaying decisions, repeatedly analysing existing alternatives and endlessly searching for new replacements.
Overcoming analysis paralysis in trading is certainly not a case of simply sidestepping the risk profile and going with the flow. Several variables need addressing (all should be covered within a well-defined trading plan) before a trader can restrict the issue:
- The style of trading. Four primary trading styles exist: position trading, swing trading, day trading and scalping. The difference between the styles is based on the length of time trades are held for.
- The markets traded. Financial markets are found in almost every nation in the world: commodities, foreign exchange, equities and bonds, often called the debt market or credit market.
- The timeframes (refers to a specified periodicity the price action is displayed on a chart) and the tools (price action studies, technical indicators and economic calendars, to name but a few) used to make trading decisions.
- Fundamental analysis or technical analysis? As a general rule, fundamental analysis is a long-term investment strategy whereas technical analysis is considered more of a short-term methodology.
With all these choices to make – and above not being an exhaustive list – deciphering what is important is a challenge for many traders. Unfortunately, this often translates into a technical chart overflowing with indicators and price action studies, as shown in figure 1.1.
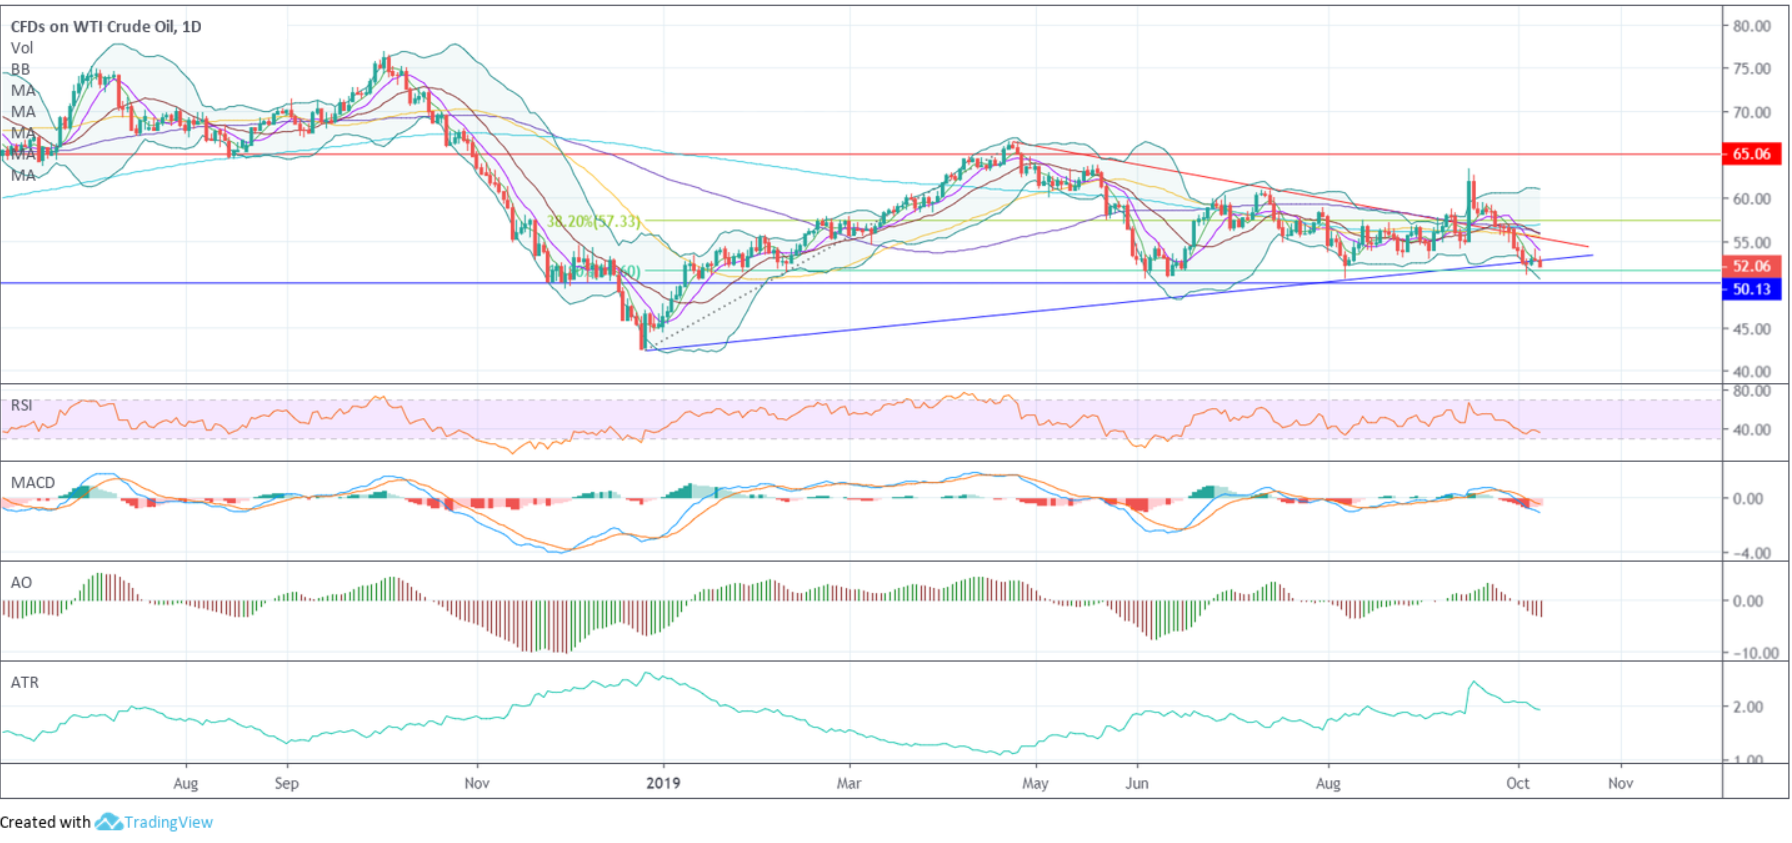
(FIGURE 1.1)
Coating charts with a myriad of price action levels and technical indicators will cause confusion, and ultimately give rise to analysis paralysis. It is understandable, as a newer trader, that covering all angles/potential scenarios on the chart is desirable. By doing this, though, a trader hinders their growth.
Compare figure 1.1 to 1.2. By clearing the canvas, market movement is presented in a more pronounced light. Applying well-placed support and resistance levels, along with the relative strength index (RSI) which is seen poised to challenge oversold territory, traders can see market action trades range bound and is approaching its lower limit for a potential reversal. Of course, the selection of components to include in a trading approach will be trader dependent.
However, do remain mindful that technical indicators such as the RSI, the moving average convergence-divergence (MACD) and the stochastics are based on price data, also known as momentum oscillators. They are similar price manipulations, providing roughly the same results. This is not to say a different manipulation on price data cannot be helpful, only that the base data itself is the same. With that being the case, observing several momentum oscillators concurrently over the same period, such as the ones underlined above, is of little value because by their nature, they draw similar conclusions.
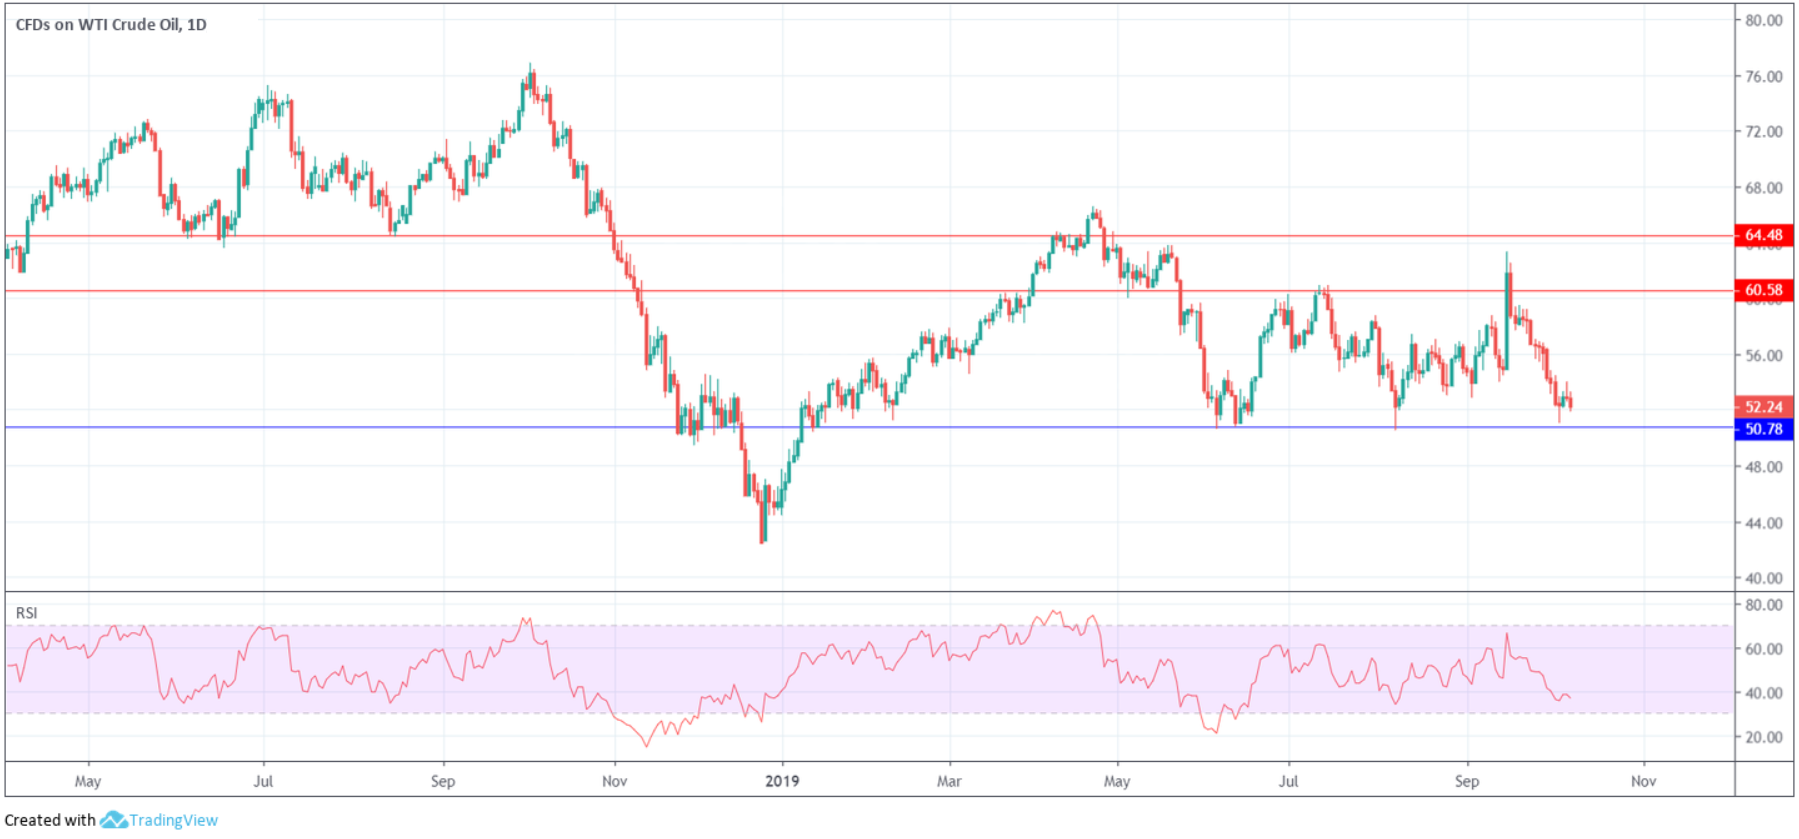
(FIGURE 1.2)
Avoiding analysis paralysis
Traders need to be independent thinkers and follow a back tested trading strategy to circumvent the effects of analysis paralysis. This may come across as a simple remedy, but it can be tough for traders who are accustomed to having full charts and a litany of checkpoints to cover.
The overall methodology should outline everything needed to make an objective informed decision, including strict entry and exit points, money management and risk principles. Employing a strategy that has a positive expectancy – defined as how much money, on average, we can expect to make for every dollar we risk – presents a checklist for traders to follow before, during and after a trade.
The checklist will inform the trader whether an opportunity is present that matches the trading strategy. If conditions are not met, the trade should simply not be considered. Looking for a position that isn’t there will potentially unbolt the door for a phase of analysis paralysis which could include adding indicators or other studies that have not been tested. It will be worse if the trader ventures down this path and the trade works – it will encourage breaking of rules in the future, taking bigger risks and eventually losing money.
If conditions are met, double-check to verify the checklist/trading strategy – simply make sure nothing was missed the first time around, and then place the trade.
Trading should be as objective and as mechanical as possible
Feeling the need to overanalyse a setup is a sign you’re either not following the rules of your (tried and tested) trading methodology, or you simply don’t have a plan at all. If you’re the latter, do yourself a favour and start pencilling down your approach and testing it. This, as highlighted above, will help no end and should, with time, help control the need to overthink setups.
Notes:
Jack D. Schwager (Author), Ed Seykota (Foreword), 2012: Hedge Fund Market Wizards: How Winning Traders Win. John Wiley & Sons, inc., Hoboken, New Jersey.
Charles D. Kirkpatrick II and Julie R. Dahlquist, 2016: Technical Analysis: The Complete Resource for Financial Market Technicians. Old Tappan, New Jersey: Pearson Education, Inc.


